Archive:Main differences between older and younger people on the EU labour market - statistics
This article has been archived.
Highlights
In the European Union (EU), the last two decades have been marked by a steady increase in the employment of people aged 55-64 years. In all EU Member States, the overall trend shows that people remain longer in employment, pushing up the age of retirement. The COVID-19 pandemic seems also to have, so far, not caused a major loss of employment as the employment rate for people aged 55-64 is less fluctuant in 2020 than for younger people. To illustrate this development simply, around four in 10 persons aged 55-64 were employed in the EU in 2006 against six in 10 in 2020.
Using data from the EU Labour Force Survey (EU-LFS), this article focuses on the main differences between older and younger people as regards their labour status (as defined by the International Labour Organisation (ILO), i.e. whether they are employed, unemployed or outside the labour force) and the associated socio-demographic and socioeconomic determinants. In the context of this article linked to the labour market, the groups of younger and older people are defined as people aged 20 to 54 years and people aged 55 to 64 years respectively. The evolution over time, comparing the years 2006 and 2020, is also looked at for the two age groups regarding the possible impact of the socio-demographic characteristics on the ILO labour status. Results are presented for the EU as a whole, but also for all EU Member States individually, for three EFTA countries (Iceland, Norway and Switzerland) and four candidate countries (Montenegro, North Macedonia, Serbia and Turkey).
In addition to descriptive statistics, this article presents results from Chi-square independence tests, as well as from logistic regressions using the socio-demographic and socioeconomic determinants as independent variables and the ILO labour status as dependent variable.
In particular, this article aims to answer the following question: do older workers have the same profile as younger people, in terms of gender, educational attainment level, country of birth and occupation?
Full article
Focus on gender
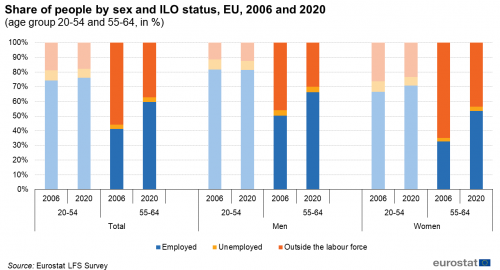
Figure 1 examines the differences at EU level between people aged 20-54 and 55-64 with regard to the labour market, with a focus on gender.Looking at the 20-54 year-old population, the rate of employed people increased by 2.0 percentage points (p.p.) from 2006 to 2020, with a decrease of around 1.0 p.p. for the share of unemployed people and the share of people outside the labour force. By contrast, the proportion of employed people among the age group 55-64 grew by 18.4 p.p. from 2006 to 2020, i.e. this age group had a much higher increase in its employment rate than the younger population. The increase in the employment rate for people aged 55-64 was accompanied by a decrease of 18.7 p.p. in the share of people outside the labour force and a slight increase, of 0.3 p.p., in the share of unemployed people in the 15 year period from 2006 to 2020.
Results in terms of gender show that the labour market situation for men aged 20-54 remained relatively stable between 2006 and 2020, with the largest change during this period being the share of people outside the labour force, which increased by 1.1 p.p. Women aged 20-54 had a more pronounced evolution from 2006 to 2020 regarding the labour market situation. The female employment rate increased by 4.3 p.p., while the share of unemployed women decreased by -1.2 p.p. and the share of women outside the labour force declined by -3.1 p.p.
In contrast, women aged 55-64 had a 20.8 p.p. increase in their employment rate, a 0.5 p.p. increase in their share of unemployed people and a 21.3 p.p. reduction in their share of people outside the labour force from 2006 to 2020. Men in the age group 55-64 experienced smaller changes than their female counterparts. However, the evolution was still significantly larger for men aged 55-64 than for men aged 20-54. With regard to the age group 55-64, the male employed population increased by 15.9 p.p. from 2006 to 2020, the decrease in the share of men outside the labour force had exactly the same size (15.9 p.p.), while the share of unemployed men remained stable over that period.
Despite a much more pronounced increase between 2006 and 2020, the employment rate for people aged 55-64 did not reach the rate recorded for younger people. In 2020, 76.2 % of people aged 20-54 were employed in the EU. With 59.6 %, the equivalent share for people aged 55-64, was still significantly smaller. Among the younger men, i.e. aged 20-54, 81.4 % were employed, compared with 66.2 % for the older male population. Although the employment rate for women in both age groups (20-54 and 55-64) was smaller than for men, the same pattern can be seen: a larger share for the younger age group in comparison with the older (70.8 % versus 53.4 %).
Looking deeper into the three ILO labour statuses separately (i.e. employed, unemployed and outside the labour force), the Chi-square independence tests show that for employed people specifically, it can be assumed that there is no relationship between age group (20-54 versus 55-64) and gender. In other words, comparatively, there are no more employed women (or employed men) in the group of people aged 55-64 than in the group of people 20-54. Nevertheless, for unemployed people and people outside the labour force, in order to be confident at a level of 95 %, it is not possible to say that there is no relationship. It is then expected that gender may impact the possibility of being unemployed and outside the labour force. Detailed results are provided in the attached Excel file.
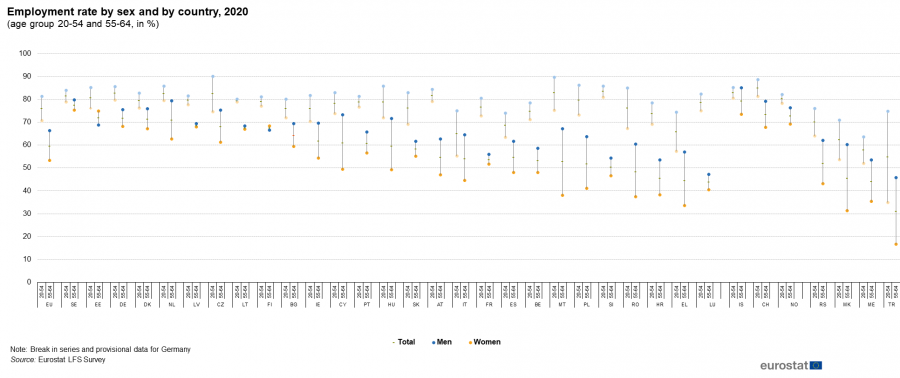
In all EU Member States in 2020, the employment rate for people aged 20-54 was larger than for people aged 54-64 (see Figure 2). Nevertheless, the generational gap varied a lot: from less than 10 p.p. in Estonia (8.8 p.p.), Denmark (8.2 p.p.) and Sweden (4.0 p.p.) to more than 30 p.p. in Malta (30.2 p.p.), Slovenia (33.1 p.p.) and Luxembourg (34.8 p.p.). In addition, the highest employment rates for people aged 55-64 were recorded in Sweden (77.6 %), Estonia (72.0 %) and Denmark (71.4 %). Germany, with 71.8 %, also had one of the largest employment rates for the age group 55-64 (however, the 2020 German data are still provisional). In contrast, Luxembourg registered the lowest employment rate in the EU for people in that age group, with 44.0 %. In Romania, Croatia and Greece, also less than 50 % of the total population aged 55-64 were employed. Higher employment rates were found for the age group 20-54 at both ends of the scale, ranging from 83.6 % in Slovenia, 83.1 % in Malta and 82.8 % in Germany to 68.9 % in Spain, 66.0 % in Greece and 65.2 % in Italy.
(age group 20-54 and 55-64, in %)
Source: Eurostat LFS survey
See Country codes
Another relevant finding is that the gender gap in employment appears to be larger among people aged 55-64 than among those aged 20-54. In the age group 20-54, a larger employment rate was recorded for men than for women in all Member States, and the gap reached 17.0 p.p. in Greece, 17.7 p.p. in Romania and 19.7 p.p. in Italy. In contrast, for the age group 55-64, while the male employment rate surpassed the female one in 25 out of the 27 EU Member States, the gap exceeded 20 p.p. in six Member States: Hungary (22.4 p.p.), Poland (22.6 p.p.), Romania (22.9 p.p.), Greece (23.4 p.p.), Cyprus (23.9 p.p.) and Malta (29.1 p.p.). Finland and Estonia were the only EU countries with a larger employment rate for women than for men in the age group 55-64 (gender gaps of 1.8 p.p. and 6.1 p.p. respectively for those two countries).
Focus on education
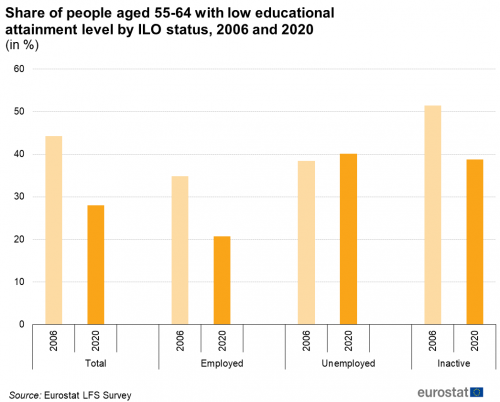
At EU level, the share of people with a low level of educational attainment among the employed population aged 55-64 decreased significantly from 2006 to 2020, from 34.9 % to 20.7 % (see Figure 3). The corresponding share among those outside the labour force was larger but it also experienced a significant decrease over the same period, i.e. from 51.5 % in 2006 to 38.7 % in 2020. The only group of people in terms of labour status, which saw an increase in the share of people with a low level of educational attainment, was that of unemployed people: among unemployed people aged 55-64, 38.4 % only attained a low education in 2006 against 40.1 % in 2020.
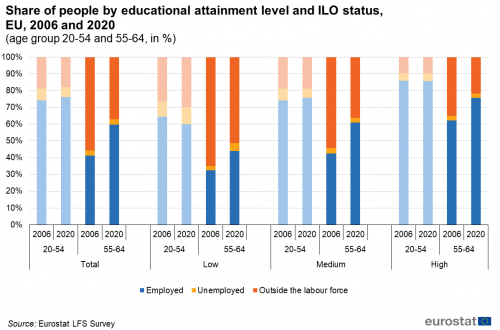
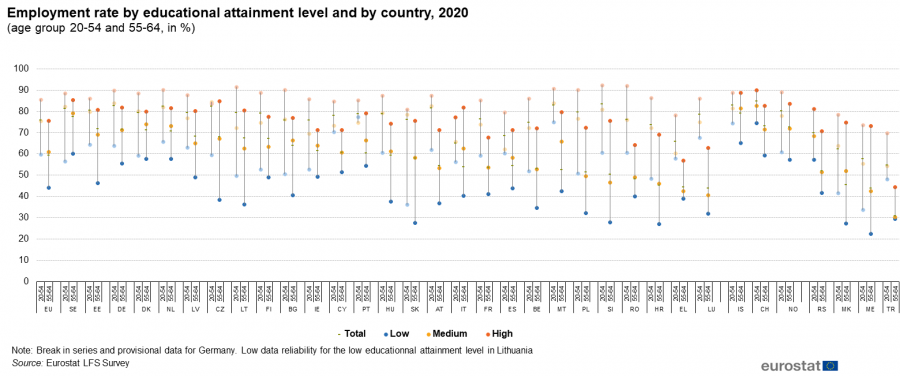
Figure 4 reveals that at EU level people aged 55-64 needed a higher level of education to reach a similar level of employability as those aged 20-54. In 2020, the employment rate for older people (aged 55-64) with a medium level of education was 60.9 %, similar to the rate for younger people (aged 20-54) with a low level of education, which was 59.9 %. Analogically, older people with a high level of education had a similar employment rate as young people with medium level of education (75.6 % compared with 75.7 %). Furthermore, considering the educational levels separately, younger people had a significantly higher employment rate than the older generation in all the three levels shown in Figure 4. To be precise, in 2020, the rate for people aged 20-54 was higher than the rate for those aged 55-64, with 15.8 p.p for a low level of educational attainment, 14.8 p.p. for a medium level and 10.1 p.p for a high level.
The development in the labour market situation from 2006 to 2020 for people with a low level of education had a different direction for the age groups 20-54 and 55-64, particularly as regards employment. The share of employed people among the population aged 20-54 with low education dropped during this period by 4.6 p.p., accompanied by a 1.4 p.p. and a 3.2 p.p. increase in the share of unemployed people and people outside the labour force respectively. At the same time, the employment rate for people aged 55-64 with a low level of education increased by 11.6 p.p. The share of unemployed people aged 55-64 with a low level of education also increased by 2.1 p.p., suggesting that more people in this sub-population were looking for a job and were available to work in 2020 compared with 2006. In addition, the share of people outside the labour force among people aged 55-64 with a low level of education contracted by 13.6 p.p.
Taking into account the different levels of education, the employment rate increased the most from 2006 to 2020 for those aged 55-64 with a medium level of education, by 18.5 p.p. The population aged 20-54 with a medium level of education also had an increase in the employment rate during this period. However, the size of the increase was significantly smaller, only by 1.5 p.p. Focusing on tertiary education graduates, i.e. those with a high level of education, older people benefited from an increase of 13.4 p.p. in the employment rate while the younger people aged 20-54 experienced a slight decrease of 0.1 p.p.
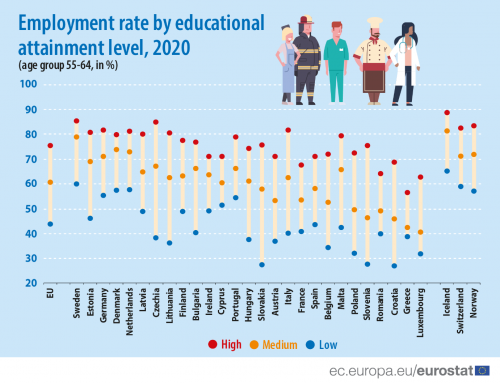
Education and age appear to play a huge role in the labour status, especially whether a person is employed or not, as the highest employment rates in the EU can be found for younger people (aged 20-54) with a high level of education, reaching 92.2 % in Slovenia, 91.9 % in Romania and 91.5 % in Lithuania. Malta, Bulgaria, Poland and the Netherlands, also had an employment rate for this sub-population exceeding 90 %. By contrast, the lowest employment rates can be observed for the population aged 55-64 with a low level of educational attainment. The bottom values for this sub-population were found in Slovenia (27.8 %), Slovakia (27.5 %) and Croatia (27.2 %)(see Figure 5).
In addition, positive assumptions of relationship between the level of education and the age group (20-54 versus 55-64) appear for each ILO status. This means that the level of educational attainment might have a different impact for younger and older people for employed people, unemployed people and people outside the labour force. The two age groups do not follow the same pattern, i.e. they do not have the same distribution as regards educational attainment level for each of the three ILO statuses. This is verified using Chi-square independence tests. They are statistically different in this aspect when a confidence threshold of 95 % is applied.
(age group 20-54 and 55-64, in %)
Source: Eurostat LFS survey
See Country codes
Focus on country of birth
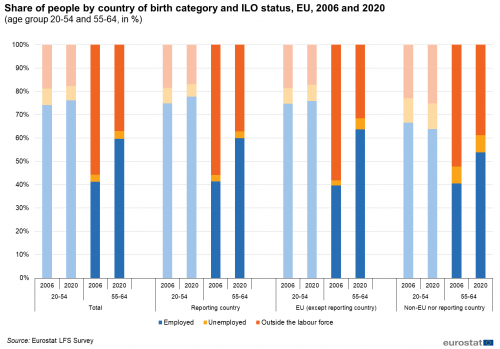
Starting with the development between 2006 and 2020, Figure 6 shows that the share of employed people aged 55-64 who were born in the reporting country increased by 18.6 p.p., reaching 60.0 % in 2020. This increase is nevertheless lower than for older workers who were born in another EU country, going up from 39.7 % in 2006 to 63.6 % in 2020 (+24.0 p.p. due to rounding). With respect to people aged 55-64 who were born outside the EU (neither in the reporting country nor in another EU Member State), the share of employed people also increased but to a lesser extent (+13.4 p.p.). In terms of comparison, the increase in the employment rate by country of birth for younger people (aged 20-54) was higher for those born in the reporting country than for those born in another EU Member State or outside the EU (+2.8 p.p. against +1.1 p.p. and -2.7 p.p. respectively).
As observed for the share of employed people aged 55-64, the share of unemployed people aged 55-64 increased more for people born in another EU Member State (+2.7 p.p.) than for people born in the reporting country (+0.2 p.p.) or outside the EU (+0.1 p.p.). Nevertheless, these increases are substantially smaller.
In 2020, the main differences among the two age groups, i.e. people aged 55-64 and people aged 20-54, are higher for people who were born in the reporting country (17.7 p.p.) than for people who were born in another EU Member State (12.2 p.p.) or in a country outside the EU (10.0 p.p.).
Furthermore, looking at the possible association (dependence) between the age (two groups) and the country of birth (three categories), the results of Chi-square tests show that the country of birth might affect both age groups differently, and there is a relationship between both variables. This has been positively tested for all three ILO statuses. Detailed results are included in the attached Excel file.
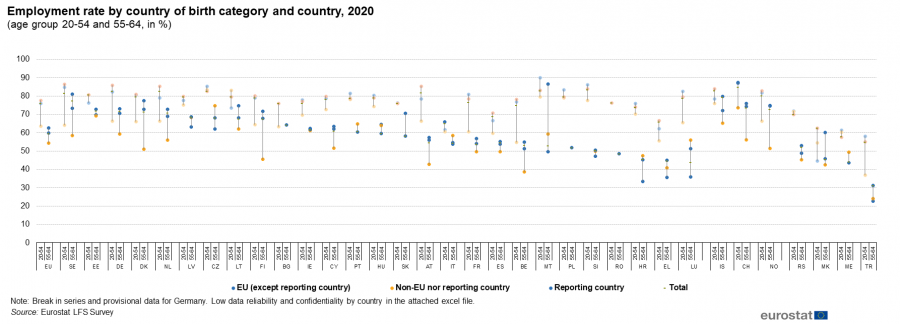
Even if at EU level the employment rate of people aged 55-64 who were born in another EU Member State is higher than the employment rate of those born in the reporting country, this situation is observed in less than half of the EU Member States. In most countries, the employment rate of people born in the reporting country is higher.
The main differences between the two age groups as regards the country of birth are shown by country of residence in Figure 7. The largest differences for people born in the reporting country are reported for Luxembourg where the employment rate of younger people is 43.7 p.p. above the one reported for people aged 55-64, followed by Malta and Slovenia (with 33.5 p.p. of difference in both countries between the two age groups). Among people born in another EU Member State, the largest differences between both age groups are reported by Croatia, Slovenia and Luxembourg with an employment gap of more than 30 p.p. As regards the employment rate of people born outside the EU, the largest differences between both age groups are not so significant. However, Slovenia reported an employment gap between younger and older people amounting to 27.8 p.p. In addition, Austria, Lithuania, Cyprus, Croatia and Malta reported a gap between the employment rate of those two age groups of between 20 p.p. and 24 p.p.
(age group 20-54 and 55-64, in %)
Source: Eurostat LFS survey
See Country codes
Focus on occupation
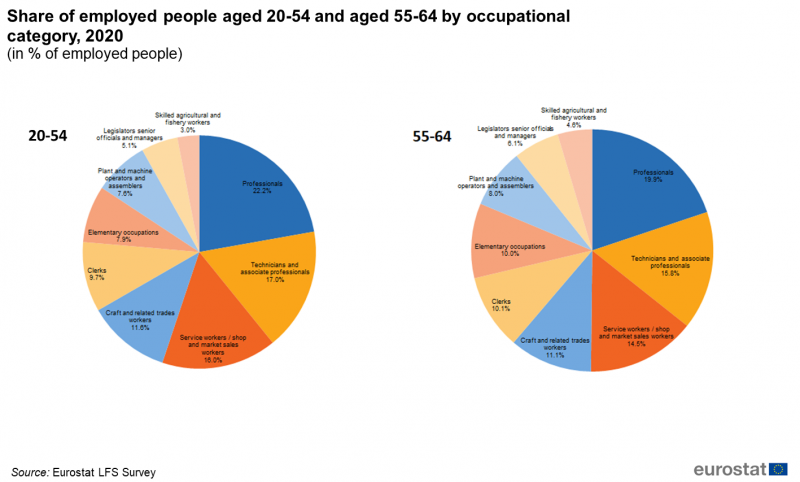
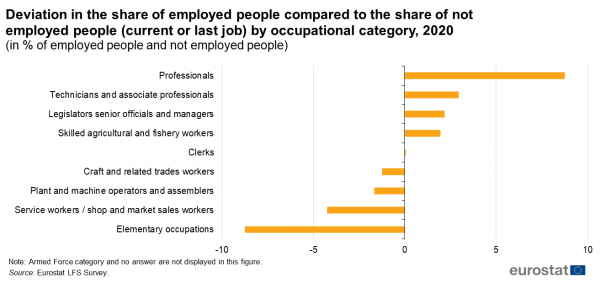
Looking at the distribution of employed people aged 55-64 by occupation (see Figure 8), almost one in five employed persons aged 55-64 was part of the group of "professionals" in 2020 (19.9 %). This group encompasses people working as professionals in various domains: science and engineering, health, teaching, business and administration, information and communications technology and finally, in legal, social and cultural fields, and generally with a high skill level (for further information see the ISCO-08 structure). The group of "technicians and associate professionals" amounted to 15.8 % of workers of this age group. Finally, the "service workers and shop and market sales workers" make up the top 3 occupations of people aged 55-64, gathering 14.5 % of older workers in 2020.
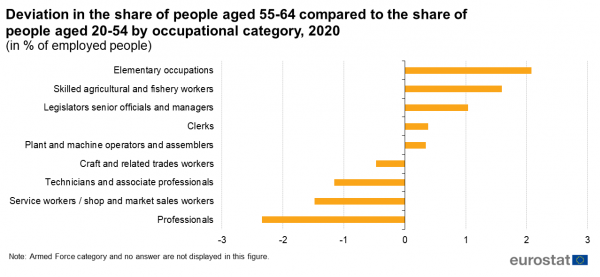
In order to compare the distribution of older and younger workers by occupation, Figure 9 displays the differences between the shares of employed people aged 55-64 across occupational categories and those for people aged 20 to 54 at EU level. Chi-square independence test shows that the null hypothesis, that there is no link between the occupational category and the age group (55-64 versus 20-54), can be rejected. This means that it is very likely that people aged 55-64 do not follow the same distribution across occupation as people aged 20-64. Based on Figure 9, the share of workers with "elementary occupations" was larger for older people than for younger ones in 2020 (10.0 % against 7.9 %). Also, "skilled agricultural and fishery workers" were more represented among the older workers than among the younger ones (4.6 % of people aged 55-64 were in this occupation group against 3.0 % of people aged 20-54). The share of "legislators senior officials and managers" was also a bit higher for older than younger workers. In contrast, the "professionals", "technicians and associate professionals" and "service workers and shop and market sales workers" were more prominently represented among people aged 20-54 than among people aged 55-64.
Determinants for the labour status
In order to complement the descriptive analysis and the Chi-square independence tests presented above, some logistic regression models were tested for people aged 55-64, using their socio-demographic and socioeconomic determinants as independent variables and their ILO labour status as dependent variable. This exercise aimed to determine whether the association between the response (being employed or not) and each term in the model (socio-demographic and socioeconomic characteristics) was statistically significant. The null hypothesis was that the term's coefficient was equal to zero, indicating that there is no association between the term and the response. A significance level of 0.05 (corresponding to a 5 % risk of concluding that an association exists when there is no actual association) was used.
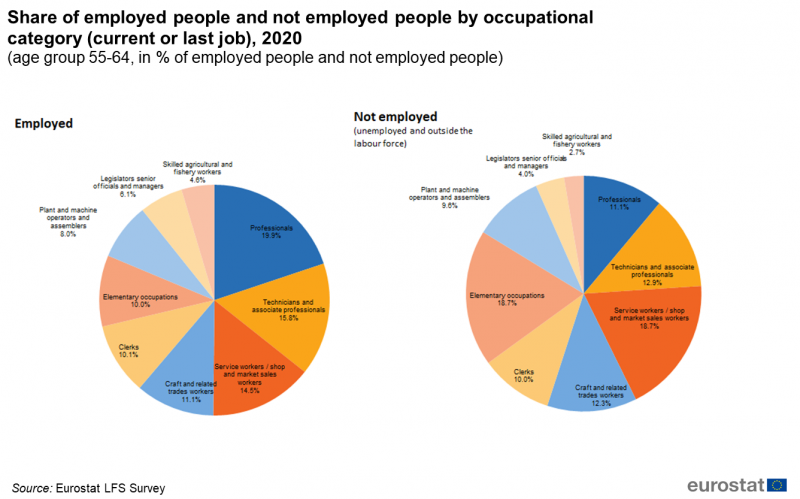
For the socioeconomic characteristics, such as the occupation, those of the last job were considered for the not employed people (i.e. unemployed people and people outside the labour force) while those of the current job were taken for employed people.
Figure 10 compares the distribution by occupation between employed and not employed persons. Differences can be observed between the two groups, such as a higher share of "professionals" (19.9 % versus 11.1 %), "technicians and associate professionals" (15.8 % versus 12.9 %) and "legislators senior officials and managers" (6.1 % versus 4.0 %) among the employed people. In contrast, the share of "elementary occupations" (10.0 % versus 18.7 %) and of "service workers and shop and market sales workers" (14.5 % versus 18.7 %) are smaller among the employed people than among the not employed people.
The exercise with the logistic regression models confirms the results previously obtained and presented. Indeed, it shows that there is a statistically significant association between the response (being employed or not) and the educational attainment level, the country of birth and the combination of gender and occupation. This means that, for people aged 55-64, the fact of being employed or not is significantly determined by their educational attainment level, their country of birth, their gender and their (current or last) occupation, while their occupation and gender are inter-related.
Source data for tables and graphs
Data sources
Source: The European Union Labour Force Survey (EU-LFS) is the largest European household sample survey providing quarterly and annual results on labour participation of people aged 15 and over as well as on persons outside the labour force. It covers residents in private households. Conscripts in military or community service are not included in the results. The EU-LFS is based on the same target populations and uses the same definitions in all countries, which means that the results are comparable between the countries. The EU-LFS is an important source of information about the situation and trends in the national and EU labour markets. Each quarter around 1.8 million interviews are conducted throughout the participating countries to obtain statistical information for some 100 variables. Due to the diversity of information and the large sample size, the EU-LFS is also an important source for other European statistics like Education statistics or Regional statistics.
Reference period: Yearly results are obtained as averages of the four quarters in the year.
Coverage: The results from the survey currently cover all European Union Member States, the EFTA Member States Iceland, Norway and Switzerland, as well as the candidate countries Montenegro, North Macedonia, Serbia and Turkey. For Cyprus, the survey covers only the areas of Cyprus controlled by the Government of the Republic of Cyprus.
European aggregates: EU and EU-27 refer to the totality of the EU of 27 Member States. If data are unavailable for a country, the calculation of the corresponding aggregates takes into account the data for the same country for the most recent period available. Such cases are indicated.
Country note: In Germany, since the first quarter of 2020, the Labour Force Survey (LFS) has been integrated into the newly designed German microcensus as a subsample. Unfortunately, for the LFS, technical issues and the COVID-19 crisis has had a large impact on the data collection processes, resulting in low response rates and a biased sample. Changes in the survey methodology also led to a break in the data series. The published German data are preliminary and may be revised in the future. For more information, see here.
Definitions: The concepts and definitions used in the EU-LFS follow the guidelines of the International Labour Organisation.
Employment covers persons aged 15 years and over (16 and over in Spain and Italy, 15-74 years in Estonia, Latvia, Hungary, Finland, Sweden, Norway and Denmark, and 16-74 years in Iceland), living in private households, who during the reference week performed work, even for just one hour, for pay, profit or family gain, or were not at work but had a job or business from which they were temporarily absent, for example because of illness, holidays, industrial dispute or education and training.
The LFS employment concept differs from national accounts domestic employment, as the latter sets no limit on age or type of household, and also includes the non-resident population contributing to GDP and conscripts in military or community service.
The level of education refers to the educational attainment level, i.e. the highest level of education successfully completed. Low level of education refers to ISCED levels 0-2 (less than primary, primary and lower secondary education), medium level refers to ISCD levels 3 and 4 (upper secondary and post-secondary non-tertiary education) and high level of education refers to ISCED levels 5-8 (tertiary education).
Different articles on detailed technical and methodological information are available through: EU labour force survey.
Context
Employment statistics are at the heart of many EU policies. The European employment strategy (EES) was launched at the Luxembourg jobs summit in November 1997 and was revamped in 2005 to align the EU’s employment strategy more closely to a set of revised Lisbon objectives, and in July 2008, employment policy guidelines for the period 2008–2010 were updated. In March 2010, the European Commission launched the Europe 2020 strategy for smart, sustainable and inclusive growth; this was formally adopted by the European Council in June 2010. The European Council agreed on five headline targets, the first being to raise the employment rate for women and men aged 20 to 64 years old to 75 % by 2020. EU Member States may set their own national targets in the light of these headline targets and draw up national reform programmes that include the actions they aim to undertake in order to implement the strategy.
The European Pillar of Social Rights has been jointly signed by the European Parliament, the Council and the Commission on 17 November 2017. Employment and social policies are the main fields of interest of the European Pillar of Social Rights, which is about delivering new and more effective rights for citizens. It has 3 main categories: (1) Equal opportunities and access to the labour market, (2) Dynamic labour markets and fair working conditions and (3) Social protection and inclusion. Building a fairer Europe and strengthening its social dimension is a key priority for the Commission. The European Pillar of Social Rights is accompanied by a ‘social scoreboard’ which will monitor the implementation of the Pillar by tracking trends and performances across EU countries in 12 areas and will feed into the European Semester of economic policy coordination. The scoreboard will also serve to assess progress towards a social ‘triple A’ for the EU as a whole.
In the Porto Social Commitment of 7 May 2021, the European Parliament, the Council of the EU, the European social partners and civil society organisations discussed the implementation of the European pillar of social rights at EU and national level, as established by the EU strategic agenda 2019-2024. The action plan presented by the Commission in March 2021 provides guidance on the implementation of the European pillar of social rights, including in the areas of employment, skills and social protection. The action plan sets three main targets to be achieved throughout the European Union by 2030:
- At least 78% of people aged 20 to 64 should be in employment,
- At least 60% of all adults should participate in training every year,
- The number of people at risk of poverty or social exclusion should be reduced by at least 15 million, including at least 5 million children.
Partners have signed up to the three 2030 headline targets set in the Commission’s European Pillar of Social Rights Action Plan in a joint Porto Social Commitment. For more information, see here.
Direct access to
- All articles on employment
- Employment - quarterly statistics
- Employment in detail - quarterly statistics
- Labour market slack - unmet need for employment - quarterly statistics
- Labour market slack – annual statistics on unmet needs for employment
- Unemployment statistics and beyond
- People outside the labour force
- Job vacancy statistics
- Labour market statistics at regional level
- The EU in the world — labour market
- Labour market in the light of the COVID 19 pandemic — online publication
- EU labour force survey — online publication
- Labour force survey in the EU, EFTA, United Kingdom and candidate countries — Main characteristics of national surveys, 2019, 2021 edition
- Quality report of the European Union Labour Force Survey 2019, 2021 edition
- LFS main indicators (t_lfsi)
- Population, activity and inactivity - LFS adjusted series (t_lfsi_act)
- Employment - LFS adjusted series (t_lfsi_emp)
- Unemployment - LFS adjusted series (t_une)
- LFS series - Detailed annual survey results (t_lfsa)
- LFS series - Specific topics (t_lfst)
- LFS main indicators (lfsi)
- Employment and activity - LFS adjusted series (lfsi_emp)
- Unemployment - LFS adjusted series (une)
- Labour market transitions - LFS longitudinal data (lfsi_long)
- LFS series - Detailed quarterly survey results (from 1998 onwards) (lfsq)
- LFS series - Detailed annual survey results (lfsa)
- LFS series - Specific topics (lfst)
- LFS ad-hoc modules (lfso)
Publications
- EU labour force survey — online publication
- Labour force survey in the EU, EFTA, United Kingdom and candidate countries — Main characteristics of national surveys, 2019, 2021 edition
- Quality report of the European Union Labour Force Survey 2019, 2021 edition
ESMS metadata files and EU-LFS methodology
- Employment and unemployment (Labour Force Survey) (ESMS metadata file — employ_esms)
- LFS main indicators (ESMS metadata file — lfsi_esms)
- LFS series - detailed annual survey results (ESMS metadata file — lfsa_esms)
