Archive:Impact of coastal maritime activities on the hinterland
This Statistics Explained article is outdated and has been archived - for recent articles on Coastal regions see here.
- Data from March 2011. Most recent data: Further Eurostat information, Main tables and Database.
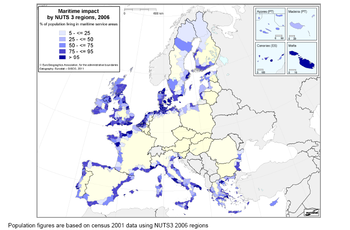
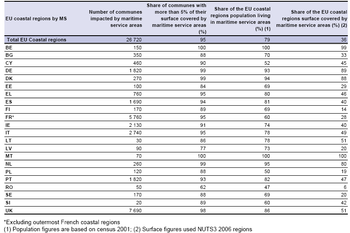
Maritime service (impact) areas account for 79 % of the population of the European Union (EU) coastal regions (NUTS) and cover 36 % of their surface area. However, the share of the EU regional population living in maritime service areas is highly dispersed.
The aim of this spatial analysis is to map the maritime service areas and to provide related sets of socio-economic data referring to surface area and population. This article presents the method and data used during the study and the first outputs. The outputs of this analysis will be used as part of the EU Integrated Maritime Policy to define a socio-economic profile of the EU coastal regions and to highlight the inland impact of maritime activities on different geographic scales.
Main statistical findings
Impact of maritime service areas on EU coastal regions
Basically, maritime service areas reflect the attractiveness and inland influence of the maritime activities located along the European coast. They affect more than 26 700 local administrative units (LAU2) in EU coastal regions, account for 79 % of their population and cover 36 % of the surface area of these regions, as shown in Table 1. The specific shapes of these areas especially bring out the type of impact of maritime activities within or beyond EU coastal regions. In particular, the outlines of the shapes can be highlighted and disseminated[1] using geographical information system (GIS) tools. Moreover, the structural variables such as the number of LAUs affected and the percentage of the population or surface area covered by maritime service areas in EU coastal regions reflect the scale of this impact.
Furthermore, these background and structural data can then be introduced into classification or multifactorial analyses, in order to assess more accurately variables such as employment and value added generated by maritime activities in EU coastal regions on different geographic scales. The outputs can be used to study the scope of the EU Integrated Maritime Policy.
Calculating the maritime service areas
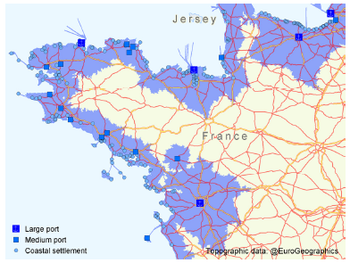
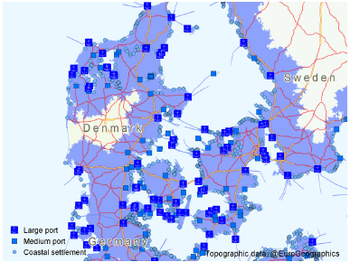
The analysis started by calculating and delineating the maritime service areas. The study applied spatial analysis tools using both geographical datasets and statistical information. The actual inputs for the spatial analysis consisted of specific points along the coastline, the design and characteristics of the transport network, commuting time and a classification of maritime ports. These inputs were considered for the EU as a whole. The maritime service areas are the areas that can be reached within a given travelling time, starting from a location at the coast and using the existing transport network. Map 2 shows one case: the maritime service areas calculated and outlined along the coastline of North-West France.
From a geographical perspective, the maritime activities and interactions between the sea and coastal regions are linked to points on the coast. These are referred to as ‘focal points’ and can take the form either of single points (e.g. ports) or of a sequence of points (e.g. sea resorts and coastal strip settlements). The analysis uses more than ten thousand focal points, including one thousand ports ranked by size and all the settlements located within one kilometre of the EU-27 coast.
The commuting time reflects the attractiveness and impact of the focal points. A longer commuting time was applied for larger ports, assuming greater attractiveness and impact. Two travel time values were used, one for large ports and another for smaller ports and coastal settlements. The commuting times were taken from the EU Working conditions survey.
Moreover, the road transport network and its characteristics take accessibility and topography into account.
Impact of maritime service areas in a specific surface area
The output of the spatial analysis can be used in two approaches, which cover several fields.
The first approach can be used for studying the impact or attractiveness of the surrounding ports and coastal settlements within a specific surface area, such as an LAU, a region, a country or another geographical level. As Map 2 shows, the first field of the output contains the shapes of maritime service areas. The delineation of the shapes may be used independently and take account of the administrative boundaries.
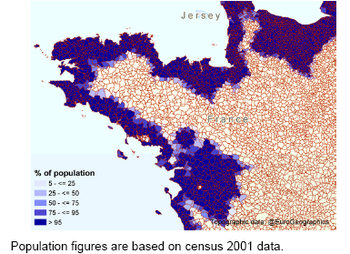
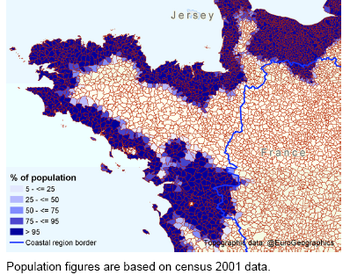
The second field of output is the structural indicator of population estimated for the territorial classification. First, the share of the population of each LAU living in the service areas was assumed to be equal to the percentage of the surface area of the LAU covered by the maritime service areas.
Based on this assumption, Map 3 shows both the percentages of the population and the area of the LAU that lie within the maritime service areas.
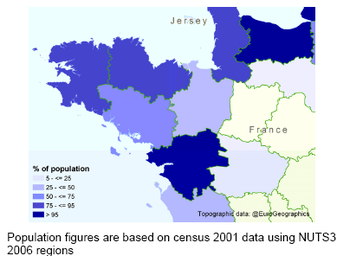
The next step compared the population living in the maritime service areas with the regional population (NUTS3). As Map 4 shows, more than 90 % of the population of the French coastal region of Finistère live in maritime service areas. Using the same method, the indicator can also be estimated for the set of EU coastal regions by country, as in Table 1, or at different levels of the territorial classification (NUTS).
The output of the analysis can be used to compare the delineation of the maritime service areas, the share of the population affected and the regional boundaries. As Map 5 shows, most of the population of the French region of Loire-Atlantique live in maritime service areas and the maritime service areas extend beyond that region. This is mainly due to the attractiveness of Nantes-Saint-Nazaire and the good transport network. However, in the adjacent French region of Morbihan the maritime service areas and the population affected extend along the coastline.
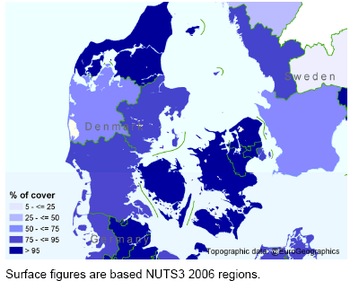
Lastly, the third field of output is the structural indicator of surface area. These indicators can be used independently to delineate the shape of the administrative boundaries. As Map 6 shows, in Denmark maritime service areas cover almost the entire country. However, some areas are still not covered and the image clearly shows that the maritime service areas are not entirely dependent on their proximity to the sea. At regional level, Map 7 shows that 68 % of the region of Vestjylland is covered by maritime service areas and as much as 98 % of the region of Østjylland.
Maritime service areas of a specific port
This second approach can be used to study the impact of a single port or of a single interaction point on the surrounding areas. This dual approach also provides information on three fields: shape delineation and the two structural indicators of population by administrative units and surface area.
Among other things, the analysis provides information on the service areas of the individual EU27 maritime transport ports. Maritime ports, in particular ports for maritime transport, play a vital role in maritime impact. Ports are intrinsic part of the maritime and most maritime industries are concentrated in their vicinity. They also contribute to the economy of coastal regions and participate in maritime trade.
In order to estimate the influence of individual maritime ports, the spatial analysis provides data on the service areas of all ports covered by the study.
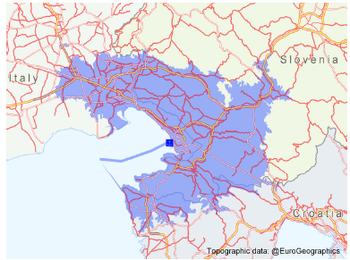
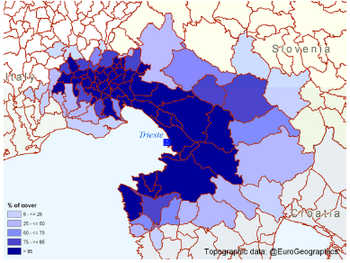
As Maps 8 and 9 show, the maritime service area of the Italian port of Trieste is relatively large. Its surface area is approximately 3 000 km² and encompasses 77 LAUs in the EU, including 17 beyond the national border. The maritime service area of the port of Trieste could be used to estimate the impact on the population and the surface area coverage extending beyond Italy’s national boundaries on several administrative levels and geographical scales.
This output will be used to analyse the ports and, in particular, to determine, outline and evaluate the employment areas and their attractiveness.
Maritime service areas are linked to the importance of maritime ports
The importance of the maritime ports dataset lies, in particular, in the port classification. The classification is based on characteristics such as traffic type and traffic intensity, i.e. the gross weight of goods handled and number of passengers who embarked or disembarked in the ports.
Following analysis of these characteristics, for the purposes of this study the ports were grouped into two categories: large ports and smaller ports. It was assumed that the large ports in this classification would be more attractive and have a greater inland impact than the smaller ports.
Using commuting time and the road transport network
The travel time and transport network determine the lengths of the journeys that delineate the shape and extent of the service areas. For the purposes of this analysis, the commuting time and road transport network are assumed to determine the extent of spatial distribution of the population and the areas involved in and affected by maritime activities. Both these factors have a strong impact on employment patterns and the attractiveness and shape of service areas. Given that the ultimate aim of the analysis is to evaluate the socio-economic impact of the maritime activities, the travel time values used are based on commuting time data and road transport network characteristics.
The Fourth Survey of Working Conditions (in 2007) provides the commuting time data for EU27. According to the results of this survey, workers in EU27 spend an average of 42 minutes every day travelling to and from work, which equals 21 minutes each way. The results show greater variability within countries (e.g. 85 % in Bulgaria) than between countries (around 10 %). According to this survey and other sources, the commuting time depends mainly on the size and attractiveness of the city and on the level of urbanisation at the start and end points of the journey. The variability of commuting time is also due to the shape and characteristics of road transport, such as size and speed limits. The Tele Atlas MultiNet10 provides information on the shape of the transport network and characteristics such as speed limits.
Consequently, different commuting times are applied, depending on the port’s size, and local variability is assessed on the basis of the transport network.
Two values are used for the travel time derived from the EU27 commuting time data, depending on the size of the port, i.e. 45 minutes for large ports and 20 minutes for smaller ports and coastal settlements. The purpose of the study is to provide the information in the most harmonised way across EU27. These two values are therefore used uniformly to calculate all service areas. However, the local characteristics were also taken into account by considering the transport network.
Data sources and availability
The download procedure to access geographical information will be explained through the GISCO portal
The file of the shapes of maritime service areas can be extracted from the service areas zip file.
See also
- Maritime ports freight and passenger statistics
- Maritime transport statistics - short sea shipping of goods
Further Eurostat information
Publications
- Maritime service areas - Statistics in focus 41/2011
Dedicated section
External links
Notes
- ↑ Access to geographical information: the download procedure will be explained through the GISCO portal; the file of the shapes of maritime service areas is available from Eurostat's website.
