This Statistics Explained article is outdated and has been archived - for recent articles on structural business statistics see here.
65 % of internet users in the EU shopped online in 2015
Author: Petronela REINECKE
- Data extracted in December 2015. Most recent data: Further Eurostat information, Main tables and Database. Planned update of the article: December 2016.
This article takes a closer look at individuals’ internet use and electronic commerce (e-commerce or e-shopping) statistics in the European Union. It is based on the results of the 2015 Survey on ICT (information and communication technology) usage in households and by individuals.
Main statistical findings
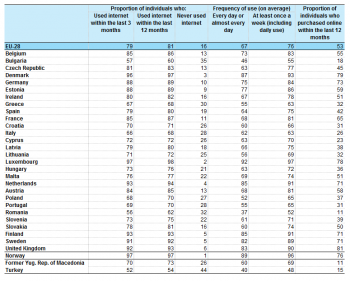
67 % of individuals aged 16-74 in the EU used the internet on average daily or almost daily in 2015, with the highest proportions to be found in Luxembourg (92 %), Denmark (87 %), the Netherlands and Finland (both 85 %). However, 16 % of the EU population has never used the internet.
Nearly two thirds of internet users in the 12 months prior to the survey (hereafter referred as "internet users") made online purchases in the same period. Overall, the share of e-shoppers in internet users is growing, with the highest proportions being found in the 16-24 and 25-54 age groups (68 % in each case).
The proportion of e-shoppers varied considerably across Member States, ranging from 18 % of internet users in Romania to 87 % in the United Kingdom.
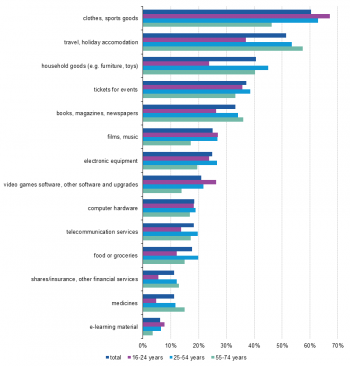
The most popular type of goods and services purchased online in the EU was clothes and sport goods (60 % of e-buyers), followed by travel and holiday accommodation (52 %). E-shoppers aged 16-24 were the top age group when it came to clothes and sports goods purchases (67 %), those aged 25-54 in buying household goods (45 %) and the older age group (55-74) in online purchases of travel and holiday accommodation (57 %).
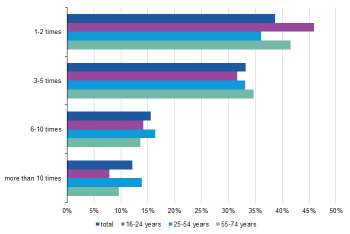
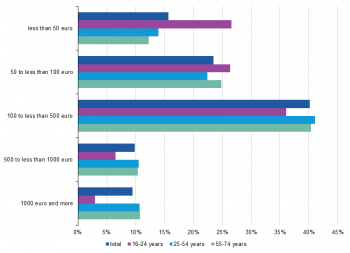
In terms of frequency, the highest proportion of e-shoppers made purchases in the three months prior to the survey only once or twice (39 %). In terms of amount spent, the highest proportion of e-buyers (40 %) bought goods or services for a total of €100-499.
30 % of e-buyers purchased from other EU Member States, compared with 25 % in 2012.
Nearly eight in ten EU citizens used the internet in the previous three months and two thirds went online on a daily basis
In the EU, almost eight in ten individuals aged 16-74 (79 %) used the internet at least once in the three months prior to the survey (Table 1). Over three quarters (76 %) used it on average at least once a week at home, at work or elsewhere; this is one percentage point above the Digital Agenda target of 75 % of the population by 2015.
Just over two thirds of EU citizens (67 %) used the internet every day or almost every day. Nevertheless, the ‘digital divide’ between countries remains significant: over 80 % of individuals used the internet every day or almost every day in Luxembourg, Denmark, the Netherlands, Finland, the United Kingdom and Sweden, but far fewer in Romania (37 %) and Bulgaria (46 %).
The Digital Agenda has as a target to halve the proportion of the EU population aged 16-74 that has never used the internet from 30 % in 2009 to 15 % in 2015. This figure stood at 16 % in 2015, which is close but still one percentage point above the target. The proportions of the population with no experience of internet use (whether at home, at work or elsewhere) were highest in Bulgaria (35 %), Romania (32 %) and Greece (30 %), and lowest in Luxembourg (2 %), Denmark (3 %), the Netherlands (4 %), Finland and Sweden (both 5 %) and the United Kingdom (6 %).
Proportion of e-shoppers growing steadily, with the biggest increase among young people
Buying over the internet has become very popular in the EU. The proportion of individuals aged 16-74 having purchased online in the 12 months prior to the survey stood at 53 % in 2015 (Table 1). This means that the Digital Agenda target of 50 % of the population to buy online by 2015 has been exceeded by three percentage points. Consumers appreciate the convenience of being able to shop anytime anywhere, having access to a broader range of products, comparing prices and sharing their opinion on goods with other consumers.
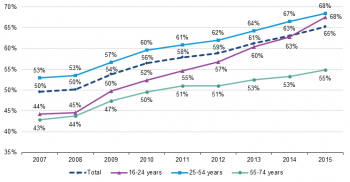
81 % of individuals aged 16 to 74 in the EU had used the internet in the 12 months prior to the survey, of whom 65 % had bought or ordered goods or services for private use. This is an increase of 15 percentage points from 2007 (Figure 1).
Those aged 25-54 had the highest share of online shoppers among internet users in 2007-2014, but in 2015 the youngest age group (16-24) overtook the EU average level to share top e-shopper status with 25-54 year olds. E-commerce picked up over the 2007-2015 period among all age groups, with individuals aged 16-24 showing the biggest increase (24 percentage points).
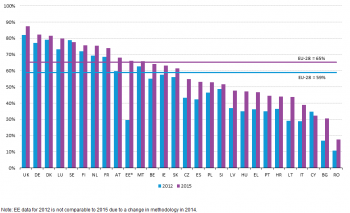
Over eight in ten internet users in the United Kingdom (87 %), Germany and Denmark (both 82 %) had bought or ordered goods or services over the internet in the previous 12 months. On the other hand, fewer than 40 % had shopped online in Romania (18 %), Bulgaria (31 %), Cyprus (32 %) and Italy (39 %). The largest (more than 10 percentage points) increases between 2012 and 2015 were recorded in Lithuania, Bulgaria, the Czech Republic, Hungary, Spain and Latvia (Figure 2).
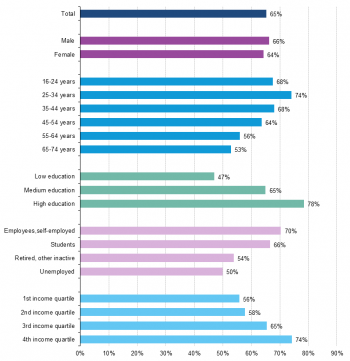
Gender, age, level of education, employment situation and income all affect e-commerce activity (Figure 3). For men, the share of online shoppers among internet users was slightly higher than for women (66 % and 64 %, respectively), while internet users aged 25-34 are more active e-shoppers (74 %) than those in the other age groups. Among the internet users with higher level of education, nearly eight in 10 bought goods or services online. Employees and self-employed internet users are more likely to buy or order goods or services over the internet (70 %) than unemployed internet users (50 %). Also, the proportion of internet users shopping online increases in line with income: nearly three quarters of internet users living in households in the highest income category (i.e. the fourth quartile) bought goods or services online in the previous 12 months.
Clothes and sports goods predominate in online purchases
Figure 4 shows that most purchases, by a third or more of e-shoppers, involved clothes and sports goods (60 %), travel and holiday accommodation (52 %), household goods (41 %), tickets for events (37 %) and books, magazines and newspapers (33 %). Fewer than one in five e-shoppers bought computer hardware, telecommunication services and food or groceries (all 18 %), shares/insurance, other financial services and medicines (11 %) and e-learning materials (6 %).
The 16-24 age-group had the highest proportions of e-shoppers purchasing clothes and sport goods (67 %), video games software, other software and upgrades (26 %) and e-learning material (8 %). People aged 25-54 had the highest proportion of internet users buying household goods (45 %), tickets for events (39 %), electronic equipment (27 %), telecommunication services and food or groceries (20 % each). The older (55-74) age group took the lead in buying travel and holiday accommodation (57 %), books, magazines and newspapers (36 %), medicines (15 %) and shares/insurance and other financial services (13 %).
Almost four in ten e-shoppers had in the previous three months bought goods or services for private use once or twice and a third had done so three to five times. The proportion of e-shoppers who had made online purchases over 10 times was lowest, at 12 % (Figure 5).
The largest proportion of people buying online once or twice is found among those aged 16-24 (46 % of e-shoppers), followed by individuals aged 55-74 (42 %). People aged 25-54 stand out as making more frequent purchases: 16 % of e-shoppers in this age group bought online 6-10 times in the three months prior to the survey and 14 % did so even more often.
Four in ten e-shoppers said they had spent EUR 100-499 for their online purchases in the three months prior to the survey. Individuals aged 16-24 led in online purchases worth less than EUR 100 and those aged 25-54 for purchases of EUR 100-499. Purchases worth over EUR 500 were less popular with all age groups (Figure 6).
70 % of e-buyers reported to have no problem when purchasing online
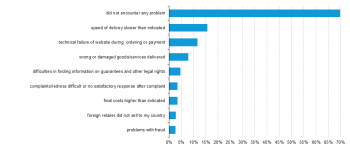
Seven e-buyers out of ten reported that they did not encounter any problem when buying or ordering goods or services in the previous 12 months. The problems encountered most often by EU online shoppers were related to slower delivery than had been indicated at the time of making the purchase (16 %). Some 12 % had problems in the form of technical failure of a website while ordering or paying, 8 % had received wrong or damaged goods/services, almost 5 % had difficulties in finding information on guarantees and other legal rights, 4 % found it difficult to make complaints or seek redress, or did not receive a satisfactory response to a complaint. About 3 % of online shoppers in each case were confronted with final costs higher than indicated (e.g. higher delivery costs), foreign retailers not selling to customers in their country and problems with fraud (e.g. no goods/services received at all, misuse of credit card details) - Figure 7.
Three quarters of people not buying online prefer to shop in person
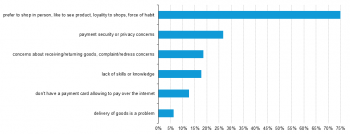
The main reason given for not making purchases online in the previous 12 months (Figure 8) was a preference for shopping in person, in order to be able to see the products before purchasing them, out of loyalty to shops or by force of habit (75 %). Other, much less important factors were worries as to privacy or security when paying online (27 %), concerns about receiving or returning goods (19 %), individuals believing that they lacked the necessary skills or knowledge to make online purchases (18 %) and not having a suitable payment card (13 %). Very few of those who had not made online purchases considered that the delivery of goods would be a problem (6 %).
30 % of online shoppers bought or ordered goods or services from sellers in other EU countries
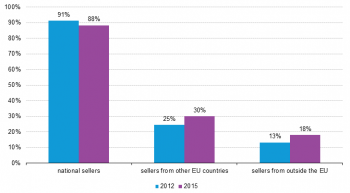
Cross-border online purchases can be an indicator of the smooth functioning of the single market for e-commerce and the extent to which consumers make use of wider choices and lower prices. A large majority of e-shoppers in the 12 months prior to the survey made online purchases from sellers in their own country: 88 %, i.e. down by 3 percentage points from 2012 (Figure 9). A rising trend is observed for purchases from sellers in other Member States (from 25 % in 2012 to 30 % in 2015) and from sellers outside the EU (from 13 % in 2012 to 18 % in 2015).
Data sources and availability
The data in this article are based on the results of annual surveys on ICT usage in households and by individuals. Data for 2015 were aggregated from micro data transmitted by all Member States and some non EU countries (Norway, the former Yugoslav Republic of Macedonia and Turkey). They are available on the Eurostat website (see link below). Researchers can apply for access to the micro data.
The 2015 survey results are based on responses from a total of 151 685 households containing at least one person aged 16-74, and 202 185 individuals aged 16-74 across the EU. Individuals were asked about the last time they used the internet, how often they used it, use away from home or usual place of work, activities relating to e-government and e-commerce, and e-skills.
Most countries collected data in the second quarter of 2015. The reference period for the questions on frequency of online shopping and amounts spent was the three months prior to the survey. For data relating to the other e-commerce activities, the reference period was the 12 months prior to the survey, as such activities tend to be irregular and seasonal.
The ‘digital divide’ refers to divergence in patterns of internet use across countries and between groups of individuals.
Levels of education are defined according to ISCED-2011 as follows: high (tertiary, ISCED 5, 6, 7 or 8); medium (upper secondary and post-secondary non-tertiary, ISCED 3 or 4); low (at most lower secondary, ISCED 0, 1 or 2).
For the purposes of the survey, ‘income’ is the net monthly income of the household (not the individual). The focus is on household income, as an individual’s access to and use of ICTs is determined more by the total income of the household of which he/she is part than by his/her personal income. Income levels are represented by quartiles; quartile 1 represents the 25 % lowest incomes observed and quartile 4 the 25 % highest.
Context
The findings of this survey are used for monitoring several EU policies, in particular the Digital Agenda for Europe, which is one of the pillars of the Europe 2020 strategy (which sets objectives for the growth of the European Union by 2020). The Digital Agenda proposes to better exploit the potential of Information and Communication Technologies (ICTs) in order to foster innovation, economic growth and progress. One of its main objectives is the completion of the Digital Single Market, in which the free movement of persons, services and capital is ensured and where the individuals and businesses can seamlessly access and exercise online activities under conditions of fair competition, and a high level of consumer and personal data protection, irrespective of their nationality or place of residence. The completion of the Digital Single Market is currently one of the political priorities of the European Commission.
The Digital Agenda includes a number of targets for internet use and take-up of services. Annual Digital Agenda Scoreboard reports monitor the Europe's digital performance and progress towards these targets on the basis of the indicators specified in the 2011-2015 Benchmarking Digital Europe Framework.
The findings of this survey are also used in the Consumer Conditions Scoreboard (purchases over the Internet) in the framework of EU consumer policy.
See also
Further Eurostat information
Data visualisation
- Regional Statistics Illustrated - select statistical domain 'xxx' (= Agriculture, Economy, Education, Health, Information society, Labour market, Population, Science and technology, Tourism or Transport) (top right)
