Agri-environmental indicator - specialisation
Data from March 2022.
Planned update: April 2026.
Highlights
Against a background of falling farm numbers in the EU, the share of remaining farms that are specialised in crops has increased sharply, principally at the expense of mixed farms.
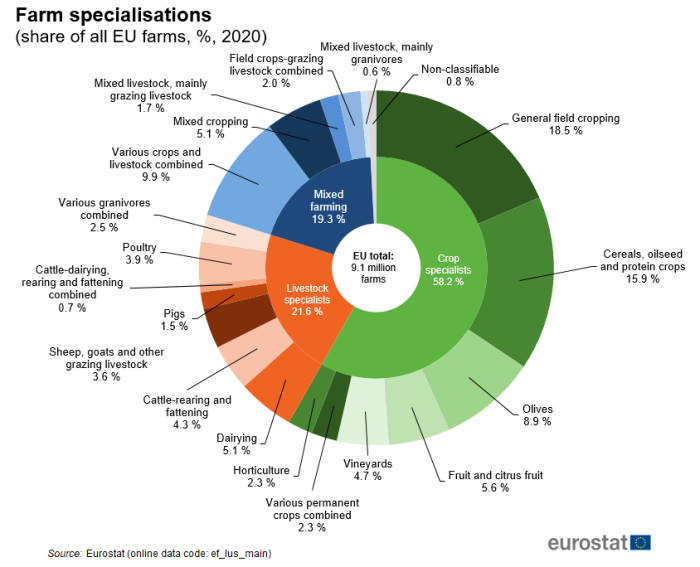
Almost three-fifths of EU farms in 2020 were specialised in crop production, one-fifth were specialised in livestock production and about one-fifth were mixed farms.
The average size of almost all types of farms increased between 2005 and 2020 as farms merged or were taken over.
This article provides a fact sheet of the European Union (EU) agri-environmental indicator specialisation. It consists of an overview of data, complemented by all information on definitions, measurement methods and context needed to interpret them correctly. The specialisation article is part of a set of similar fact sheets providing a complete picture of the state of the agri-environmental indicators in the EU.
Full article
Assessment
Number of farms in sharp decline
There were 9.1 million agricultural holdings (hereafter named 'farms') in the EU in 2020. This was an estimated 5.3 million fewer farms than in 2005, the equivalent of a decline of about 37 % [1].
Farms can be classified according to the activities that dominate farm income. Some farms earn income from diverse activities (mixed farming), while others specialise in crops or livestock. Farm specialisation describes the dominant activity in farm income: an agricultural holding is said to be specialised when a particular activity provides at least two-thirds of the standard output of an agricultural holding.
Almost three-fifths (58.2 %) of all farms in 2020 were categorised as specialist crop farms (see Figure 1): just over one-third (34.4 %) were specialised in field cropping, about one-fifth (21.5 %) in permanent crops and a small share (2.3 %) in horticulture. Slightly more than one-fifth (21.6 %) of the EU's farms were specialist livestock farms, with specialisation in dairying being the most common type (5.1 % of all farms), followed by cattle-rearing and fattening (4.3 %), poultry (3.9 %) and sheep, goats and other grazing livestock (3.6 %).
Mixed farms, comprising farms with crops and livestock or various types of crops or various types of livestock where more than one activity provides at least two-thirds of standard output, accounted for just under one-fifth (19.3 %) of all farms in the EU in 2020. Some farms (0.8 % of the total) could not be classified because they are subsistent in nature or because they produce goods for which no standard output can be calculated.
Number of mixed farms and livestock farms in EU down particularly sharply: specialisation in crops rising
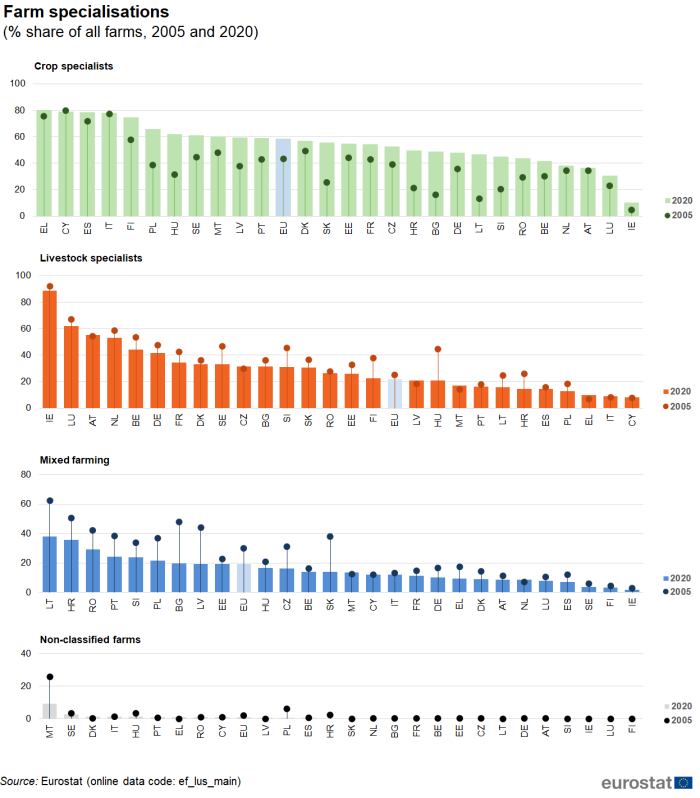
Although there were fewer EU farms of all types in 2020 than in 2005, declines in some types of farms were much sharper than others; there were 2.6 million fewer mixed farms, 1.6 million fewer livestock specialist farms and 0.9 million fewer crop specialist farms. Of the remaining 9.1 million EU farms in 2020, a higher proportion were crop specialists than in 2005 (58.2 % in 2020 compared with 43.2 % in 2005) but livestock specialist farms (21.6 % compared with 24.9 %) and mixed farms (19.3 % compared with 30.1 %) were less common (see Figure 2).
(% share of all farms, 2005 and 2020)
Source: Eurostat (ef_lus_main), Country codes
The loss of 2.6 million mixed farms in the EU between 2005 and 2020 was underpinned by the declines in Romania (1.0 million fewer mixed farms) and Poland (0.6 million fewer mixed farms) although there were declines in every EU Member State. The share of mixed farms in all farms was lower in 2020 than in 2005 in all EU Member States with the exceptions of the Netherlands, Malta and Cyprus. Mixed farms represented 37.8 % of all farms in Lithuania in 2020, the highest share among EU Member States but down sharply from 62.2 % in 2005. The sharpest percentage point (pp) declines in the share of mixed farms in all farms were in Slovakia (-24.1 pp), Lithuania (-24.4 pp), Latvia (-24.5 pp) and Bulgaria (-28.3 pp).
There were 1.6 million fewer specialist livestock farms in the EU in 2020 than in 2005, with the combined losses in Romania, Poland and Hungary accounting for 1.0 million of this overall loss, although there were declines in every EU Member State. The share of livestock specialist farms in all farms was lower in 2020 than in 2005 in a majority of EU Member States. Specialist livestock farms represented 88.4 % of all farms in Ireland in 2020, the highest share among EU Member States but down slightly from 92.2 % in 2005. The sharpest percentage point (pp) declines in the share of livestock specialist farms were in Finland (-15.4 pp) and Hungary (-24.0 pp).
The decline in the number of crop specialist farms in the EU between 2005 and 2020 was much less sharp than livestock specialist farms and mixed farms. In part, this reflected a growing number of crop specialist farms in some EU Member States like Croatia, Portugal and Lithuania, suggesting that some farms that had previously been either livestock specialist or mixed farms had changed to specialise in crops. Four in every five farms (80.0 %) in Greece were crop specialists in 2020, the highest share among EU States and slightly above its share of 75.7 % in 2005. At the other extreme, only one in every ten farms (9.9 %) in Ireland was a crop specialist farm. The share of crop specialist farms rose in almost every EU Member State, the sharpest percentage point (pp) increases between 2005 and 2020 being in Hungary (30.2 pp), Bulgaria (32.7 pp) and Lithuania (33.4 pp). Only in Italy and Cyprus were the shares almost unchanged, but in both countries almost four in five farms were crop specialist farms.
Farms in 2020 generally larger than in 2005
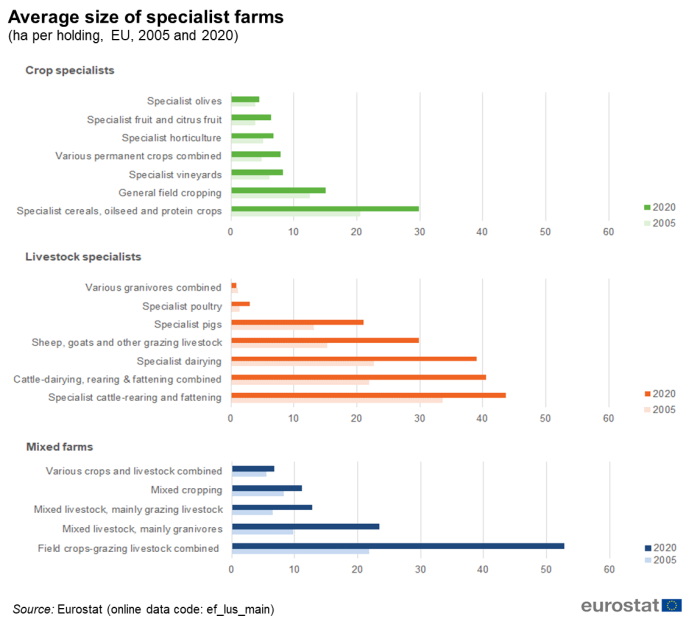
Despite the sharp decline in the number of farms between 2005 and 2020, about 400 000 hectares (ha) more land was brought into production. The average (mean) size of EU farms in 2020 was 17.4 ha, which was considerably more than the average of 10.9 ha in 2005. The average size of almost all specialist farms increased during this period (see Figure 3).
(ha per holding, EU, 2005 and 2020)
Source: Eurostat (ef_lus_main)
Within the grouping of crop specialist farms, specialist cereals, oilseed and protein crop farms had the highest average size (29.7 ha) in 2020, this was much higher than in 2005 (20.5 ha). Specialist vineyard farms, specialist permanent crop farms, specialist horticulture farms, specialist fruit and citrus fruit farms and specialist olive farms in the EU also tended to be larger in 2020 than in 2005, but average sizes remained under 9 ha.
Within the grouping of livestock specialist farms, specialist cattle-rearing and fattening farms had the highest average size (43.7 ha) in 2020, which was about 10 ha higher on average than in 2005. The average size of almost all types of specialist livestock farm in the EU were higher in 2020 than in 2005.
Of all farm types, the largest average size was for mixed farms of field crops and grazing livestock combined (an EU average of 52.8 ha). The average size of these kinds of farms more than doubled between 2005 and 2020 (from 21.7 ha).
With little change in the area used for agricultural production but falling numbers of farms, the rise in the average size of the 9.1 million farms in 2020 reflects mergers and takeovers of farms.
Half of the EU's utilised agricultural area (UAA) was on crop specialist farms
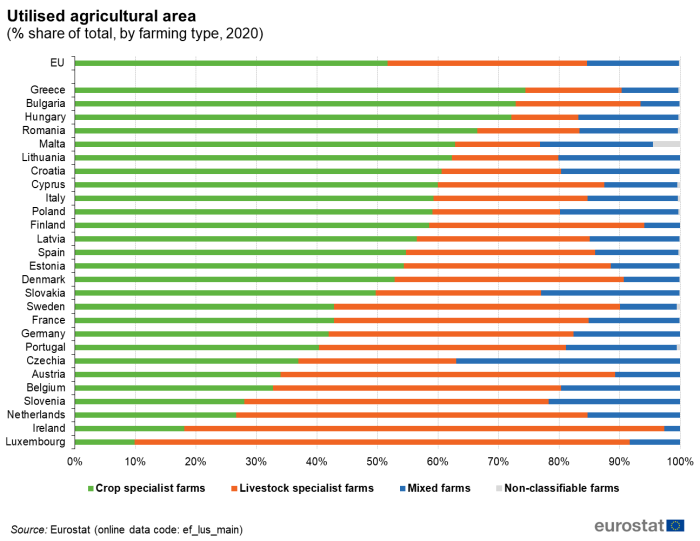
Just over half (51.7 %) of the EU's utilised agricultural area (UAA) was found on crop specialist farms in 2020, with about one-third (32.9 %) on livestock specialist farms and most of the rest on mixed farms (15.2 %). At a country-level, the share of UAA managed by each specialisation type (see Figure 4) strongly correlated the number of holdings by type of specialisation.
(% share of total, by farming type, 2020)
Source: Eurostat (ef_lus_main)
In broad terms, many countries from Eastern Europe (such as Bulgaria, Hungary and Romania) and the Mediterranean (such as Greece, Malta, and Croatia) had high proportions of crop specialist farms, reflecting conditions suitable for growing particular kinds of cereals, fruit and / or olives. Specialist livestock holdings were more prevalent in a number of countries in north-west Europe (such as Ireland, Luxembourg, the Netherlands and Belgium).
Specialist farms tend to be found in regional clusters in the EU
Farmers use their knowledge of the climate and agronomic factors (like the soil), among other factors, to determine what to grow or what animals to rear. This lends itself to a certain concentration of dominant farming types in some regions, and these clusters can be shown in maps.
Farms specialising in field cropping accounted for 43.2 % of the EU's UAA in 2020. At regional level (see Map 1), specialist field cropping farms accounted for more than two-thirds of the UAA in a number of regional clusters. These covered southern Romania, northern and eastern Bulgaria and the northern regions of Anatoliki Makedonia, Thraki and Thessalia in Greece; regions in western Hungary, Burgenland in Austria and Bratislavský kraj in Slovakia; western regions of Poland; and, a cluster of French regions from Centre – Val de Loire, through Île de France to Picardie. As well as these regional clusters, there were also more isolated regions where field cropping dominated UAA; these were the Sostines regionas in Lithuania, Helsinki-Uusimaa and Etelä-Suomi in Finland, Sjaelland in Denmark and Braunschweig in Germany.
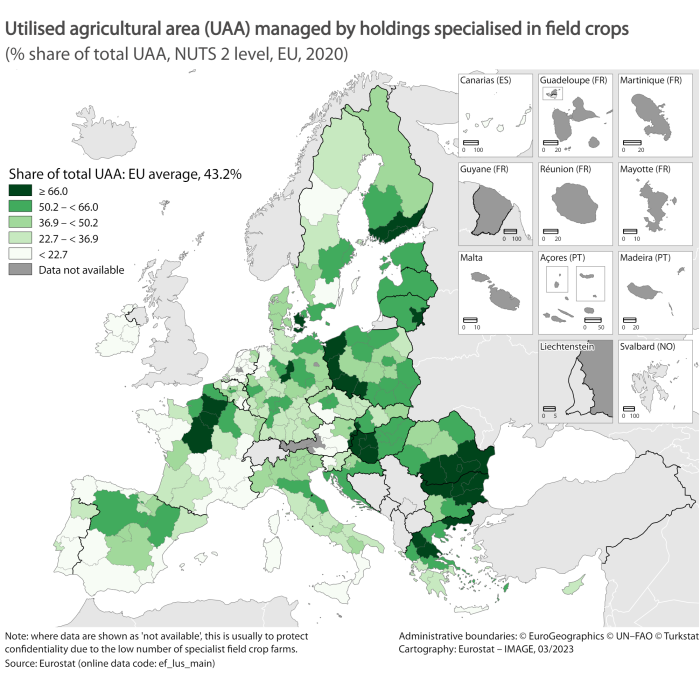
(% share of total UAA, NUTS 2 level, EU, 2020)
Source: Eurostat (ef_lus_main)
Farms specialising in grazing livestock (bovine animals, sheep and goats) accounted for 30.3 % of the EU's UAA in 2020. However, there were a number of regions where this share was above 65 %: all regions of Ireland; southern Sweden (Småland med öarna); the Alpine regions of eastern Austria (Salzburg, Tirol, Voralberg and Kärnten), of Franche-Comté (France) and of Valle d'Aosta/Vallée d'Aoste (Italy); a number of Benelux regions (Utrecht, Province of Luxembourg, Friesland, Luxembourg, Overijssel, Gelderland); Limousin and Auvergne in central France; and, some regions in northern Spain (Principado de Asturias, Cantabria and Galicia).
In addition, the share was also high on the islands of Sardegna (Italy) and the Região Autónoma dos Açores (Portugal).
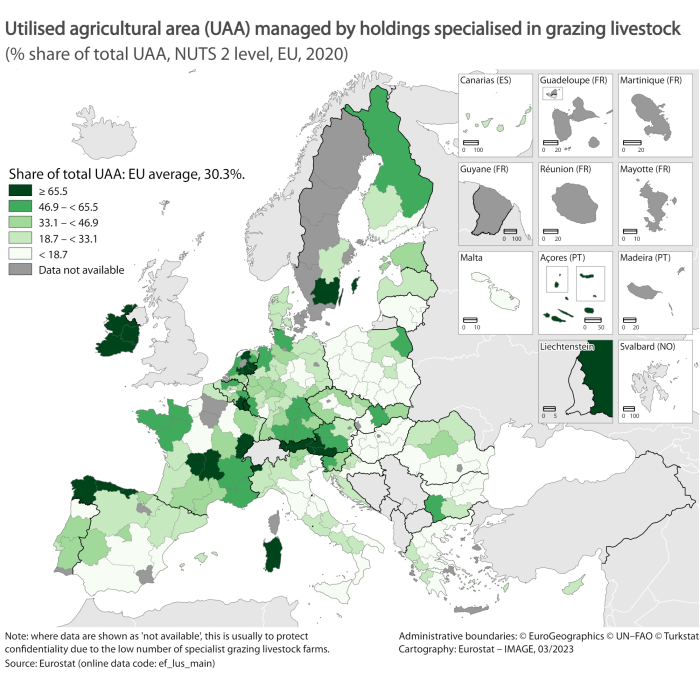
(% share of total UAA, NUTS 2 level, EU, 2020)
Source: Eurostat (ef_lus_main)
Farms specialising in permanent crops (with vineyards, orchards and olive groves) accounted for 7.6 % of the EU's UAA in 2020. However, in many regions of southern Europe permanent crops were a much more common sight (see Map 3). Indeed, permanent crops accounted for more than 45 % of UAA in some regions of Greece (Peloponnisos), Italy (Calabria and Puglia), Spain (Comunidad Valenciana and Región de Murcia) and Portugal (Algarve). In addition, about two-thirds of the UAA on the French overseas island of Mayotte in the Mozambique Channel was used by specialised permanent crop farms (particularly for bananas).
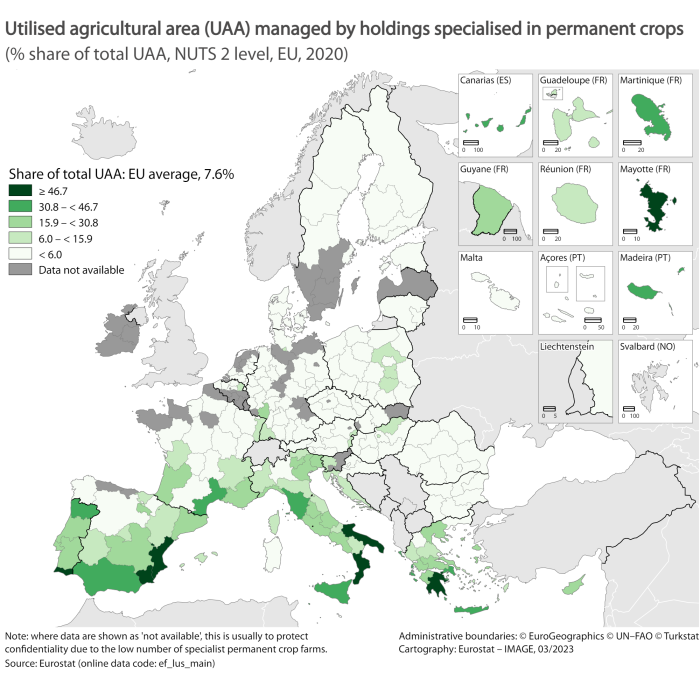
(% share of total UAA, NUTS 2 level, EU, 2020)
Source: Eurostat (ef_lus_main)
Data sources
Source data for tables and graphs
Indicator definition
Agricultural holdings can be classified according to the activities that dominate the standard output of the farm. Some farms earn income from diverse activities (mixed farming), while others specialise (crop specialist, livestock specialist). Farm specialisation describes the dominant activity in farm income: an agricultural holding is said to be specialised when a particular activity provides at least two-thirds of the standard output of the agricultural holding.
Main indicator
Share of the utilised agricultural area (UAA) managed by specialised farming.
Supporting indicator
Number and share of specialised holdings.
Links with other indicators
This indicator has links to a number of other AEI indicators that describe developments in some of the main contributory factors.
Data used and methodology
Specialisation is described on the basis of data from the Farm structure survey (FSS). Data are presented at NUTS 2 level.
Agricultural holdings are subject to the EU's typology on farming systems. Before 2010 such classification was based on the determination of the standard gross margin (SGM) of each holding (i.e. its economic size). From 2010 onwards the farm typology has been based on standard output (SO). The principle of both concepts (SO and SGM) is the same, only the way they are calculated differs. Data calculated with SO are therefore not directly comparable with data calculated with SGM. For survey years 2005 and 2007 results have been recalculated in SO to allow analysis of key characteristics by farm type or by economic size of the holding across time. The classification using SO is described in Commission Delegated Regulation 1198/2014. This article presents data with the farm typology based on SO.
Context
Introduction
Information on specialisation shows the regional diversity of types of agricultural production systems and structures. Farm specialisation occurs when a single type of farming dominates farm income. An agricultural holding is said to be specialised when a particular activity provides at least two-thirds of the production or the business size of the farm. This can be described on different levels of details; a "Specialist field crop" farm can be a specialist of "cereals, oilseeds and protein crops" or of "general field cropping" [2]. These two sub-categories can then be broken down further into specialist on e.g. "rice" or "root crops". This fact sheet uses the classification of more general types of farming i.e., farms focusing on arable crops, permanent crops, livestock (including grazing livestock) or mixed farms.
Policy relevance
During the last 20 years average farm size has grown while the number of farms has continued to decrease. This is a structural adjustment which has been driven by the subsidies of Common Agriculture Policy (CAP) (proportional to farmed areas), and economic considerations. Specialisation can lead to a higher efficiency in production, supporting an increase in the level of production per production unit (e.g. unit of land, livestock unit, agricultural work unit or capital unit). An indicator of specialisation is the trend in the share of the agricultural area managed by specialised types of farms. It shows overall whether farming is becoming more specialised and which specialised farm types are becoming more important.
Agri-environmental context
Farm specialisation towards crops or livestock has an impact on the nutrient balance of a holding. Fertilisers and manure contain large amounts of nutrients which crops use to grow. However, the amount of nutrients a crop can take up is limited, and the excess can leak into water, soil and air, causing a range of environmental problems. The EU has indeed adopted different pieces of legislation which aim at reducing and preventing pollution from, inter alia, nutrients (Water Framework Directive, Nitrates Directive, Air Quality Directive). On the one hand, specialised livestock holdings with little or no crop area or pasture are likely to have a nutrient surplus, as it is not possible to spread all of the manure produced on the farm on crop area or pastures belonging to the agricultural holding without severe risks to the environment. This can be mitigated if the farm is able to extensify its production, to export excess manure to neighbouring farms with large crop areas or to process the manure. However, when a whole region is specialised in livestock breeding, manure disposal can be very problematic, as high transport costs may make the transport of manure to other regions prohibitively expensive. Thus, manure processing and mitigation measures which act at the source of the pollution can be effective. Specialist crop holdings, on the other hand, may face a nutrient deficit and have to import nutrients. Due to the low availability of manure, regions specialised in cropping tend to rely on mineral fertilisers which are produced with high amounts of energy and contribute to greenhouse gases. If not applied correctly, this mineral fertilisation can also lead to water pollution.
Specialisation of individual farms is associated with the intensification of the production and the increased use of chemical inputs (per unit area), the mechanisation and the simplification of landscape. As a result, the specialisation of individual farms considerably increases the pressure on biodiversity, soil, water and air quality. Such negative effects on the environment can be mitigated in regions which have a mix of farms. However, when farm specialisation occurs at the regional level, land use is changed towards less diverse cropping and/or livestock patterns due to more concentration on a limited number of products. The introduction of greening requirements under the CAP requires farmers with more than 10 ha of arable land to cultivate different crops:
- Up to 30 ha: farmers have to grow at least two crops and the main crop cannot cover more than 75 % of the land.
- Over 30 ha: farmers have to grow at least three crops, the main crop covering at most 75 % of the land and the two main crops at most 95 %.
This greening requirement has however not introduced diversification in some intensive mono-cropping areas in Europe.
In intensive areas, a less diverse cropping/livestock pattern already can cause a loss of diversity in farmland habitats, as well as in associated flora and fauna, crop varieties and livestock breeds, leading to an overall reduction in genetic diversity. However, some specialised systems have positive impacts on the environment if they are able to produce environmental benefits. For instance, extensive cattle and sheep grazing in mountainous regions can be highly specialised, but have a positive impact on the conservation of high-value EU habitats and associated biodiversity.
The environmental effects of mixed farming are less obvious, but as above, they are mitigated if the farming is extensive. Diversification can improve income security and thus the viability of a farm, by spreading risks over several activities. Diversification could potentially prevent land abandonment in such areas. If one activity fails, say, because of animal or crop disease, other activities may still render income. A specialised holding, on the contrary, mainly depends on a single activity. If this fails, the viability of the entire holding may be at stake. When farmers cease activities in marginal areas agricultural habitats are lost and the risk of soil erosion may increase.
Organic farms are more focused on integrated use of livestock and land resources. Through crop rotation, crop diversity and use of livestock manure, natural resources are managed in a more sustainable way than in specialised and intensive farms. The holistic approach of organic farming requires a livestock production related to the land, where the produced manure is used to nourish the crop production.
Direct access to
- Agriculture, forestry and fishery statistics - 2018 edition
- Agriculture (agr), see:
- Farm structure (ef)
- Main farm indicators by NUTS 2 regions (ef_mainfarm)
- Farm indicators by agricultural area, type of farm, standard output, legal form and NUTS 2 regions (ef_m_farmleg)
- Main farm indicators by NUTS 2 regions (ef_mainfarm)
- Farm structure (ef)
- Structure of agricultural holdings (ef_sims)
- Data used: Agriculture (agr), see:
- Farm structure (ef)
- Main farm indicators by NUTS 2 regions (ef_mainfarm)
- Farm indicators by agricultural area, type of farm, standard output, legal form and NUTS 2 regions (ef_m_farmleg)
- Main farm indicators by NUTS 2 regions (ef_mainfarm)
- Farm structure (ef)
- Commission Communication COM(2006)508 final - Development of agri-environmental indicators for monitoring the integration of environmental concerns into the common agricultural policy
- Commission Staff working document accompanying COM(2006)508 final
Notes
- ↑ Some of this observed change may reflect methodological differences for 2005 and 2020 (in particular for changes in survey thresholds). Note that the EU figure for 2005 includes 2007 data for Croatia.
- ↑ For more information on the classification of agricultural holdings by type of farming see the Basic Act, Council Regulation (EC) No 1217/2009 of 30 November 2009 that set up a network for the collection of accountancy data on the incomes and business operation of agricultural holdings in the European Community. This is supplemented by Commission Delegated Regulation (EU) No 1198/2014 of 1 August 2014. The Basic Act is supported by Commission Implementing Regulation (EU) 2015/220 of 3 February 2015 and by the amending Commission Implementing Regulation (EU) 2019/1975 of 31 October 2019
