Environmental economy – statistics on employment and growth
Data extracted: March 2024
Planned article update: April 2025
Highlights
Development of key indicators for the environmental economy and the overall economy, EU, 2000–2021
This article presents statistics on employment and growth in the European Union’s (EU’s) environmental economy, as it is defined in the European environmental goods and services sector (EGSS) accounts. The environmental economy encompasses activities and products that serve either of two purposes: ‘environmental protection’ — that is, preventing, reducing and eliminating pollution or any other degradation of the environment, or ‘resource management’ — that is, preserving natural resources and safeguarding them against depletion. EGSS accounts provide information on production (output) and export of environmental goods and services and the related employment and gross value added.
Full article
Development of key indicators for the environmental economy
According to Eurostat estimates, employment in the EU environmental economy increased from 3.2 million full-time equivalents in 2000 to 5.2 million full-time equivalents in 2021. The environmental economy generated €937 billion output and €369 billion gross value added in 2021. Between 2000 and 2021, employment and gross value added grew faster in the environmental economy than in the overall economy (see Figure 1).
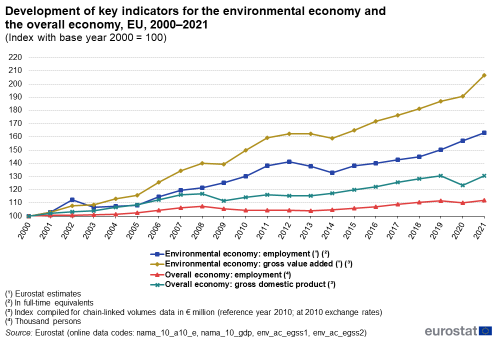
(Index with base year 2000 = 100)
Source: Eurostat (env_ac_egss1), (env_ac_egss2), (nama_10_gdp) and (nama_10_a10_e)
Employment increased on average 2.4 % on an annual basis from 2000 to 2021. The first decade of the millennium was a period of almost steady job creation in the environmental economy. The declining employment in 2003 marks an exception in a period of growth, which came to an end in 2012. From 2012 to 2014, job numbers fell in two consecutive years. Since then, employment has grown again, and in 2021 employment in the environmental sector is higher than in any of the previous 20 years.
Between 2000 and 2021, the environmental economy has outperformed the overall economy in terms of employment and value added. Driven by the quick economic recovery in 2021, with an increase in overall employment by 1.5 % and EU gross domestic product by 6.0 %, the environmental economy grew in employment by 3.7 % and in gross value added by 8.3 %. Also in 2009, when the financial crisis led to a 4.3 % contraction in GDP, gross value added from the production of environmental goods and services only saw a minor decrease of 0.5 %. In the aftermath of the crisis, the environmental economy showed a strong growth until 2011. Between 2012 and 2014, employment fell more than in the overall economy, but employment in the environmental sector bounced back quickly afterwards. Since 2014, growth in the environmental sector has picked up again and gross value added has been growing on average 3.5 % annually - when comparing 2000 to 2021.
Employment by environmental domain
Employment in the environmental economy can be broken down by environmental protection and resource management activities, following the classification of environmental protection activities (CEPA) and the classification of resource management activities (CReMA); see section Data sources for more information). Figure 2 presents a breakdown into three environmental protection activities (waste management; wastewater management; other environmental protection activities) and two resource management activities (management of energy resources, combining energy efficiency and renewable energy production, and management of waters). Employment related to the management of energy resources grew by a factor of 3.3 since 2000. Employment in waste management also increased but less than half as much as management of energy resources. The number of full-time jobs in the other three domains grew with a lower rate.
Job creation related to renewable energy and energy efficiency stems from the production of renewable energy itself as well as from the manufacturing of renewable energy and energy-efficient equipment, and the provision of pertinent installation, engineering and research services. Employment in this domain increased from 0.6 million full-time equivalents in 2000 to 2.0 million full-time equivalents in 2021. In other words: more than a million full-time equivalent jobs have been created in the EU between 2000 and 2021 also as a result of renewable and energy-efficiency measures. The second largest contribution to environmental employment in 2021 came from waste management, with the number of jobs increasing from 0.9 million full-time equivalents in 2000 to 1.3 million full-time equivalents in 2021 (overall increase of 51 %). By contrast, employment related to wastewater management decreased in the same period by 9 % from 0.7 million to 0.6 million full-time equivalents. Whereas environmental protection accounted for more than three quarters (77 %) of the employment in the environmental economy in 2000, the share decreased to 60 % in 2021 following the creation of jobs related to renewable energy and energy-efficiency.
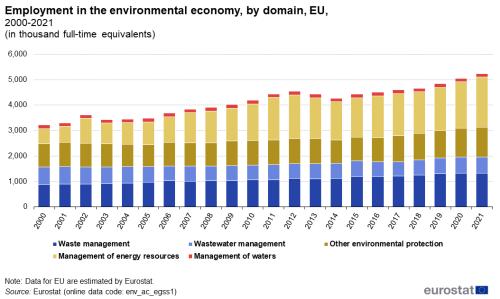
(thousand full-time equivalents)
Source: Eurostat (env_ac_egss1)
Employment, production and value added in the environmental economy
The environmental economy can also be analysed with a view on production units, using the statistical classification of economic activities (NACE). Because units producing environmental goods and services can engage in a range of activities, an analysis by economic activity provides a complementary picture to the analysis by environmental domain. Table 1 follows this alternative approach. It shows that most employment within the EU environmental economy in 2021 was related to energy and water supply, sewerage, waste management and remediation activities (NACE Sections D and E) with 1.6 million full-time equivalents followed by construction (NACE Section F) with 1.4 million full-time equivalents. The environmental economy also provides 1.0 million full-time equivalent jobs related to other services activities, 0.8 million full-time equivalent jobs in agriculture, forestry and fishing, and 0.5 million full-time equivalent jobs in mining, quarrying and manufacturing.
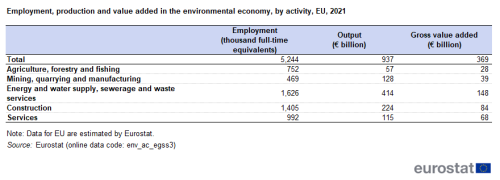
Source: Eurostat (env_ac_egss3)
Table 1 also includes total output and gross value added. In 2021, energy and water supply, sewerage, waste management and remediation activities generated some €148 billion, or 40 % of the value added of the environmental economy (see Figure 3). Construction contributed €84 billion of value added or 23 % to the total gross value added of the environmental economy. This activity includes energetic refurbishment of existing buildings and the construction of new energy-efficient buildings as well as noise insulation work, maintenance and repair of water networks, construction work for wastewater and waste treatment plants and sewerage systems. Miscellaneous services generated together €68 billion of value added (19 % of the total) for the environmental economy. The remaining activities contributed 11 % (mining, quarrying and manufacturing) and 8 % (agriculture, forestry and fishing) to the gross value added of the environmental economy.
Labour productivity expressed as value added per full-time equivalent is highest for energy and water supply, sewerage, waste management and remediation activities, generating on average €90 900 per full-time equivalent job (generating 40 % of the value added of the environmental economy with 31 % of the labour input). Labour productivity is lowest in agriculture and forestry, which generated on average €37 900 per full-time equivalent (generating 8 % of the value added of the environmental economy with 14 % of the labour input). For more information on productivity, please refer to the article on material flow accounts and resource productivity.
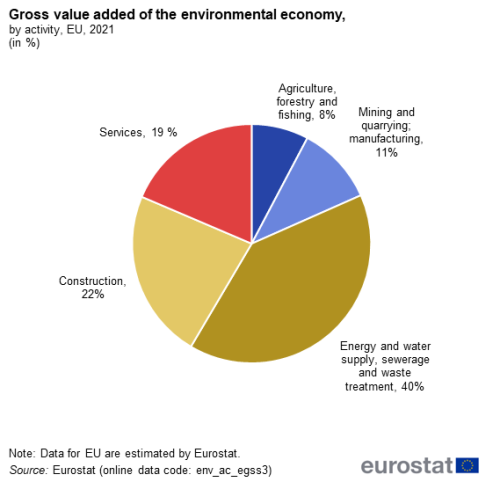
Source: Eurostat (env_ac_egss3)
Evolution of gross value added of the environmental economy
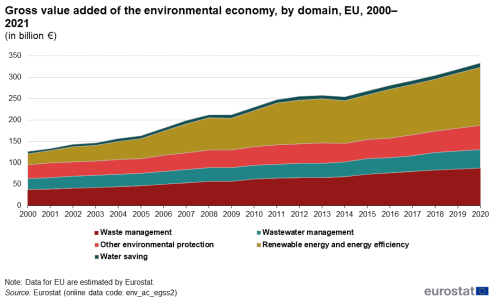
Gross value added of the environmental economy increased from €126 billion in 2000 to €369 billion in 2021 (Figure 4; note that the trend is based on current prices as chain-linked volumes for all environmental and resource management activities are not available). Also the contribution of the environmental economy to GDP increased, namely from 1.6 % in 2000 to 2.5 % in 2021. Gross value added of the environmental economy rose steadily between 2000 and 2008, reaching €212 billion. It declined in 2009 as a result of the financial crisis but showed robust growth in 2010 and 2011, and in all years after 2014.
Gross value added of environmental protection activities increased from €96 billion in 2000 to €200 billion in 2021. The contribution of environmental protection to GDP remained stable over this period at 1.2-1.4 %. Gross value added of resource management activities had a lower baseline value in 2000, namely €31 billion (or 0.4 % of GDP) but grew faster to reach €169 billion (or 1.2 % of GDP) in 2021, largely due to growth in the renewable energy sector.
Source: Eurostat (env_ac_egss2)
Source data for tables and graphs
Data sources
This article presents data from the environmental goods and services sector (EGSS) accounts, which constitute one of the six modules of the European environmental economic accounts. Environmental economic accounts analyse the interaction between the environment and the economy by organising environmentally relevant information on the economy in a way that is consistent with the accounting principles of national accounts. Environmental economic accounts can be used, for example, to identify the most polluting economic activities or activities that contribute most to the depletion of natural resources. They also provide information on the interaction of government and households with the environment, on the expenditures for protecting the environment and, in the case of EGSS, on the economic activity dedicated to environmental protection and resource management. European environmental accounts are established by Regulation (EU) No 691/2011; Annex V of the regulation sets out the reporting requirements for Member States. The first data collection took place in 2017. Since then, data for the environmental goods and services sector at the Member State level are collected on an annual basis.
The EU aggregates reported in this article are not yet compiled as a direct sum of EU Member States estimates. Instead, Eurostat uses a standardised data integration approach combining data available from various Eurostat data collections and other international and national sources, including: national accounts, environmental expenditure statistics and accounts, structural business statistics, industrial commodity statistics, labour statistics, international trade statistics, agriculture statistics and energy statistics. The methods are documented in the EGSS Handbook and the EGSS Practical Guide.
The accounts for the environmental goods and services sector provide information on output, gross value added, employment, and export related to the production of goods and services that help protecting the environment or preserving the stock of natural resources. Eurostat's methodology for data recording is in line with the United Nations (UN’s) system of integrated environmental and economic accounting (SEEA), which is an international statistical standard.
This article focuses on employment and gross value added; the latter is given in volume terms, as chain-linked volumes for the reference year 2010 (at 2010 exchange rates; Figure 1) and for individual activities in current prices (i.e., at prices of the year to which the data refer; Figure 4). The volume measures are overall used to analyse the economic growth over time, discounting the effect of price changes.
The scope of the environmental goods and services sector is defined in the Commission Implementing Regulation (EU) No 2015/2174, comprising an indicative compendium of environmental products and activities.
EGSS variables
Employment is defined as in national accounts. It is measured in full-time equivalents (total hours worked divided by the average annual hours worked in a full-time job).
Output is the total value of goods and services that have been produced for use outside of the producer unit, for own final use or for inventories at the end of the reporting period. The environmental goods and services sector accounts distinguish between market and non-market output, output for own final use and for ancillary use, the latter consisting of products for further transformation in down-stream production processes within the enterprise.
Gross value added represents the contribution of environmental goods and services towards GDP. In broad terms, it is the difference between the value of production output and intermediate consumption.
EGSS scope and environmental domains
The environmental goods and services sector accounts comprise two broad groups of activities and products:
- environmental protection — activities whose purpose is to prevent, reduce and eliminate pollution and any other degradation of the environment;
- resource management — activities whose purpose is to preserve and maintain natural resources, hence safeguarding them against depletion.
EGSS data are collected and disseminated following established schemes for the classification of environmental protection activities (CEPA) and resource management activities (CReMA):
- CEPA 1 — protection of ambient air and climate, of which,
- CEPA 1.1.2 and 1.2.2 — protection of climate and ozone layer
- CEPA 2 — wastewater management (aka sewerage)
- CEPA 3 — waste management
- CEPA 4 — protection and remediation of soil, groundwater and surface water
- CEPA 5 — noise and vibration abatement
- CEPA 6 — protection of biodiversity and landscapes
- CEPA 7 — protection against radiation
- CEPA 8 — environmental research and development
- CEPA 9 — other environmental protection activities
- CReMA 10 — management of water (aka water saving)
- CReMA 11 — management of forest resources, of which,
- CReMA 11.A — management of forest areas
- CReMA 11.B — minimisation of the intake of forest resources
- CReMA 12 — management of wild flora and fauna
- CReMA 13 — management of energy resources
- CReMA 13A — production of energy from renewable resources
- CReMA 13B — heat/energy saving and management (aka energy efficiency)
- CReMA 13C — minimisation of the use of fossil energy as raw materials
- CReMA 14 — management of minerals
- CReMA 15 — research and development activities for resource management
- CReMA 16 — other resource management activities
CEPA 2000 is a recognised international standard included in the family of international economic and social classifications. It can be downloaded from the Ramon website. Estimates at the EU level are not available for CReMA 11, CReMA 12, CReMA 13C, CReMA 14, CReMA 15 and CReMA 16.
Context
Climate change, environmental degradation and unsustainable resource use present an existential threat to Europe. To meet this challenge, the Commission has adopted in 2019 the European Green Deal - an ambitious roadmap for a sustainable, resource-efficient and competitive economy. The goods and services produced by the environmental economy are central to this ambition.
The accounts of the environmental goods and services sector provide the ideal framework to compile and report data on employment directly related to production activity intended to protect the environment and to manage natural resources. National and EU-wide data on the environmental economy can provide rationale for policy intervention and serve as a benchmark for policy targets under the European Green Deal. Being compatible with the concepts from national accounts, EGSS data can provide input to microeconomic and macroeconomic analyses and multi-disciplinary research initiatives.
Direct access to
- Environment, see:
- Environmental goods and services sector (env_egs)
- Employment in the environmental goods and services sector (env_ac_egss1)
- Production, value added and exports in the environmental goods and services sector (env_ac_egss2)
- Production, value added and employment by industry groups in the environmental goods and services sector (env_ac_egss3)
- Regulation (EU) No 691/2011 on European environmental economic accounts
- Regulation (EU) No 549/2013 of 21 May 2013 on the European system of national and regional accounts (ESA2010)
- Commission Implementing Regulation (EU) No 2015/2174 on the indicative compendium of environmental goods and services
- Summaries of EU legislation: European environmental economic accounts
- Summaries of EU legislation: European Union system of national and regional accounts
- European Green Deal
- European Environment Agency: SOER 2020 — The European environment — state and outlook 2020: knowledge for transition to a sustainable Europe
- Communication of the European Commission to the European Parliament, the Council, the European Economic and Social Committee and the Committee of the Regions (COM(2014) 446 final) Green Employment Initiative: Tapping into the job creation potential of the green economy
- Eco-Innovation
- Eco-innovation Observatory (EIO)
- Measuring the Environmental Goods and Services Sector: Issues and Challenges (UNEP, 2014, Working Paper)
- OECD - Green growth and eco-innovation
- Promoting green jobs throughout the crisis — a handbook of best practices in Europe (2013)
- Study on the competitiveness of the EU Renewable Energy Industry (EU REI)
- ILO's green jobs website