Acquisition of citizenship statistics
Data extracted in February 2024.
Planned article update: February 2025.
Highlights
In 2022, EU Member States granted citizenship to 989 900 persons having their usual residence on EU territory, an increase of around 20 % compared with 2021. Consequently, 2.6 usual residents per hundred resident non-national citizens were naturalised.
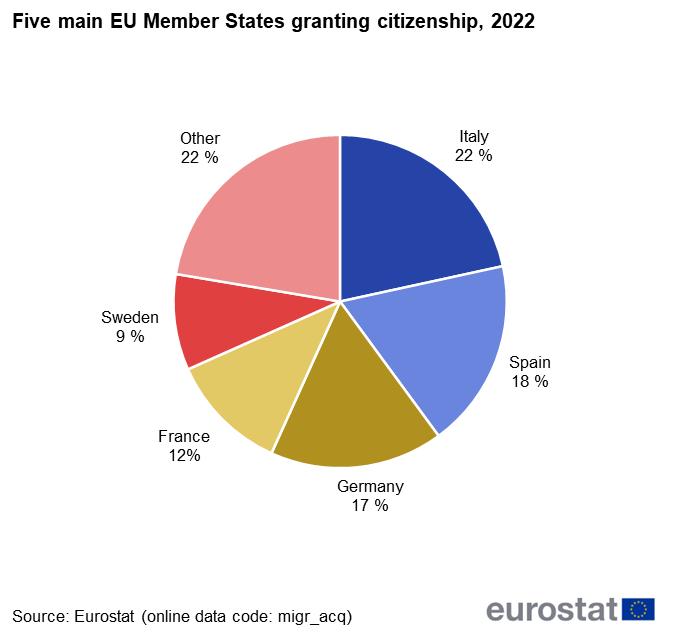
Most new citizenships in 2022 were granted by Italy (213 700, or 22 % of the EU total), Spain (181 600, or 18 %), Germany (166 600, or 17 %), France (114 500, or 12 %) and Sweden (92 200, or 9 %).
In 2022, Moroccans, Syrians, and Albanians remained in the top 3 recipients of EU country citizenship.
Acquisitions of citizenship per 1000 usual residents, 2022
This article presents recent statistics on the acquisition of citizenship in the European Union (EU).
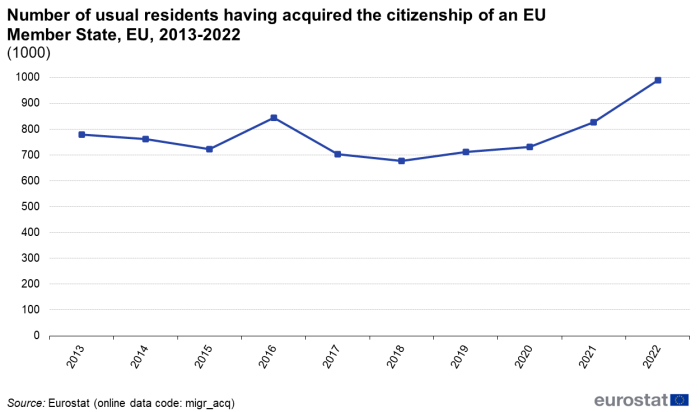
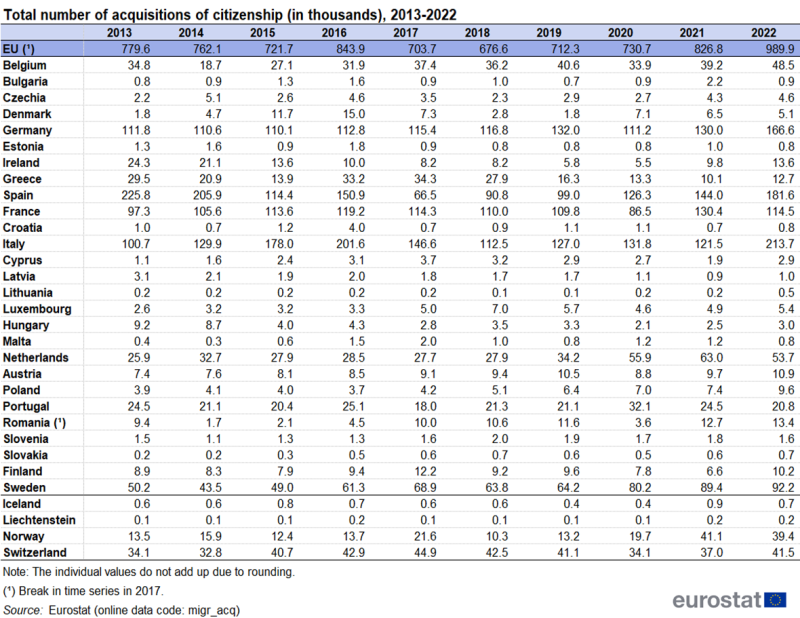
In 2022, around 989 900 persons acquired citizenship of the EU Member State of their usual residence, compared with 826 800 in 2021 and 730 700 in 2020.
Most new citizenships in 2022 were granted by Italy (213 700, or 22 % of the EU total), Spain (181 600, or 18 %), Germany (166 600, or 17 %), France (114 500, or 12 %) and Sweden (92 200, or 9 %).
Of those acquiring citizenship of an EU Member State, 87 % had previously been citizens of non-EU countries. Of these, citizens of Morocco (112 700 persons) made up the highest numbers, followed by citizens of Syria (90 400 persons), Albania (50 300 persons), Türkiye (29 700 persons) and Ukraine (29 300 persons).
Full article
EU Member States granted citizenship to 989 900 persons in 2022
In 2022, 989 900 people obtained citizenship of the EU Member State of their usual residence, an increase of around 20 % compared with 2021. This was mainly caused by the increases in absolute terms in Italy (92 200 more residents were granted Italian citizenship than in 2021), followed by Spain (37 600 more), Germany (36 600 more) and Belgium (9 300 more). By contrast, the largest decreases in absolute terms were observed in France (15 900 fewer residents were granted French citizenship compared with 2021), followed by the Netherlands (9 300 fewer) and Portugal (3 700 fewer).
Source: Eurostat (migr_acq)
Source: Eurostat (migr_acq)
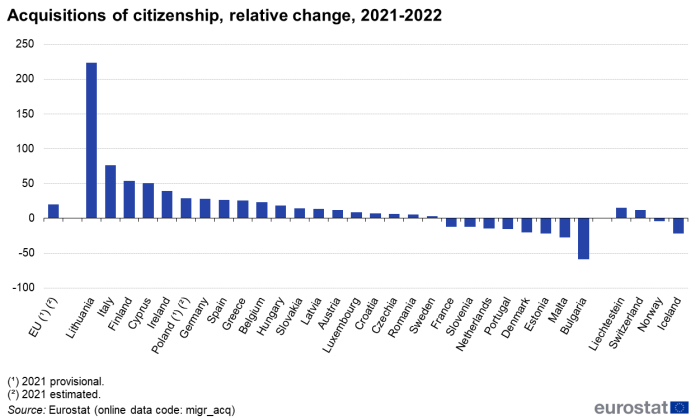
In relative terms, the largest increases occurred in Lithuania (223 %), Italy (76 %), Finland (54 %) and Cyprus (50 %), while the largest decreases occurred in Bulgaria (59 %) and Malta (27 %), see Figure 2.
The top five citizenship-granting countries accounted for 78 % of new citizenships granted in the EU in 2022: Italy (213 700, or 22 % of the EU total), Spain (181 600, or 18 %), Germany (166 600, or 17 %), France (114 500, or 12 %) and Sweden (92 200, or 9 %).
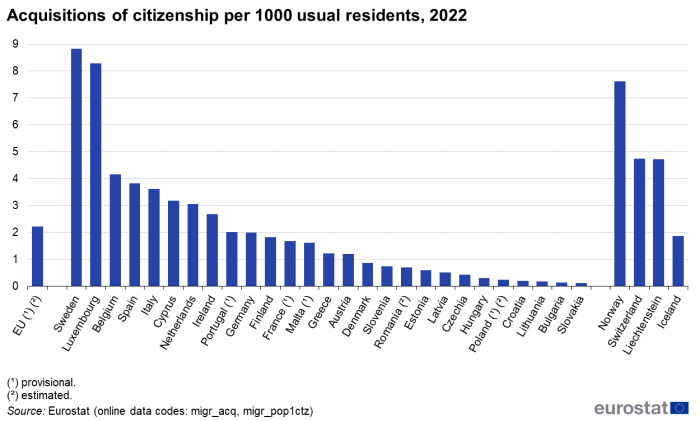
In relation to the total population on 1 January 2022, the highest number of citizenships were granted by Sweden (8.8 per thousand persons), followed by Luxembourg (8.3), Belgium (4.2), Spain (3.8) and Italy (3.6), see Figure 4.
Source: Eurostat (migr_acq) and (migr_pop1ctz)
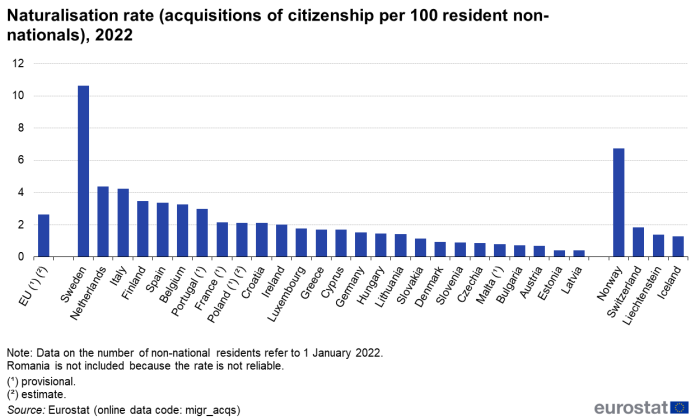
An indicator commonly used to measure the effect of national policies on citizenship is the "naturalisation rate" or ratio of the total number of citizenships granted over the stock of non-national population in a country at the beginning of the year. It is important to note that changes in naturalisation rates can also be attributed to changes in the non-national population and in the way the non-national population is measured (see Data sources).
In 2022, in the EU as a whole, 2.6 usual residents per hundred resident non-national citizens were granted citizenship. The country with the highest naturalisation rate was Sweden (10.6), followed by the Netherlands (4.4) and Italy (4.3), while Latvia (0.4) and Estonia (0.4) had the lowest rates (See Figure 5).
Source: Eurostat (migr_acqs)
Of the five EU countries that granted the most citizenships (Italy, Spain, Germany, France and Sweden), Germany (1.5) and France (2.2) had a naturalisation rate below the EU average (2.6), while Sweden (10.6), Italy (4.3) and Spain (3.4) were above it (see Figure 5).
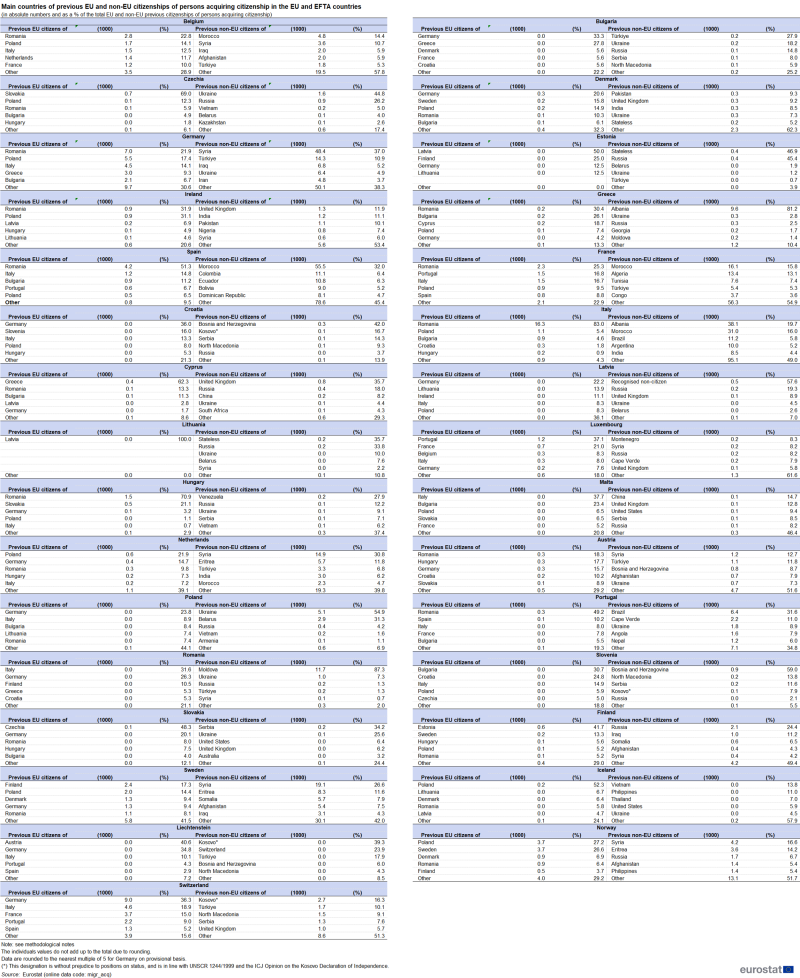
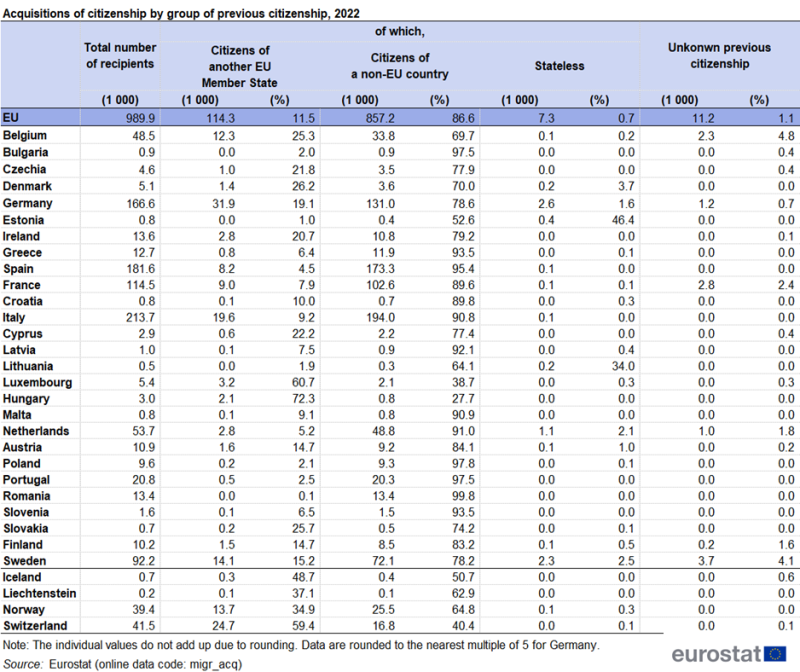
Around 857 200 persons - 87 % of those who acquired citizenship of an EU Member State in 2022 - were previously citizens of a non-EU country, residing in the respective Member State. There were also 114 300 EU citizens who acquired citizenship of another EU Member State - 12 % of the total number of newly acquired citizenships (see Table 2). On 1 January 2022, EU citizens represented 94.6 % of the EU population.
In Hungary and Luxembourg, the majority of new citizenships (around 72 % and 61 % respectively) were granted to citizens of another EU Member State (see Table 2). In the case of Luxembourg, Portuguese citizens accounted for the largest share (37 %), followed by French (21 %), Belgian (8 %) and Italian citizens (8 %). In Hungary, the most numerous EU nationals acquiring citizenship were Romanians (71 %, compared with 21 % Slovaks, the second most numerous group) (see Table 4).
Source: Eurostat (migr_acq)
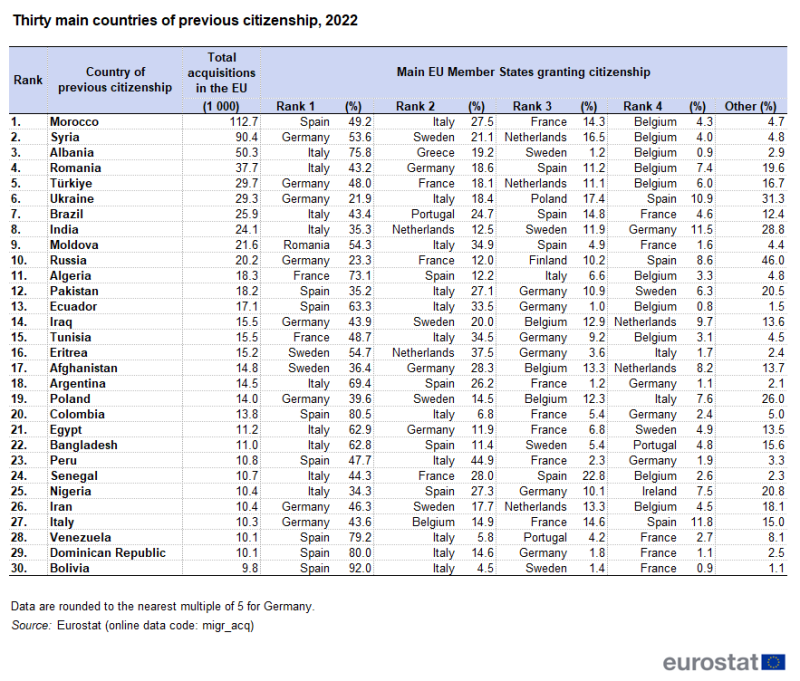
In 2022, Moroccans, Syrians, and Albanians remained in the top 3 recipients of EU country citizenship.
In terms of previous citizenship, the largest groups in 2022 were Moroccans (112 700 persons, or around 11.4 % of all acquisitions of citizenship), Syrians (90 400, or 9.1 %), Albanians (50 300, or 5.1 %), Romanians (37 700, or 3.8 %) and Turks (29 700, or 3.0 %).
Source: Eurostat (migr_acq)
The key EU Member States granting citizenship to each of the top 5 nationalities are, respectively (see also Table 3):
- Moroccans : Spain (49.2 %), Italy (27.5 %), and France (14.3 %);
- Syrians : Germany (53.6 %), Sweden (21.1 %), and the Netherlands (16.5 %);
- Albanians : Italy (75.8 %) and Greece (19.2 %);
- Romanians : Italy (43.2 %), Germany (18.6 %) and Spain (11.2 %);
- Turks: Germany (48.0 %), France (18.1 %), and the Netherlands (11.1 %).
Table 4 ![]() is available here.
is available here.
The total number of citizenships granted has increased for all of the previous citizenships that were in the top five in 2022 and 2021. Thus, the total number of acquisitions of citizenship has increased for Moroccans (by 26 500 persons, or 31 %), Albanians (by 17 900 persons, or 55 %), Romanians (by 9 100 persons, or 32 %), Syrians (by 6 400 persons, or 8 %) and Turks (by 3 700 persons, or 15 %). The total number of acquisitions of citizenship also increased substantially in 2022 for Ukrainians (by 8 300 persons, or 40 %) Indians (by 7 900 persons, or 49 %), Argentinians (by 7 100 persons, or 97 %) and Moldovans (by 6 300 persons, or 42 %), while it decreased significantly for British (by 2 900 persons, or 31 %) citizens. In 2022 compared with 2021, in the thirty main groups of previous citizenship, Argentinians and Egyptians replaced Serbians and British citizens.
There were three EU Member States in the top 30 by number of acquisitions of citizenship in 2022: Romania (already mentioned), Poland (14 000 persons, or 1.4 %), and Italy (10 300 persons, or 1.0 %) (see Table 3). The key countries receiving their citizens were, respectively:
- Poles : Germany (39.6 %), Sweden (14.5 %) and Belgium (12.3 %).
- Italians : Germany (43.6 %), Belgium (14.9 %), and France (14.6 %).
Source: Eurostat (migr_acq)
Half of those acquiring a new citizenship were aged 31 years or less
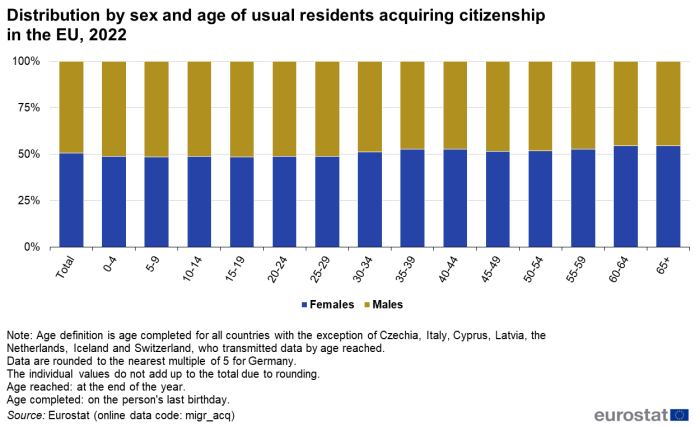
The distribution by sex shows a slight predominance of women (50.6 %, compared with 49.4 % men), especially for the age groups above 30 years (54.5 % women in the age group 60-64 years).
Source: Eurostat (migr_acq)
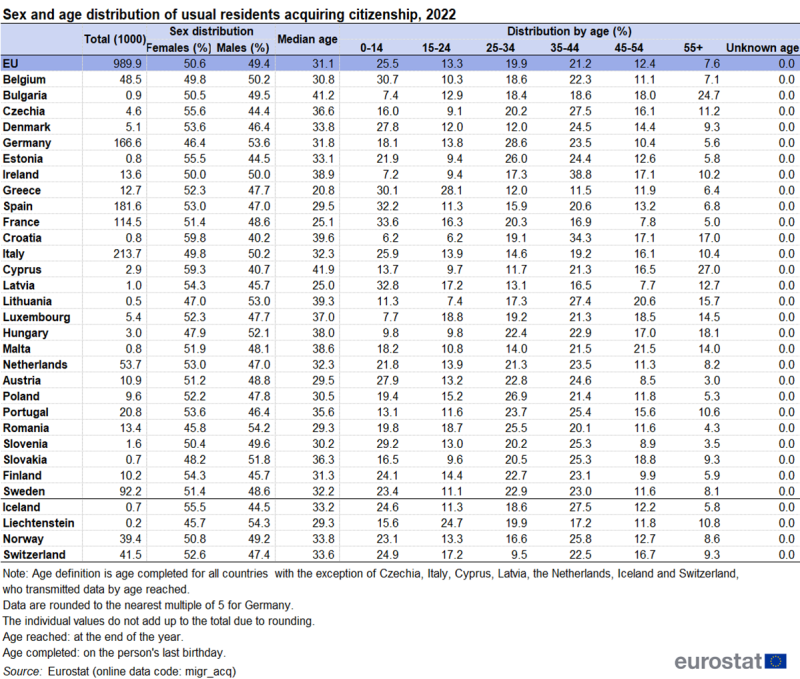
Acquisitions of citizenship by women outnumbered acquisitions by men in 2022 in all but 8 Member States (Belgium, Germany, Ireland, Italy, Lithuania, Hungary, Romania, Slovakia). The highest proportion of citizenship acquisitions by women was recorded in Croatia (59.8 %), while the country with the highest share of acquisitions by men was Romania (54.2 %) (see Table 5).
In 2022, the median age of persons acquiring citizenship in the whole of the EU was 31 years. The Member State with the lowest median age was Greece: half of its new citizens were younger than 21 years. The highest median age (42 years) was in Cyprus.
Age distribution varied from one Member State to another due to differences in citizenship legislation and age structure of the non-national population (see Data sources). However, the common feature uniting all Member States was that most new citizenships were acquired by younger people, and that the numbers declined with age.
In 2022, 39 % of persons granted citizenship of an EU country were younger than 25 years; another 41 % were aged 25-44 years, while those aged 45 years and over accounted for 20 %.
Among those acquiring the citizenship of any EU Member State, 26 % were children below the age of 15 years (0-14 years); the highest proportions were in France (34 %), Latvia (33 %), Spain (32 %) and Belgium (31 %). The countries with the lowest proportion of citizen acquisitions by children were Croatia (6 %), Ireland (7 %), Bulgaria (7 %) and Luxembourg (8 %).
Across all EU Member States, 8 % of those who were granted citizenship were at least 55 years of age. Cyprus (27 %), Bulgaria (25 %) and Hungary (18 %) had the highest shares of citizenship granted to persons aged 55 years and over. The countries with the lowest shares of of citizenships granted to persons aged 55 years and over were Austria (3 %), Slovenia (4 %) and Romania (4 %).
Source data for tables and graphs
Data sources
Eurostat produces statistics on a range of issues related to acquisitions of citizenship, international migration flows and migrant population stocks. Data are collected on an annual basis and are supplied to Eurostat by the national statistical authorities of the EU Member States. Data for Germany (migr_acq and migr_acq1ctz) are rounded to the nearest multiple of 5 starting from reference year 2018. The break in time series for Romania in 2017 relates to the introduction of improved administrative data sources that give more complete breakdowns for country of previous citizenship.
Data in this article are rounded to the nearest hundred.
Legal references
Since 2008 data on acquisitions of citizenship are collected by Eurostat under the provisions of Article 3.1.(d) of Regulation (EC) No 862/2007 on migration statistics, stating that: "Member States shall supply to the Commission (Eurostat) statistics on the numbers of (…) persons having their usual residence in the territory of the Member State and having acquired during the reference year the citizenship of the Member State and having formerly held the citizenship of another Member State or a third country or having formerly been stateless, disaggregated by age and sex, and by the former citizenship of the persons concerned and by whether the person was formerly stateless."
The collection of data on acquisition of citizenship is defined by Regulation (EC) No 862/2007 and breakdowns and composition of the EU, EFTA and candidate countries groups are given in the implementing Regulation (EU) No 351/2010.
Definitions
This article concerns the acquisition of citizenship by the usually resident population of Member States. Usual residence means the place where a person normally spends the daily period of rest, regardless of temporary absences for purposes of recreation, holidays, visits to friends and relatives, business, medical treatment or religious pilgrimage.
Citizenship is the legal bond between an individual and a state, acquired by birth, naturalisation, or other means according to national legislation. Naturalisation is the process by which a state grants its citizenship through a formal act on application of the individual concerned. Other ways of granting citizenship may include spouses of nationals, minors adopted by nationals and descendants of nationals born abroad returning to the country of origin of their ancestors.
The naturalisation rate is the ratio of the number of persons who acquired the citizenship of a country during a calendar year over the stock of non-national residents in the same country at the beginning of the year. The naturalisation rate should be used with caution, however, as the numerator includes all means of acquisition and not just naturalisation of eligible residing non-nationals and the denominator includes all non-nationals and not just the relevant population, i.e. those non-nationals who are eligible for naturalisation.
There are two ways of recording age:
Age reached: number of complete years lived at the end of the calendar year in question. Under this age concept, a person born in 1951 will be 52 on each day of the calendar year 2003, irrespective of his or her birthday.
Age completed: number of completed years lived at most recent birthday.
Detailed information on the different modes of acquisition of citizenship in force in different countries can be found at the GLOBALCIT website.
The category recognised non-citizen is particularly relevant in the Baltic States.
Context
Within the European Commission, the Directorate-General for Migration and Home Affairs is responsible for European migration policy. In 2005, the European Commission relaunched the debate on the need for a common set of rules for the admission of economic migrants with a Green paper on an EU approach to managing economic migration (COM(2004) 811 final) which led to the adoption of a policy plan on legal migration (COM(2005) 669 final) at the end of 2005.
In July 2006, the European Commission adopted a Communication on policy priorities in the fight against illegal immigration of third-country nationals (COM(2006) 402 final), which aims to strike a balance between security and an individuals' basic rights during all stages of the illegal immigration process.
In September 2007, the European Commission presented its third annual report on migration and integration (COM(2007) 512 final).
A European Commission Communication adopted in October 2008 emphasised the importance of strengthening the global approach to migration: increasing coordination, coherence and synergies (COM(2008) 611 final) as an aspect of external and development policy. The Stockholm programme, adopted by EU heads of state and government in December 2009, set a framework and series of principles for the ongoing development of European policies on justice and home affairs for the period 2010 to 2014; migration-related issues are a central part of this programme. In order to bring about the changes agreed upon, the European Commission enacted an action plan implementing the Stockholm programme – delivering an area of freedom, security and justice for Europe's citizens (COM(2010) 171 final) in 2010.
In May 2013, the European Commission published the 'EU Citizenship Report 2013' (COM(2013) 269 final). The report noted that EU citizenship brings new rights and opportunities. Moving and living freely within the EU is the right most closely associated with EU citizenship. Given modern technology and the fact that it is now easier to travel, freedom of movement allows Europeans to expand their horizons beyond national borders, to leave their country for shorter or longer periods, to come and go between EU countries to work, study and train, to travel for business or for leisure, or to shop across borders. Free movement potentially increases social and cultural interactions within the EU and closer bonds between EU citizens. In addition, it may generate mutual economic benefits for businesses and consumers, including those who remain at home, as internal obstacles are steadily removed.
The European Commission presented a European Agenda on Migration (COM(2015) 240 final) outlining immediate measures to be taken in order to respond to the crisis situation in the Mediterranean as well as steps to be taken in the coming years to better manage migration in all its aspects on 13 May 2015. The European migration network started publishing in 2016 annual reports on migration. They provide an overview of the main legal and policy developments taking place across the EU as a whole and within participating countries. They are comprehensive documents and cover all aspects of migration and asylum policy by the Directorate-General for Migration and Home Affairs and EU agencies.
On 15 November 2017, the updated European Agenda on Migration focused on the refugee crisis, a common visa policy, and Schengen. Matters included resettlements and relocations, financial support to Greece and Italy, and facilities for refugees. Objectives included enabling refugees to reach Europe through legal and safe pathways, ensuring that relocation responsibility is shared fairly between Member States, integrating migrants at local and regional levels.
On 4 December 2018, the Commission published a progress report on the implementation of the European Agenda on Migration, examining progress made and shortcomings in the implementation of the European Agenda on Migration. Focusing on how climate change, demography and economic factors create new reasons pushing people to move, it confirmed that the drivers behind migratory pressure on Europe were structural, thus making it all the more essential to deal with the matter efficiently and uniformly.
On 16 October 2019, the Commission published a progress report on the implementation of the European Agenda on Migration, focusing on key steps required on the Mediterranean routes in particular, as well as actions to consolidate the EU's toolbox on migration, borders and asylum.
On 23 September 2020, the Commission presented a New Pact on Migration and Asylum, setting out a fairer, more European approach to managing migration and asylum. It aims to put in place a comprehensive and sustainable policy, providing a humane and effective long-term response to the current challenges of irregular migration, developing legal migration pathways, better integrating refugees and other newcomers, and deepening migration partnerships with countries of origin and transit for mutual benefit. In December 2023, the European Parliament and the Council reached political agreement on the New Pact on Migration and Asylum.
Direct access to
- International migration, citizenship (migr_cit)
- Population (t_demo_pop)
- Acquisition and loss of citizenship (migr_acqn)
- Residents who acquired citizenship as a share of residents non-citizens by former citizenship and sex(%) (migr_acqs)
- Acquisition of citizenship by sex, age group and former citizenship (migr_acq)
- Acquisition of citizenship by sex, age group and level of human development of former citizenship (migr_acq1ctz)
- Loss of citizenship by sex and new citizenship (migr_lct)
- Immigration (migr_immi)
- Immigration by age and sex (migr_imm8)
- Immigration by five year age group, sex, and citizenship (migr_imm1ctz)
- Immigration by five year age group, sex and country of birth (migr_imm3ctb)
- Immigration by age , sex and broad group of citizenship (migr_imm2ctz)
- Immigration by age, sex and broad group of country of birth (migr_imm4ctb)
- Immigration by sex, citizenship and broad group of country of birth (migr_imm6ctz)
- Immigration by sex, country of birth and broad group of citizenship (migr_imm7ctb)
- Immigration by five year age group, sex, and country of previous residence (migr_imm5prv)
- Immigration by age group, sex and level of human development of the country of citizenship (migr_imm9ctz)
- Immigration by age group, sex and level of human development of the country of birth (migr_imm10ctb)
- Immigration by age group, sex and level of human development of the country of previous residence (migr_imm11prv)
- Immigration by broad group of country of previous residence (migr_imm12prv)
- Emigration (migr_emi)
- Emigration by age and sex (migr_emi2)
- Emigration by five year age group, sex and citizenship (migr_emi1ctz)
- Emigration by five year age group, sex and country of birth (migr_emi4ctb)
- Emigration by five year age group, sex, and country of next usual residence (migr_emi3nxt)
- Emigration by broad group of country of next usual residence (migr_emi5nxt)
- Population (demo_pop)
- Population on 1 January by age, sex and broad group of citizenship (migr_pop2ctz)
- Population on 1 January by age group, sex and citizenship (migr_pop1ctz)
- Population on 1 January by age group, sex and country of birth (migr_pop3ctb)
- Population on 1 January by age, sex and broad group of country of birth (migr_pop4ctb)
- Population on 1 January by sex, citizenship and broad group of country of birth (migr_pop5ctz)
- Population on 1 January by sex, country of birth and broad group of citizenship (migr_pop6ctb)
- Population on 1 January by age group, sex and level of human development of the country of citizenship (migr_pop7ctz)
- Population on 1 January by age group, sex and level of human development of the country of birth (migr_pop8ctb)
- EU and EFTA citizens who are usual residents in another EU/EFTA country as of 1 January (migr_pop9ctz)
- Methodology: international migration, citizenship
- Acquisition and loss of citizenship (ESMS metadata file — migr_acqn_esms)
- Population (ESMS metadata file — demo_pop_esms)
- International migration statistics (ESMS metadata file — migr_immi_esms)
- Legislation: international migration, citizenship
- Article 20 Treaty on the Functioning of the European Union Union law on EU citizens;
- Article 21 Treaty on the Functioning of the European Union on EU citizens;
- Article 79 Treaty on the Functioning of the European Union on border checks, asylum and immigration for third country nationals;
- Directive 2003/09/EC on reception conditions for asylum seekers; (Summary)
- Directive 2003/86/EC on the right to family reunification; (Summary)
- Directive 2003/109/EC on a long-term resident status for non-member nationals; (Summary)
- Directive 2003/110/EC on assistance in cases of transit for the purposes of removal by air;
- Directive 2004/38/EC on the right of citizens of the Union and their family members to move and reside freely within the territory of the Member States; (Summary)
- Directive 2004/81/EC on victims of trafficking; (Summary)
- Directive 2004/82/EC on the obligation of carriers to communicate passenger data; (Summary)
- Directive 2004/83/EC on qualification; (Summary)
- Directive 2004/114/EC on the admission of students; (Summary)
- Directive 2005/71/EC for the facilitation of the admission of researchers into the EU; (Summary)
- Directive 2008/115/EC for returning illegally staying third-country nationals; (Summary)
- Directive 2009/50/EC concerning the admission of highly skilled migrants. (Summary)
- Directive 2009/52/EC concerning employer sanctions; (Summary)
- Directive 2011/95/EC on standards for the qualification of third-country nationals or stateless persons as beneficiaries of international protection, for a uniform status of refugees eligible for subsidiary protection, and for the content for the protection granted; (Summary)
- Directive 2011/98/EU on single application procedure for a single permit for third-country nationals to reside and work in the territory of a Member State and on a common set of rights for third-country workers legally residing in a Member State; (Summary)
- Directive 2013/32/EU on common procedures for granting and withdrawing international protection; (Summary)
- Directive 2013/33/EU on standards for the reception of applicants for international protection; (Summary)
- Directive 2014/36/EU on seasonal workers; (Summary)
- Directive 2014/54/EU on freedom of movement of workers; (Summary)
- Directive 2014/66/EU on intra-corporate transferees; (Summary)
- Directive 2014/67/EU on posted workers;
- Directive 2016/801/EU on students and researchers; (Summary)
Legislative documents - New pact on Migration and Asylum
- Knowledge Centre on Migration and Demography
- European Commission — Migration and Home Affairs
- New Pact on Migration and Asylum
- Frontex
- Irregular migration and return
- Common European Asylum System
- European Union Agency for Asylum
- Legal migration and integration
- Global Citizenship Observatory (GLOBALCIT)
- European Web Site on Integration
- OECD — International migration
- Human Development Index - United Nations Development Programme
