Trafficking in human beings statistics
Data extracted in January 2024
Planned article update: January 2025
Highlights
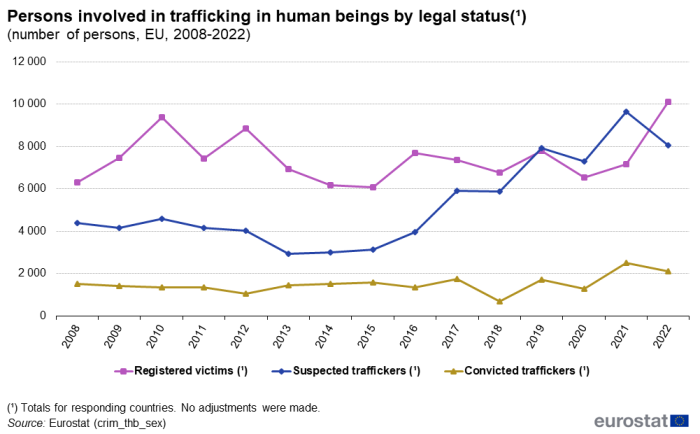
In 2022, there were 10 093 registered victims of trafficking in human beings in the EU and 2 097 convicted traffickers.
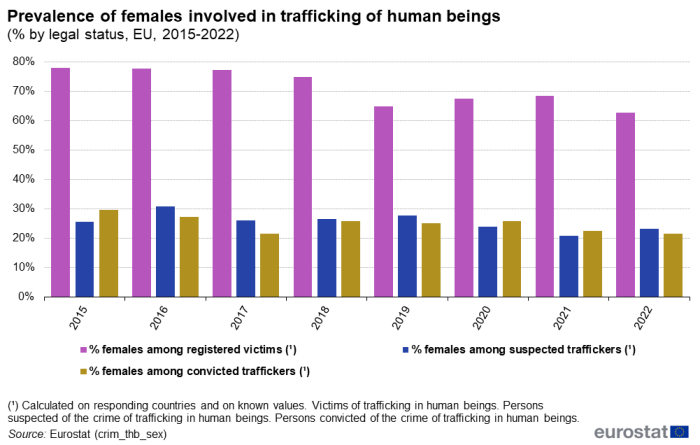
In 2022, 63 % of registered victims of trafficking were female while only 22 % of convicted traffickers were female.
In 2022, 37 % of registered victims of trafficking in the EU were citizens of Member States.
The statistics presented in this article are based on official figures for persons involved (registered victims[1], suspected traffickers[2] and convicted traffickers[3]) in trafficking in human beings in the European Union (EU) between 2008 and 2022. Directive 2011/36/EU on preventing and combating trafficking in human beings and protecting its victims (Anti-trafficking Directive) lays down, in Articles 19 and 20, requirements for EU Member States to gather and report on statistics on trafficking in human beings. Eurostat has been collecting and making available EU-wide data since 2008. This data collection has been carried out as a coordinated effort between the national rapporteurs and/or equivalent mechanisms for reporting statistics on trafficking in human beings and the European Commission (Eurostat). The data are unadjusted and published as they are reported by EU Member States.
Trafficking in human beings, as defined in Article 2 of the Directive 2011/36/EU, is a grave violation of human rights, a crime against the person, the goal of which is the exploitation of the person. Trafficking does not require the crossing of borders and can have many exploitative purposes.
Full article
Number of registered victims and of suspected and convicted traffickers
Figure 1 shows the number of persons involved in trafficking in human beings by legal status (registered victims, suspected and convicted traffickers). Registered victims include persons who have been identified by the relevant formal authority or by other national and non-national authorities. In 2022, the number of registered victims of trafficking in human beings in the EU was 10 093, reflecting an increase of 41.1 % compared with the previous year and the highest recorded value in the period 2008-2022[4]. In 2022, 18 out of 27 Member States reported an increase in the number of registered victims. Several countries explained the increase in reported data by the increasing attention of the authorities and agencies that fight against trafficking in human beings. The largest increases in absolute terms occurred in Germany, where there was an important case in the field of forced labour exploitation and in Italy, where the source of victims' data changed to the protection system (as noted by the National Rapporteur) rather than to police data, thus also including victims who were not intercepted by the police. In 2022, the number of suspected traffickers was 8 064, compared with 9 647 in 2021[5], a decrease of 16.4 %. In 2022, the number of convicted traffickers was 2 097, compared with 2 517 in 2021[6], a decrease of 16.7 %. 14 out of 26 Member States that provided data on the number of people convicted of trafficking in human beings recorded a decrease compared with the previous year. The figures for suspected and convicted traffickers reached their highest values in 2021 for the period 2008-2022. However, the number of people both suspected and convicted of trafficking in human beings decreased in 2022. Furthermore, the number of convicted persons remained far lower than the number of those suspected of trafficking in human beings. As some EU Member States had not reported data for some years, the trend observed should be interpreted with caution.
Source: Eurostat (crim_thb_sex)
63 % of registered victims of trafficking are women or girls
As shown in Figure 2, in 2022, 62.8 % of registered victims of trafficking in human beings in the EU were women or girls. The share of women and girls decreased from the previous year (68.5 % in 2021) and reached the lowest values in the 2008-2022 period. The proportion of women among the traffickers is much lower compared with the proportion of men. In 2022, among the suspected traffickers, 23.2 % were women (20.8 % in 2021) and 21.6 % of those convicted were women (22.6 % in 2021).
Source: Eurostat (crim_thb_sex)
23 registered victims of trafficking per one million inhabitants
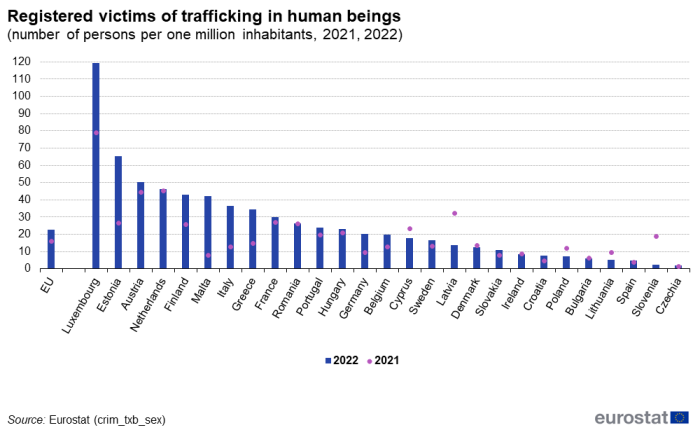
As shown in Figure 3, in 2022, there were 23 registered victims of trafficking in human beings per one million inhabitants in the EU, compared with 16 in 2021. In 2022, the highest rates in the EU were observed in Luxembourg (119), Estonia (65), Austria (50) the Netherlands (46), Finland (43), Malta (42), Italy (36), Greece (34), France (30), Romania (26), Portugal (24) and Hungary (23). The lowest rates were observed in Czechia and Slovenia (2), and Spain and Lithuania (5). The higher rates could be linked to a greater capacity of the judiciary and social system to identify victims, as it is the case for Luxembourg since 2021 where a proactive attitude of labour inspectors who participated in mandatory training courses on human trafficking led to the identification of more victims.
Source: Eurostat (crim_thb_sex)
One out of four of registered victims is a citizen of the reporting country
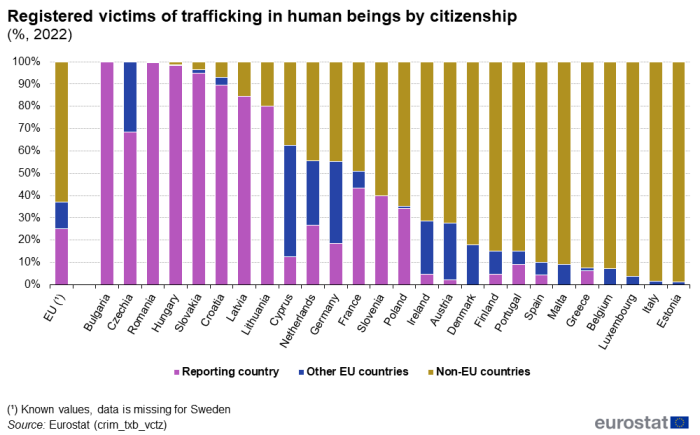
In 2022, for the EU as a whole, 25.1 % of registered victims came from the reporting country while 11.8 % were from other EU countries and 63.1 % from non-EU countries (Figure 4)[7]. As the crime of trafficking does not require the crossing of borders, victims with the citizenship of the reporting country can return from abroad or be exploited in their own country. The victims' citizenship varies considerably across the EU. Bulgaria, Romania, Hungary, Slovakia, Croatia, Latvia, Lithuania, and Czechia reported a majority of victims from their own countries, while more than 80 % of registered victims in Denmark, Finland, Portugal, Spain, Malta, Greece, Belgium, Luxembourg, Italy and Estonia came from non-EU countries.
Source: Eurostat (crim_thb_vctz)
The prevalence of labour exploitation is almost equal that of sexual exploitation
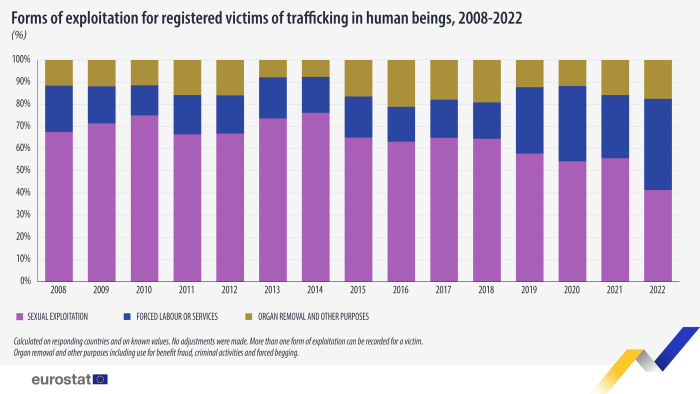
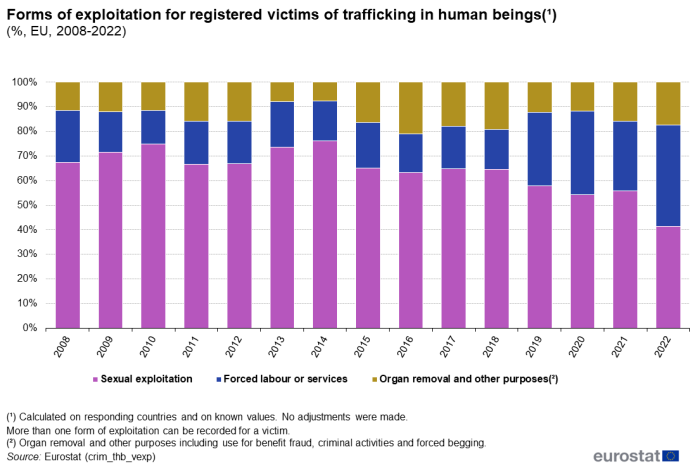
As shown in Figure 5, sexual exploitation was still the predominant form of exploitation in 2022, at 41.4 %, although the prevalence is the lowest in the 2008-2022 period. Meanwhile, exploitation by forced labour and services reached the highest prevalence in 2022, at 41.1 %. Organ removal and other exploitative purposes, including use for benefit fraud, criminal activities and forced begging, stood at 17.5 % in 2022[8].
Source: Eurostat (crim_thb_vexp)
Source data for tables and graphs
Data sources
Statistics on crime and criminal justice systems in general
Data sources include police and other law enforcement agencies, public prosecutors, law courts, prisons, relevant ministries and statistical offices. The national authorities are responsible for official figures that are sent to Eurostat and the United Nations Office on Drugs and Crime (UNODC). The number of persons reported as being involved in trafficking in human beings can vary widely across the EU, even relative to population size. This can be due to different approaches to reporting data in police, prosecutors and court systems, to different levels of transposition of the Directive across the EU Member States and different criminal justice responses to trafficking in human beings.
The data of this article
This article presents results based on official figures provided by national statistical offices and National Rapporteur or Equivalent Mechanisms on persons involved in trafficking in human beings from 2008 onwards. Non-governmental agencies, labour inspectors, social services, border guards, immigration services and other institutions are involved in reporting the number of victims according to national protocols for the detection of victims. The web database contains figures as reported (no adjustment). The totals for the EU include only countries which report the data. No adjustments or estimations are made for non-responding countries.
The crimes are classified in accordance with the ICCS (International Classification of Crime for Statistical Purposes)[9]. The Crime and criminal justice statistics – Methodological guide for users provides the methodological reference. Countries' compliance with counting methodologies is explained in the general and countries metadata. National sources and compliance with statistical definitions are explained in the trafficking in human beings metadata.
Context
Crime statistics are used by EU institutions, national authorities, media, politicians, organisations and the general public. Each state establishes its own criminal laws, defines crimes, legal proceedings and justice reactions, as well as specifications for official crime statistics (except for crimes covered by international or EU law). Typically, comparing crime statistics between countries is challenging due to different national criminal laws and different criminal justice systems.
However, it could also be argued that there are many similarities between European countries. This, combined with public and political interest, was the background for developing EU-wide crime statistics. Over the last decade, EU institutions, national authorities and the UN have cooperated to improve European crime statistics. A major quality improvement is to use a common classification of crimes.
Official crime statistics mainly reflect how the authorities register and handle cases. The figures are provided by national authorities such as the police, prosecutors, courts and prisons. Of those, police figures give the broadest picture, as they include recorded offences - whether or not they led to prosecution. Still, the police records do not measure the total occurrence of crime. Simply put, the total occurrence would be the reported crimes plus the unreported crimes, minus the incorrectly reported crimes.
Direct access to
See also
Database
Publications
Trafficking in human beings (2013 edition)
Trafficking in human beings (2015 edition)
Data collection on trafficking in human beings in the EU (2018 edition)
Data collection on trafficking in human beings in the EU (2020 edition)
Legislation
Notes
- ↑ Victims of trafficking in human beings.
- ↑ Persons suspected of the crime of trafficking in human beings.
- ↑ Persons convicted of the crime of trafficking in human beings.
- ↑ All EU Member States provided data for both years.
- ↑ For suspected persons, Belgium provided data in 2022 but not in 2021, while Estonia didn't provide it for both years.
- ↑ For convicted persons, Belgium didn't provide data for both years.
- ↑ Prevalence is calculated based on known values.
- ↑ Prevalence is calculated on known values. More than one form of exploitation can be recorded for a victim.
- ↑ See Monitoring EU crime policies using the International Classification of Crime for Statistical Purposes (ICCS) on the correspondence between the EU Directive and the ICCS.
