Migrant integration statistics - health
Data extracted on 10 October 2024
Planned article update: November 2025
Highlights
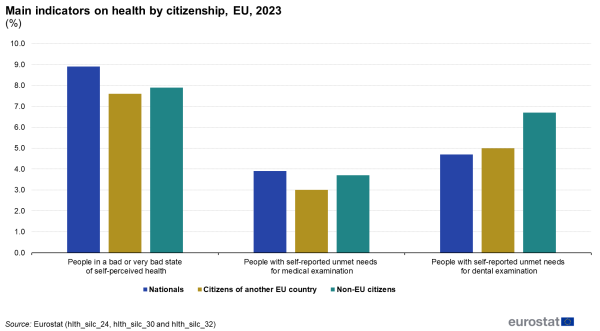
This article presents an overview of the self-reported health status of non-nationals and compares it with the self-reported health status of nationals. The first part of the article focuses on self-perceived health – one of the indicators included in the Zaragoza declaration [1] – and gives an overall assessment by respondents of their health in general. The second indicator – information on self-reported unmet medical examination or treatment needs – is also analysed, along with the information on self-reported unmet dental examination or treatment needs [2]. The information presented in the article refers to people aged 16 years and over. Non-nationals are EU citizens living in an EU country other than their country of citizenship and non-EU citizens living in the EU. Nationals are EU citizens living in their country of citizenship. Note that the analysis in the text is made only for countries with reliable data, while the graphs present countries with both reliable data and data with limited reliability. This article forms part of the online publication on migrant integration statistics.
Full article
Key findings
Limited access to healthcare, unhealthy living environments, and socioeconomic deprivation can impede individuals from achieving and maintaining a good standard of health. In the EU in 2023:
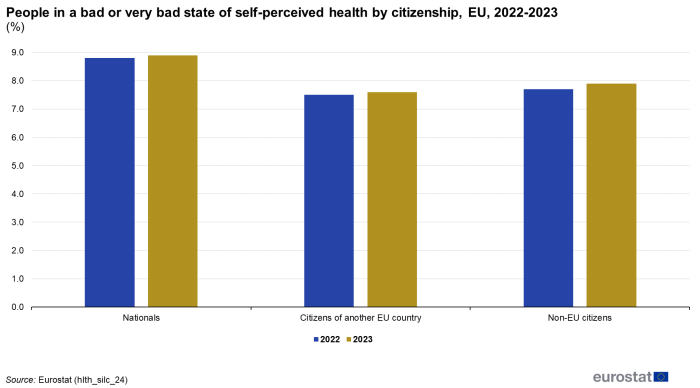
- Self-perceived bad or very bad health increased slightly for all groups from 2022 to 2023: nationals (from 8.8% to 8.9%), EU citizens in another EU country (from 7.5% to 7.6%), and non-EU citizens (from 7.7% to 7.9%).
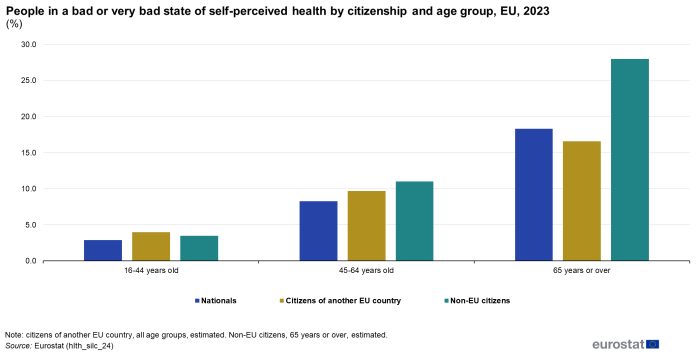
- For all age groups (16-44, 45-64, and 65+), non-EU citizens reported higher percentages of bad or very bad self-perceived health compared with nationals. Citizens of another EU country showed the lowest percentage in the 65+ age group and the highest in the 16-44 years age group.
- Women reported a higher share of bad or very bad health than men among both nationals (9.8% vs 8.0%) and non-EU citizens (8.5% vs 7.3%), while men reported worse health compared with women among citizens of another EU country (7.8% vs 7.4%).
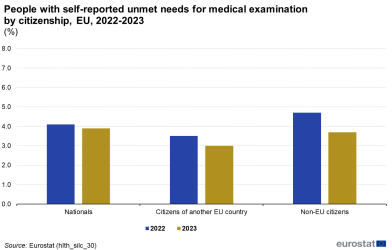
- There was a general fall in unmet medical examination or treatment needs compared with the previous year. Nationals reported a slight decrease (from 4.1% to 3.9%), while citizens of another EU country reported a fall from 3.5% to 3.0%. Non-EU citizens experienced the largest drop, from 4.7% in 2022 to 3.7% in 2023.
- Women reported higher unmet medical needs than men across all groups, particularly among nationals (4.4% vs 3.4%).
- Non-EU citizens reported the highest unmet dental examination or treatment needs (6.7%), although all groups showed a decrease in 2023 compared with 2022.
Self-perceived health
Self-perceived health is surveyed through a question about how a person perceives their health in general, using one of the following answer categories: very good, good, fair, bad or very bad. It refers to a person's health in general rather than their present (perhaps temporary) state of health and concerns physical, social and emotional functions and biomedical signs and symptoms. The analyses represented by Figures 1-4 below focus on the aggregated category bad/very bad.
(%)
Source: Eurostat (hlth_silc_24)
Figure 1 shows the percentage of people in a bad or very bad state of self-perceived health by citizenship for the years 2022 and 2023. In 2023, 8.9% of nationals reported being in bad or very bad health, a slight increase from the previous year (8.8%). Citizens of another EU country showed a similar trend, with 7.6% indicating poor health, up from 7.5% in 2022. Non-EU citizens experienced a rise as well, with 7.9% reporting bad health, compared with 7.7% in 2022. The differences in levels of bad or very bad self-perceived health among the 3 population subgroups are affected by their varying age structures: nationals are likely to have an older age distribution, which can contribute to higher rates of bad or very bad state of self-perceived health. By contrast, non-nationals tend to be younger on average, which may explain their comparatively lower percentages in the same category. For this reason, a proper comparison between nationals and non-nationals must account for age as a factor.
Figure 2 presents an analysis by age, showing that non-EU citizens reported higher levels of self-perceived bad or very bad health across all age groups compared with nationals. This difference is particularly pronounced in the 65+ age group (28.0% for non-EU citizens and 18.3% for nationals). Citizens of another EU country showed the lowest percentage in the 65+ age group (16.6%) and the highest in the 16-44 years age group (4.0%).
Source: Eurostat (hlth_silc_24)
Figure 3 shows that differences between women and men in health perceptions vary across groups of population, with women exhibiting worse health perceptions among nationals (9.8% versus 8.0%) and non-EU citizens (8.5% compared with 7.3%), while men have poorer perceptions among citizens of another EU country (7.8% compared with 7.4%).

Source: Eurostat (hlth_silc_24)
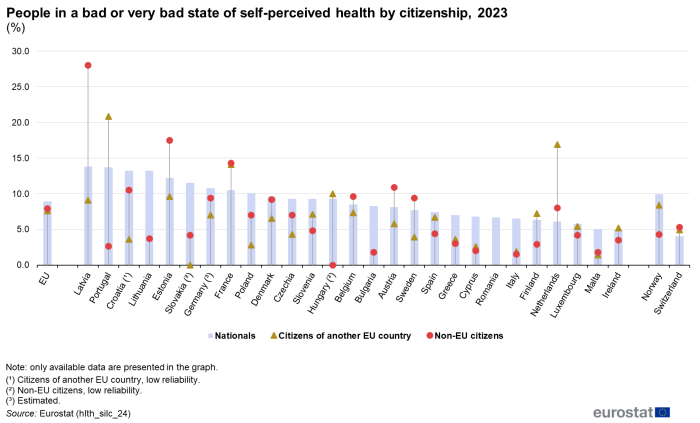
The analysis of self-perceived health reveals significant variations among nationals, citizens of another EU country, and non-EU citizens across different countries (Figure 4).
For nationals, Latvia had the highest percentage of bad or very bad self-perceived health at 13.8%, followed closely by Portugal at 13.7%, while Ireland (4.9%) and Malta (5.0%) reported much lower figures. Among citizens of another EU country, Portugal stood out with 20.8% perceiving their health as bad or very bad, significantly higher than in other EU countries. This may be attributed to the older age structure of this subgroup, as Portugal is a popular destination for some EU citizens for retirement. The Netherlands (16.9%) and France (14.1%) also reflected a high share of bad or very bad self-perceived health. By contrast, Malta (1.4%) and Italy (1.9%) showed much lower percentages.
Source: Eurostat (hlth_silc_24)
Lastly, for non-EU citizens, Latvia had the highest rate at 28.0%, likely due to the significant number of recognised non-citizens (mainly former Soviet Union citizens, who are permanently resident in the country but have not acquired any other citizenship) with an older age structure compared with non-EU citizens in other countries. Estonia (17.5%) and France (14.3%) also reported higher percentages, while Italy (1.5%), Bulgaria and Malta (1.8% each) had much lower rates.
Unmet medical and dental examination or treatment needs
Nationals reported a slight decline in unmet medical examination or treatment needs, from 4.1% in 2022 to 3.9% in 2023 (Figure 5a). Citizens of other EU countries showed a more notable decrease, from 3.5% to 3.0%. The largest drop was seen among non-EU citizens, with unmet needs falling from 4.7% to 3.7%. All 3 population subgroups also showed a decrease in unmet dental needs (Figure 5b). Nationals reported a slight decline in unmet dental needs from 4.8% in 2022 to 4.7% in 2023. Citizens of other EU countries showed a small decrease, from 5.2% to 5.0%. Non-EU citizens reported the highest unmet dental examination or treatment needs, though this figure dropped from 7.2% to 6.7%.
Figure 5a: People with self-reported unmet needs for medical examination by citizenship, EU, 2022-2023
(%)
Source: Eurostat (hlth_silc_30)Figure 5b: People with self-reported unmet needs for dental examination by citizenship, EU, 2022-2023
(%)
Source: Eurostat (hlth_silc_32)
Figure 6a shows that unmet medical needs increased with age for nationals and citizens of other EU countries, peaking at 5.3% among nationals aged 65 years and over. Non-EU citizens reported the highest percentage of unmet medical needs in the age group 45-64 years (4.4%). As for the self-reported unmet needs for dental examinations, Figure 6b reveals that non-EU citizens consistently showed the highest unmet needs in all age groups, especially among those aged 65 years and over (7.7%), highlighting significant barriers to dental care as they age. Nationals and other EU citizens reported significant unmet needs primarily in the 45-64 years age group, at 5.4% and 6.8%, respectively.
Figure 6a: People with self-reported unmet needs for medical examination by age group and citizenship, EU, 2023
(%)
Source: Eurostat (hlth_silc_30)Figure 6b: People with self-reported unmet needs for dental examination by age group and citizenship, EU, 2023
(%)
Source: Eurostat (hlth_silc_32)
In Figure 7a, which covers unmet needs for medical examinations by sex, women consistently reported higher unmet needs than men across all citizenship groups. For nationals, 4.4% of women reported unmet needs compared with 3.4% of men. Among citizens of other EU countries, 3.4% of women reported unmet needs, while for men, it is 2.7%. Non-EU citizens followed the same pattern, with 3.9% of women reporting unmet needs compared with 3.4% of men. In Figure 7b, which focuses on unmet needs for dental examinations, the gender gap remains for nationals (4.9% of women to 4.5% of men) and non-EU citizens (6.9% compared with 6.6%). Citizens of other EU countries showed no difference, with both men and women reporting 5.0%.
Figure 7a: People with self-reported unmet needs for medical examination by sex and citizenship, 2023
(%)
Source: Eurostat (hlth_silc_30)Figure 7b: People with self-reported unmet needs for dental examination by sex and citizenship, 2023
(%)
Source: Eurostat (hlth_silc_32)
Table 1 provides data on the share of people aged 16 years and over self-reporting unmet needs for medical and dental examinations or treatment in 2023, broken down by citizenship. For medical examination or treatment, across the EU, 3.9% of nationals reported unmet needs, compared with 3.0% of citizens from other EU countries and 3.7% of non-EU citizens. The countries with the highest share of unmet medical needs among nationals were Estonia (14.6%) and Greece (13.5%). Among non-nationals, Denmark and Estonia showed the highest percentages for both citizens from other EU countries (13.3% and 21.7%, respectively) and non-EU citizens (20.1% and 18.7%, respectively). For dental examination or treatment, the share of unmet needs was higher across the EU: 4.7% of nationals reported unmet needs, compared with 5.0% for citizens from other EU countries and 6.7% for non-EU citizens. Greece and Denmark had the highest unmet dental needs for nationals, with 14.8% and 12.5% respectively. Finland and Portugal had the highest unmet dental needs for citizens of another EU country (above 20%), while Denmark (26.7%) and Latvia (18.8%) reported the highest rates for non-EU citizens.

(%)
Source: Eurostat (hlth_silc_30) and (hlth_silc_32)
Source data for tables and graphs
Data sources
The data used in the article concerning self-perceived health and unmet needs for health care are derived from EU statistics on income and living conditions (EU-SILC). This source is documented in more detail in this background article which provides information on the scope of the data, its legal basis, the methodology employed, as well as related concepts and definitions.
Data refer to the population aged 16 years and over.
The indicators presented in this article are derived from self-reported data so they are, to a certain extent, affected by respondents' subjective perception as well as by their social and cultural background. Despite their subjective nature, the statistics that are presented are relevant and reliable estimators of the health status of populations as well as good predictors of health care needs; they are useful for trend analysis and for measuring socioeconomic disparities.
EU-SILC does not cover the institutionalised population, for example, people living in health and social care institutions whose health status is likely to be worse than that of the population living in private households. It is therefore likely that, to some degree, both data sources under-estimate health problems. Another factor that may influence the results shown is the different organisation of health care services, be that nationally or locally. Furthermore, the indicators presented are not age-standardised and thus reflect the current national age structures. Finally, the implementation of EU-SILC was organised nationally, which may impact on the results presented, for example, due to differences in the formulation of questions or their precise coverage.
Note on tables
When 0 with decimal places is displayed, values are not significant.
Context
Good health is an asset. It is not only of value to the individual as a major determinant of quality of life, well-being and social participation, but it also contributes to general social and economic growth. Many factors influence the health status of a population and these can be addressed by health and other policies regionally, nationally or across the EU.
Indicators on health status are given high importance in EU health policies. The monitoring of health status of populations was included in the overarching EU strategy 'Together for Health: A Strategic Approach for the EU 2008-2013' (COM(2007) 630 final) and in the more recent 'Investing in health' working document. Health status monitoring is also important for more topical policies such as active and healthy ageing, health inequalities and social protection and social inclusion.
Moreover, the EU's active inclusion strategy aims to ensure that every citizen, including the most disadvantaged, may fully participate in society, through the provision of adequate income support, inclusive labour markets and access to quality services, including healthcare. Since the signature of the Treaty of Lisbon in 2007, European institutions have the mandate to 'provide incentives and support for the action of Member States with a view to promoting the integration of third-country nationals'. In June 2016, the European Commission published an Action plan on the integration of third country nationals (COM(2016) 377 final) which set out a range of goals, providing a comprehensive framework to support EU Member States' efforts in developing and strengthening their integration policies, for example, in the fields of education, employment and vocational training, access to basic services such as housing and healthcare, as well as active participation and social inclusion. The latter includes initiatives, among others, to promote the use of EU funds for: intercultural dialogue, cultural diversity and common values; active participation of third country nationals in political, social and cultural life; activities dedicated to ensuring the integration of refugees and asylum seekers; preventing and combating discrimination, racism and xenophobia.
Building on progress made since 2016, a new pact on migration and asylum was presented by the European Commission in September 2020. This sought to provide new tools for faster and more integrated procedures, a better management of Schengen and borders, as well as flexibility and crisis resilience. The new pact on migration and asylum, sets out a fairer, more European approach to managing migration and asylum. It aims to put in place a comprehensive and sustainable policy, providing a humane and effective long-term response to the current challenges of irregular migration, developing legal migration pathways, better integrating refugees and other newcomers, and deepening migration partnerships with countries of origin and transit for mutual benefit.
In November 2020, the action plan on integration and inclusion 2021-2027 (COM(2016) 377 final) was adopted. It seeks to detail targeted and tailored support to reflect the individual characteristics that may present specific challenges to people with a migrant background, such as gender or religious background.
Direct access to
- Health (mii_health)
- Health status (mii_hlth_state)
- Health determinants (mii_hlth_det)
- Health care (mii_hlth_care)
- Legal migration and integration
- New pact on migration and asylum
- European Commission — study on active inclusion of migrants, IZA and ESRI, 2011
- European Commission — the 2010 Zaragoza declaration
- European Commission — Using EU Indicators of Immigrant Integration — final report of the European Services Network (ESN) and the Migration Policy Group (MPG) (PDF)
- European Website on Integration
- ILO — labour migration
- Indicators of immigrant integration 2023 - Settling in
Notes
- ↑ A set of common indicators agreed by EU Member States. See the declaration of the European ministerial conference on integration, Zaragoza, 15-16 April 2010.
- ↑ The additional indicators, allowing for a better assessment of the health of non-nationals, have been suggested for monitoring the integration of migrants in a 2013 report titled Using EU indicators of immigrant integration.
