Population and population change statistics
Data extracted: 6 July 2024
Planned article update: July 2025
Highlights
On 1 January 2024, the population of the EU was estimated at 449.2 million inhabitants, 1 647 346 more than the previous year.
The population increased in 2023 in 20 EU countries while it decreased in seven.
Population change by component (annual crude rates), EU, 1990-2023
This article gives an overview of the development of the European Union (EU) population, detailing the two components of population change: natural population change and net migration plus statistical adjustment. More information on migration is provided in an article on migration and migrant population statistics.
The population figures for 1 January 2024 include revisions made by EU countries to take into account the results of the 2021 population census. However, figures referring to 1 January 2023 and earlier years may not yet have been subject to any post-census revisions.
Full article
EU population shows a strong increase in 2023
Following the impact of the COVID-19 pandemic, the population of the European Union increased again in 2023, from 447.6 million on 1 January 2023 to 449.2 million on 1 January 2024. The negative natural change (more deaths than births) was outnumbered by the positive net migration (plus statistical adjustment). The observed population growth can be largely attributed to the increased migratory movements post-COVID-19 and to the influx of displaced persons from Ukraine who received temporary protection status in EU countries, as a consequence of the Russian invasion in February 2022.
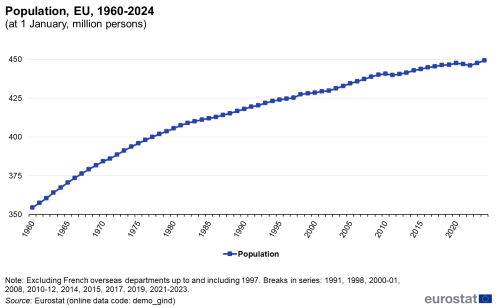
Looking at the bigger picture, the population of the EU grew from 354.5 million in 1960 to 449.2 million on 1 January 2024, an increase of 94.7 million people (Figure 1). The rate of population growth has slowed down gradually in recent decades: for example, the EU population increased, on average, by about 0.8 million persons per year during the period 2005–2023, compared with an average increase of around 3.0 million persons per year during the 1960s.
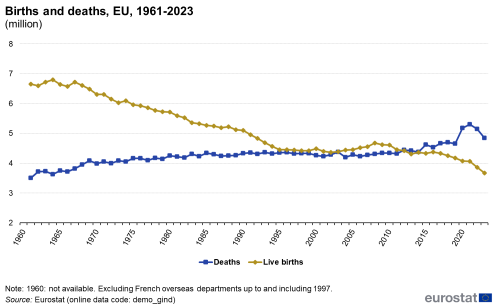
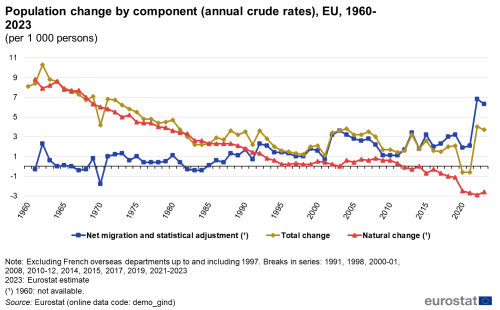
The natural change of the EU population was positive – although decreasing – until 2011, and then negative since 2012, with more deaths than births recorded in the EU (Figure 2). The total change after 2011 (positive until 2019, with 7.5 million more inhabitants between January 2012 and January 2020) is therefore due to net migration (plus statistical adjustment). While during the COVID-19 pandemic the (positive) net migration no longer compensated for the negative natural change in the EU, in 2022 and likewise in 2023, the trend was reversed and, as a consequence, the EU total population has increased.
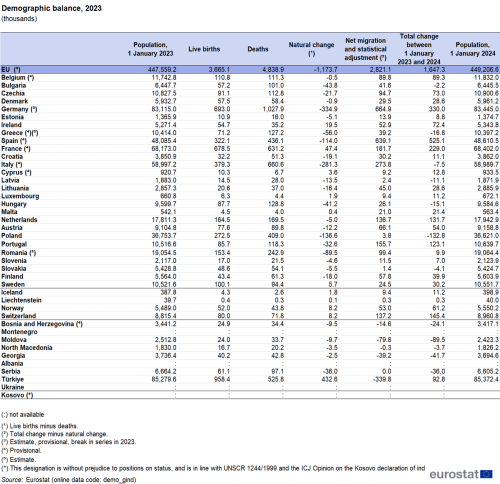
In 2023 as in previous years, the number of deaths (4.84 million) continued to outnumber those of live births (3.67 million) in the EU, resulting in the aforementioned negative natural change in the population. The total increase that was recorded in 2023 for the EU population was exclusively due to (positive) net migration (plus statistical adjustment). In short, the natural change of the EU population (-1.2 million persons) was lower than the net migration plus statistical adjustment (+2.8 million), resulting in an increase in population of almost 1.7 million. Net migration (plus statistical adjustment) increased in absolute value from +0.9 million in 2021 to +3 million in 2022 and to +2.8 million in 2023.
Net migration (plus statistical adjustment) in the EU increased considerably from the mid-1980s onwards and has been the main determinant of population growth since the 1990s (Figure 3). The number of live births decreased progressively between 1960 and 1995, while the number of deaths slowly increased. The gap between live births and deaths in the EU narrowed considerably from 1961 onwards, and the natural change of the population became negative in 2012, when the number of deaths surpassed the number of births. The number of deaths is expected to further increase because of the ageing population, and assuming that fertility rates remain at a relatively low level, the negative natural change (more deaths than births) could thus well continue. Should this be the case, the EU’s overall population decline or growth in the future is likely to depend largely on the contribution made by net migration.
(per 1 000 persons)
Source: Eurostat (demo_gind)
Population change at national level
The population of individual EU countries on 1 January 2024 ranged from 0.6 million in Malta to 83.4 million in Germany (Table 1). Germany, France and Italy together comprised almost half (47 %) of the total EU population on 1 January 2024.
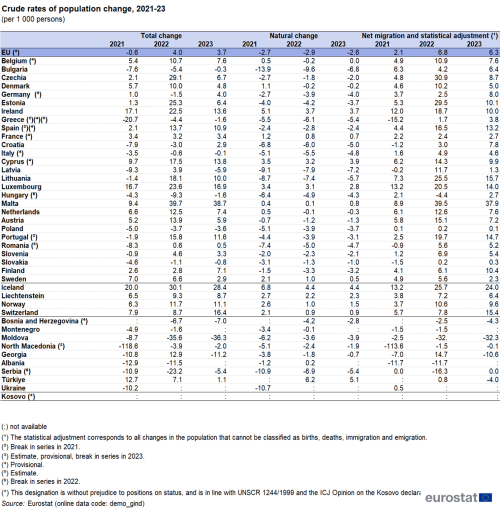
While the population of the EU as a whole slightly increased during 2023 (growth rate of 3.7 per 1 000 persons), the change was not evenly distributed across the EU countries: 20 countries observed an increase in their respective populations, while the population fell in 7 countries. Malta (38.7 per 1000 persons), Luxembourg (16.9), Cyprus (13.8) and Ireland (13.6) recorded the highest population growth rates in 2023, while Latvia (-5.9) Poland (-3.6), Hungary and Greece (both -1.6) recorded the highest decreases (Table 2).
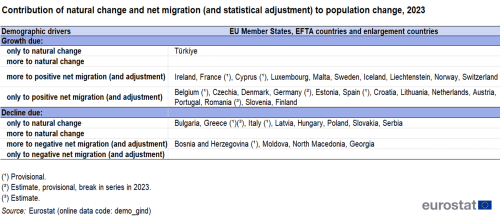
Population change can happen in two ways: either by natural change or by net migration. Eight types of population change can be identified, distinguishing growth or decline and the relative weights of natural change and net migration (plus statistical adjustment) — see Table 3 for the full typology.
Looking at the national data during 2023, seven EU countries (Croatia, Ireland, Cyprus, Luxembourg, France, Sweden and Malta) showed a positive natural increase of population. A total of 20 EU countries had negative rates of natural change, with deaths outnumbering births; the largest negative rates of natural change being seen in Latvia (-7.2 per 1 000 persons), followed by Bulgaria (-6.8) and Lithuania (-5.7).
All EU countries had positive rates of net migration (plus statistical adjustment) in 2023, with the highest rates being observed in Malta (37.9 per 1 000 persons), Lithuania (15.7) Portugal (14.7) and Luxembourg (14.0).
Source: Eurostat (demo_gind)
Among the 20 EU countries where the population increased in 2023, seven countries (Ireland, France, Croatia, Cyprus, Luxembourg, Malta and Sweden) recorded both a natural increase and positive net migration (plus statistical adjustment) contributing to their population growth. In 13 countries (Belgium, Czechia, Denmark, Germany, Estonia, Spain, Lithuania, Netherlands, Austria, Portugal, Romania, Slovenia and Finland), positive net migration (plus statistical adjustment) was the driver of population growth, as natural population change was negative.
Of the 7 EU countries that reported a fall in population during 2023 (Bulgaria, Greece, Italy, Latvia, Hungary, Poland and Slovakia) the effect of positive net migration (plus statistical adjustment) was not sufficient to compensate for the negative natural change.
Source data for tables and graphs
![]() Population and population change statistics: tables and figures
Population and population change statistics: tables and figures
Data sources
The demographic balance provides an overview of annual demographic developments in the EU countries; statistics on population change are available in absolute figures and as crude rates. The “crude rate of population growth” is the ratio of total population growth during the year to the average population of the area in question that year. The value is expressed per 1 000 persons (see Population glossary). Population change — or population growth — in a given year is the difference between the population size on 1 January of the given year and the corresponding level from 1 January of the previous year. It consists of two components: natural change and net migration. “Natural population change” is the difference between the number of live births and the number of deaths. If natural change is positive, then it is often referred to as a natural increase. “Net migration” is the difference between the number of immigrants and the number of emigrants. In the context of the annual demographic balance, Eurostat produces net migration figures by taking the difference between total population change and natural change; therefore, this concept is referred to as “net migration plus statistical adjustment”.
Eurostat collects demographic data from the National Statistical Institutes (NSIs) of the EU Member States and also from almost all non-EU Member States in Europe, including EFTA countries, candidate countries and potential candidates. The population figures transmitted by the countries can either be based on data from the most recent census adjusted by the components of population change (live births, deaths, immigration and emigration) produced since the last census, or based on population registers. The estimates of population produced using the demographic components since the last census should then be revised once the census results become available, to revise and rebase the population statistics series for the previous decade. In line with Regulation (EC) No 763/2008 and related implementing acts, Member States and EFTA countries implemented their population and housing censuses in 2021-2022. The population data for the year 2021 and after take into account the results of the latest population census (held in 2021-2022). Following Eurostat’s recommendations to ensure consistency of statistics over time, several Member States (Bulgaria, Germany, Ireland, Greece, Spain, Croatia, Italy, Cyprus, Lithuania, Hungary, Malta, Poland, Portugal) have revised or are in process of revising their population time series between the reference years of the population and housing censuses held in 2011 and 2021. The revisions are expected to be published in Eurostat's tables by end of 2024. While the processing of population revisons is ongoing, it may happen that EU aggregates are not fully syncronised with the corresponding sum of countries.
Context
Statistics on population change and the structure of population are increasingly used to support policymaking and to enable the monitoring of demographic behaviour within political, economic, social and cultural contexts. In particular, this concerns demographic developments that focus on a likely reduction in the relative importance of the working-age population and a corresponding increase in the number of older persons. These statistics may be used to support a range of different analyses, including studies relating to population ageing and its effects on the sustainability of public finance and welfare, the evaluation of fertility as a background for family policies, or the economic and social impact of demographic change.
The EU has been going through a period of demographic and societal change. The outbreak of the COVID-19 pandemic is expected to leave a lasting impact on the way we live and work together. The outbreak came at a time when Europe had already gone through a period of profound demographic and societal change. More information on the work of the European Commission 2019-2024 to tackle the impact of demographic change in Europe can be found in the European Commission's dedicated pages.
Interesting insights can be found in Eurostat’s interactive publication Statistics on Demography of Europe, containing interactive visualisations and short texts.
Direct access to
- Population change - Demographic balance and crude rates at national level (ESMS metadata file — demo_gind_esms)
- Fertility (ESMS metadata file — demo_fer_esms)
- Mortality (ESMS metadata file — demo_mor_esms)
- Population (ESMS metadata file — demo_pop_esms)
