Archive:Healthcare expenditure statistics
Data extracted in November 2022.
Planned article update: 15 November 2023.
Highlights
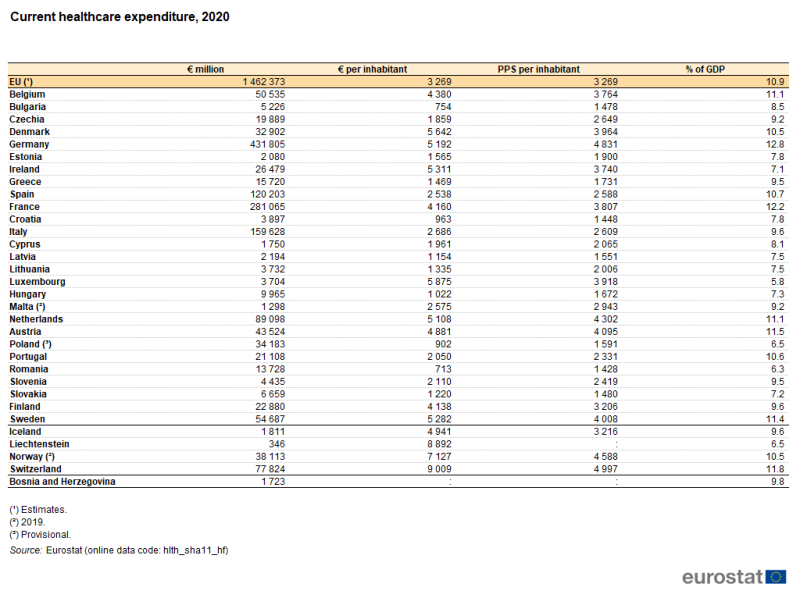
Among the EU Member States, Germany (12.8 %) and France (12.2 %) had the highest healthcare expenditure relative to GDP in 2020.
Among the EU Member States, the largest expansions (in percentage terms) in current healthcare expenditure per inhabitant between 2012 and 2020 were recorded in Romania and the Baltic Member States.
Current healthcare expenditure relative to GDP, 2020
This article presents key statistics on expenditure and financing aspects of healthcare in the European Union (EU). Healthcare systems are organised and financed in different ways across the EU Member States, but universal access to quality healthcare, at an affordable cost to both individuals and society at large, is widely regarded as a basic need. Moreover, this is one of the common values and principles of EU health systems.
Statistics on healthcare expenditure and financing may be used to evaluate how a healthcare system responds to the challenge of universal access to quality healthcare, through measuring financial resources within the healthcare sector and the allocation of these resources between healthcare activities (for example, preventive and curative care) or groups of healthcare providers (for example, hospitals and ambulatory centres).
This article forms part of an online publication on Health in the European Union.
It should be noted that data are presented in this article for 2020: for the first time therefore, this article includes data that show an impact from the COVID-19 pandemic and its related restrictions. For this reason, particular attention should be paid when comparing the 2020 data with data from earlier years. Note that the latest data for Malta and Norway are for 2019.
Full article
Healthcare expenditure
Germany and France had the highest current healthcare expenditure relative to GDP in 2020
Germany had the highest level of current healthcare expenditure among the EU Member States, valued at €432 billion in 2020. France recorded the second highest level of current healthcare expenditure (€281 billion), followed by Italy (€160 billion) and Spain (€120 billion).
Current healthcare expenditure in Germany and France was equivalent to 12.8 % and 12.2 %, respectively, of gross domestic product (GDP), more than in any other EU Member State – see Table 1. The next highest ratios were in Austria (11.5 %), Sweden (11.4 %), the Netherlands (11.1 %) and Belgium (11.1 %). Spain, Portugal and Denmark were the only other EU Member States to record double-digit ratios. Note that current healthcare expenditure in Switzerland was equivalent to 11.8 % of GDP and that Norway also had a double-digit ratio (2019 data). By contrast, current healthcare expenditure accounted for less than 7.5 % of GDP in six Member States, with Luxembourg recording the lowest ratio (5.8 %).
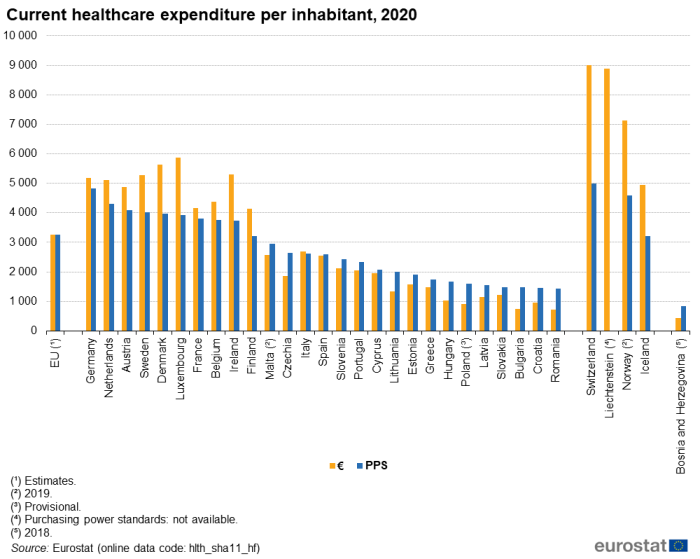
Relative to population size and in euro terms, current healthcare expenditure in 2020 was highest among the EU Member States in Luxembourg (€5 875 per inhabitant) and Denmark (€5 642 per inhabitant). It is interesting to note that Luxembourg had the highest ratio per inhabitant despite having the lowest ratio of healthcare expenditure to GDP, reflecting the high level of GDP in Luxembourg. A significant proportion of workers in Luxembourg are cross-border workers and live outside the country. Note that, as non-residents, the expenditure on their healthcare is not included in Luxembourg's health accounts while their economic activity does contribute to Luxembourg's GDP. Three of the four EFTA countries included in Table 1 – Switzerland, Liechtenstein and Norway – each reported higher levels of healthcare expenditure per inhabitant than in any of the Member States. Following on from Luxembourg and Denmark, ratios over €5 000 per inhabitant were also observed in Ireland, Sweden, Germany and the Netherlands, while in Austria the ratio was just below this level. In turn, these were followed at some distance by another group – Belgium, France and Finland – with ratios in the range of €4 138 to 4 380 per inhabitant. There was then a relatively large gap to Italy (€2 686 per inhabitant), Malta (€2 575, 2019 data) and Spain (€2 538). All of the remaining 14 EU Member States recorded average expenditure of €2 110 per inhabitant or less in 2020, with four of these recording an average spend on healthcare below €1 000 per inhabitant. The lowest levels of average expenditure per inhabitant were in Bulgaria (€754) and Romania (€713). As such, the ratio between the highest (Luxembourg) and lowest (Romania) levels of expenditure per inhabitant was 8.2 : 1.
These disparities were less apparent when expenditure is expressed in purchasing power standards (PPS). This measure adjusts for differences in price levels between the EU Member States. Germany (4 831 PPS per inhabitant), the Netherlands (4 302 PPS per inhabitant) and Austria (4 095 PPS per inhabitant) recorded the highest ratios of healthcare expenditure per inhabitant in PPS terms. Croatia (1 448 PPS per inhabitant) and Romania (1 428 PPS per inhabitant) had the lowest ratios. As such, by taking account of price level differences, the ratio between the highest (Germany) and lowest (Romania) levels of healthcare expenditure per inhabitant was considerably narrower than the equivalent ratio in euro terms mentioned above, as it was 3.4 : 1.
Developments over time
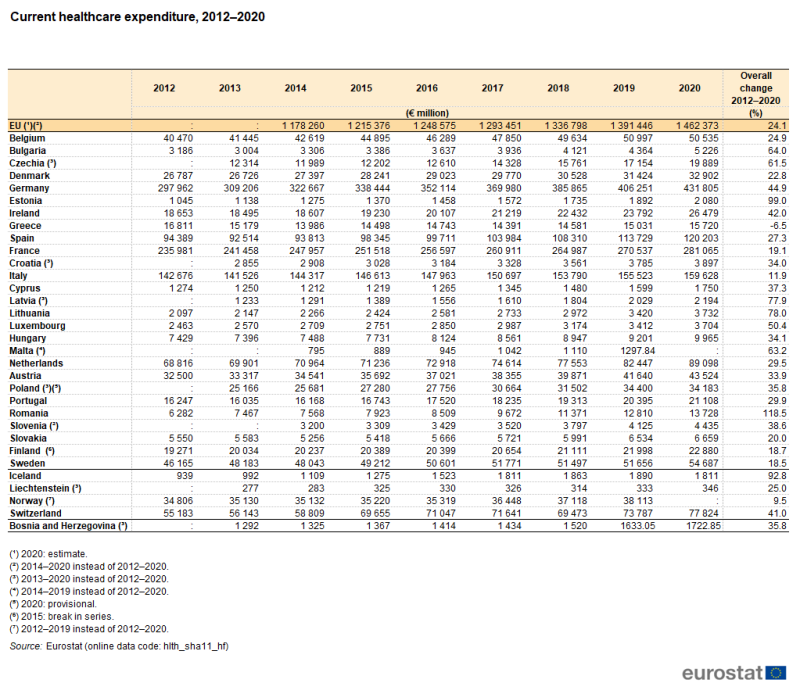
Table 2 and Figures 2 and 3 highlight the developments in the level of healthcare expenditure in recent years, focusing on a comparison between 2012 and 2020. Note that the analyses in Table 2 and Figure 2 are presented in current price terms and so reflect price changes (inflation and deflation) as well as real changes in expenditure.
Based on the data shown in Table 2 (from 2012 to 2020 for most EU Member States, but with shorter time series in some cases), all except Greece recorded higher healthcare expenditure in 2020 than in 2012. The largest overall increases were observed in Romania and Estonia, where expenditure in 2020 was 118.5 % and 99.0 %, respectively, higher than in 2012; these equated to annual average increases of 10.3 % in Romania and 9.0 % in Estonia. Lithuania, Latvia (2013–2020), Bulgaria, Malta (2014–2019), Czechia (2013–2020) and Luxembourg recorded overall increases of at least 50.0 % between 2012 and 2020.
As well as being affected by price changes, comparisons of healthcare expenditure over time can also be influenced by demographic changes. Figure 2 shows the average healthcare expenditure per inhabitant in 2012 and 2020 (see footnotes under the figure for cases where alternative years have been used). Greece was the only EU Member State where a lower level of expenditure per inhabitant was recorded in 2020 than in 2012, down 3.5 %. As with the rate of change based on overall expenditure, Romania recorded the largest increase, with average expenditure per inhabitant increasing by 127.5 %. The Baltic Member States recorded the next largest increases: Estonia up 98.0 %, Lithuania up 90.3 % and Latvia up 88.5 % (between 2013 and 2020).
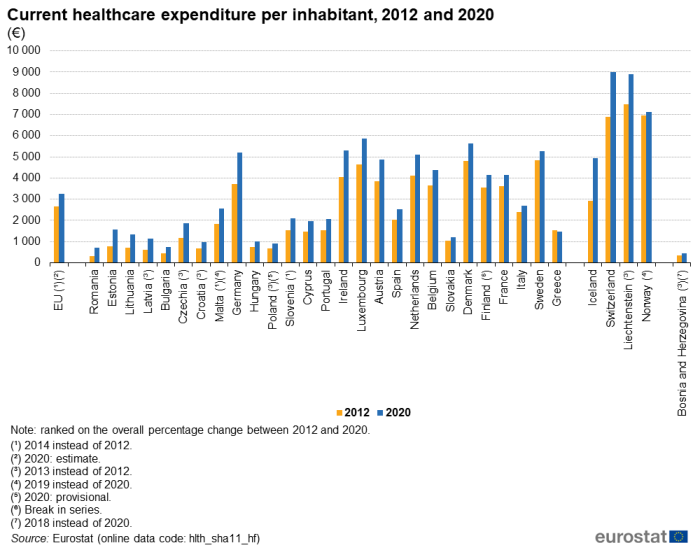
(€)
Source: Eurostat (hlth_sha11_hf)
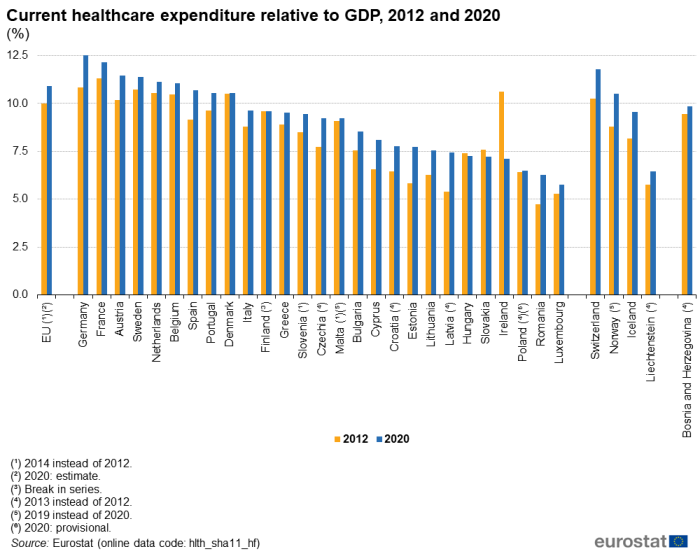
Figure 3 provides another analysis of the change in overall healthcare expenditure between 2012 and 2020, focusing on the ratio between this expenditure and GDP. Healthcare expenditure and GDP are both influenced by price changes and so, when combining the two indicators in a ratio, the impact of inflation may be cancelled out to some degree: this depends on the extent to which the price changes related to healthcare expenditure are similar to those experienced for the economy as a whole.
A total of 22 of the EU Member States reported a higher ratio of healthcare expenditure to GDP in 2020 than in 2012 (shorter time series for some Member States), while two reported no overall change and three a lower ratio. By far the largest fall was in Ireland, where the ratio was 3.5 percentage points (pp) lower in 2020 (7.1 %) than it had been in 2012 (10.6 %); falls of 0.3 pp and 0.2 pp were observed in Slovakia and Hungary, respectfully. In the EU Member States where the ratio was higher in 2020 than it had been in 2012, the increase was 1.6 pp or less in most cases, with larger increases in Estonia (up 1.9 pp), Latvia (up 2.0 pp between 2013 and 2020) and Germany (also up 2.0 pp). Among the non-EU member countries shown in Figure 3, Norway recorded a relatively large increase, up 1.7 pp between 2012 and 2019.
(%)
Source: Eurostat (hlth_sha11_hf)
Overview of healthcare financing, functions and providers
Healthcare expenditure can be analysed from three perspectives: the sources of financing, the healthcare functions that are financed and the providers of healthcare.
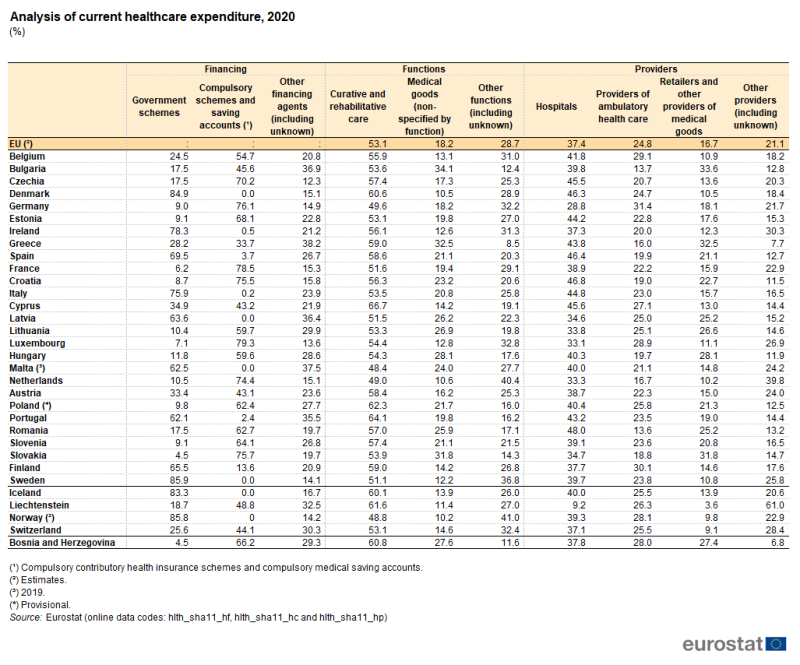
Table 3 identifies the largest sources of financing, functions and providers.
- Among the EU Member States, government schemes and compulsory contributory health insurance schemes and compulsory medical saving accounts (which are generally part of the social security system and are hereafter referred to as compulsory schemes/accounts) collectively accounted for 61.8–87.7 % of all financing in 2020.
- More than half (53.1 %) of healthcare expenditure in the EU in 2020 was for curative and rehabilitative care, while nearly one-fifth (18.2 %) was for medical goods.
- Hospitals were the largest providers of healthcare in expenditure terms, accounting for close to two-fifths (37.4 %) of all expenditure in the EU in 2020. Providers of ambulatory health care (24.8 %) and retailers and other providers of medical goods (16.7 %) were the second and third largest providers of healthcare in expenditure terms.
(%)
Source: Eurostat (hlth_sha11_hf), (hlth_sha11_hc) and (hlth_sha11_hp)
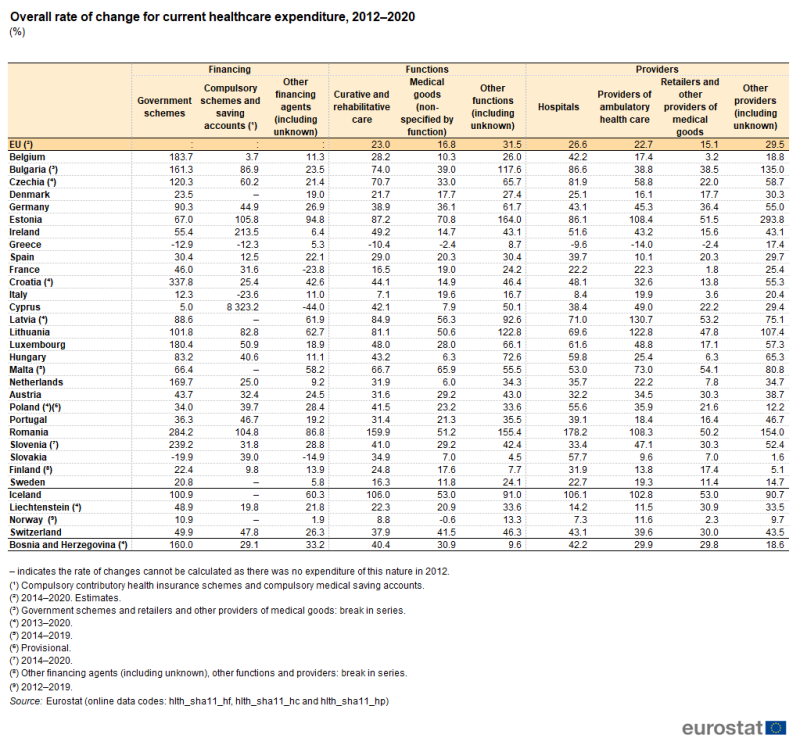
Table 4 shows how the expenditure for each of the largest sources of financing, functions and providers changed between 2012 and 2020. Note that for the EU, some of the EU Member States and some of the non-EU member countries the rates of change cover a shorter time period.
Between 2014 and 2020, expenditure on other functions increased by 31.5 %, ahead of the increase for curative and rehabilitative care (23.0 %) and for medical goods (16.8 %). In a similar manner, expenditure on other providers increased 29.5 % between 2014 and 2020, ahead of the rates of change recorded for hospitals (26.6 %) and providers of ambulatory health care (22.7 %) and retailers and other providers of medical goods (15.1 %).
Between 2012 and 2020, the largest increase in healthcare financing in 20 EU Member States was from government schemes (for example, in Romania). In six more it was from compulsory schemes/accounts (for example, in Cyprus). Consequently, there was one EU Member State – Greece – where expenditure from other financing schemes increased more than from these two large sources. In fact, in Greece, financing from both of the two large sources decreased between 2012 and 2020. Decreases were also observed for government schemes in Slovakia as well for compulsory schemes/accounts in Italy. Other sources of financing fell in Cyprus, France and Slovakia.
In terms of healthcare functions, in eight EU Member States (for example, in Romania) the largest increase was for expenditure on curative and rehabilitative care, while in Italy expenditure increased most for medical goods. In the remaining 18 EU Member States, the increase in expenditure on other functions was greater than for curative and rehabilitative care or for medical goods. Greece recorded a decrease in expenditure on the two large functions, whereas all other Member States recorded increases.
For healthcare providers, the largest increase in expenditure between 2012 and 2020 in 11 EU Member States (for example, in Romania) was for hospitals, while in three more (for example, in Lithuania) it was for providers of ambulatory health care. As none of the Member States reported the largest increase for retailers and other providers of medical goods, expenditure for other providers increased more than for these three large providers in the 13 remaining EU Member States (for example, in Estonia). Greece recorded a decrease in expenditure for the three large providers, whereas all other Member States recorded increases.
(%)
Source: Eurostat (hlth_sha11_hf), (hlth_sha11_hc) and (hlth_sha11_hp)
While Tables 3 and 4 offer an overview of the three perspectives (sources of financing, functions and providers), the remainder of this article looks at each of these perspectives in more detail.
Healthcare expenditure by financing scheme
Government and compulsory schemes/accounts together financed more than 75.0 % of healthcare expenditure in 17 EU Member States in 2020
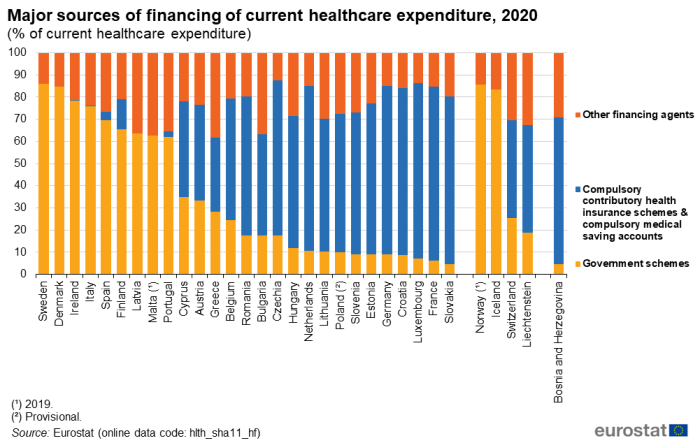
Figure 4 provides a simplified analysis of healthcare expenditure by financing scheme, distinguishing: government schemes, compulsory schemes/accounts, as well as all other financing agents. The combined share of government schemes and compulsory schemes/accounts in total current healthcare expenditure was in excess of 85.0 % in Czechia (where the highest share was recorded, at 87.7 %), Luxembourg, Sweden and Germany; it was also above 85.0 % in Norway (2019 data). In a further 13 EU Member States, the combined share was above 75.0 %, as was also the case in Iceland. The lowest combined share of these two major sources was 61.8 % in Greece.
In most of the EU Member States, either government schemes or compulsory schemes/accounts dominated.
- In nine EU Member States, government schemes accounted for more than half of all expenditure; this was also the case in Iceland and Norway (2019 data).
- In 14 EU Member States, compulsory schemes/accounts accounted for more than half of all expenditure; this was also the case in Bosnia and Herzegovina.
- In Bulgaria, Cyprus and Austria, compulsory schemes/accounts registered a larger share than government schemes or other sources, but less than half of the total; this was also the case in Liechtenstein and Switzerland.
- In Greece, other sources provided a greater share of financing than either government schemes or compulsory schemes/accounts.
Compulsory schemes/accounts accounted for three-quarters or more of overall spending on healthcare in Luxembourg (79.3 %), France (78.5 %), Germany (76.1 %), Slovakia (75.7 %) and Croatia (75.5 %) in 2020, but less than 5.0 % in Spain, Portugal, Ireland and Italy. It should be noted that compulsory schemes/accounts do not exist in Denmark, Latvia, Malta and Sweden. By contrast, Sweden (85.9 %) and Denmark (84.9 %) reported that government schemes accounted for more than four-fifths of their expenditure on healthcare, while shares above 75.0 % were (also) registered in Ireland and Italy.
(% of current healthcare expenditure)
Source: Eurostat (hlth_sha11_hf)
Table 5 provides a similar analysis of healthcare expenditure by financing scheme, but with more detail concerning other financing schemes.
The third largest source of healthcare funding was generally household out-of-pocket payments. In 2020, the share of out-of-pocket payments accounted for more than one-third of total healthcare expenditure in Bulgaria (35.5 %), Malta (34.1 %, 2019 data) and Greece (33.4 %). The Netherlands, France and Luxembourg were the only EU Member States where household out-of-pocket payments accounted for less than one-tenth of healthcare expenditure, with shares of 9.3 %, 8.9 % and 8.4 %, respectively.

(% of current healthcare expenditure)
Source: Eurostat (hlth_sha11_hf)
Voluntary health insurance schemes generally represented a small share of healthcare financing in the EU in 2020. Their relative share peaked at 13.4 % in Slovenia; the next highest share was 9.0 % in Ireland. There were five EU Member States where voluntary health insurance schemes provided less than 1.0 % of the finance for healthcare expenditure in 2020, with the lowest share recorded in Czechia (0.1 %).
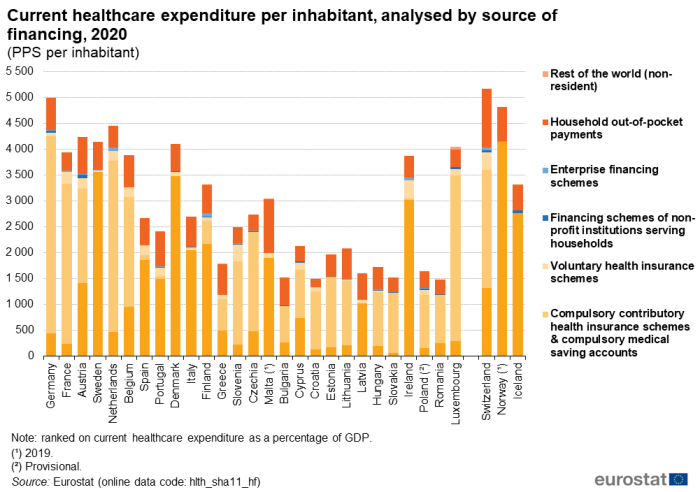
The final analysis concerning financing (see Figure 5), shows the same sources of financing as in Table 5, but presented as values per inhabitant (in PPS) rather than as a share of all healthcare expenditure. This analysis shows how much on average is spent per inhabitant from each of the different sources. The total for all sources (the overall height of each stacked bar) shows the overall expenditure per inhabitant. To put this in perspective, the EU Member States, the EFTA countries and Bosnia and Herzegovina have been ranked based on their overall level of current healthcare expenditure relative to GDP.
(PPS per inhabitant)
Source: Eurostat (hlth_sha11_hf)
Healthcare expenditure by function
Curative and rehabilitative care services accounted for more than half of current healthcare expenditure in all but two of the EU Member States
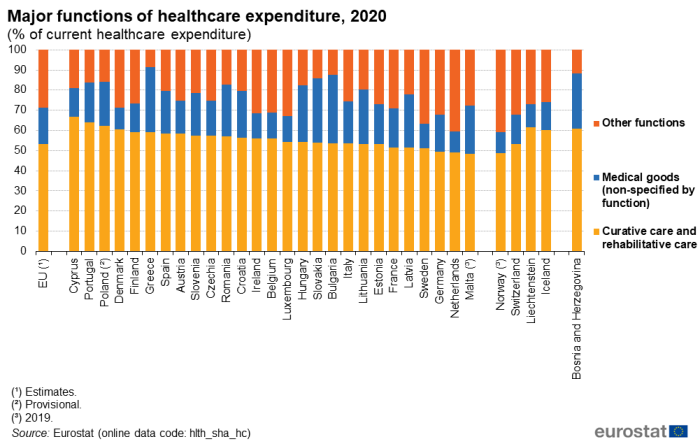
The functional patterns of healthcare expenditure presented in Figure 6 and Table 6 show that curative and rehabilitative care services incurred more than 50.0 % of current healthcare expenditure in 2020 in the vast majority of EU Member States. The exceptions were Germany, the Netherlands and Malta (2019 data), where the shares were almost half: 49.6 %, 49.0 % and 48.4 %, respectively. By contrast, at the upper end of the range, two-thirds of current healthcare expenditure in 2020 was incurred by curative and rehabilitative care services in Cyprus (66.7 %) while Portugal, Poland and Denmark also recorded shares that were above 60.0 %.
(% of current healthcare expenditure)
Source: Eurostat (hlth_sha_hc)
Medical goods accounted for just under one-fifth of healthcare expenditure in 2020
Medical goods (non-specified by function) were the second largest function in the EU in 2020, with an 18.2 % share of current healthcare expenditure. There was a substantial variation between the EU Member States in terms of the share of expenditure used for these medical goods. The lowest shares were recorded for Denmark (10.5 %) and the Netherlands (10.6 %). By contrast, the highest shares – where medical goods accounted for more than three-tenths of current healthcare expenditure – were recorded for Slovakia (31.8 %), Greece (32.5 %) and Bulgaria (34.1 %).

(% of current healthcare expenditure)
Source: Eurostat (hlth_sha11_hc)
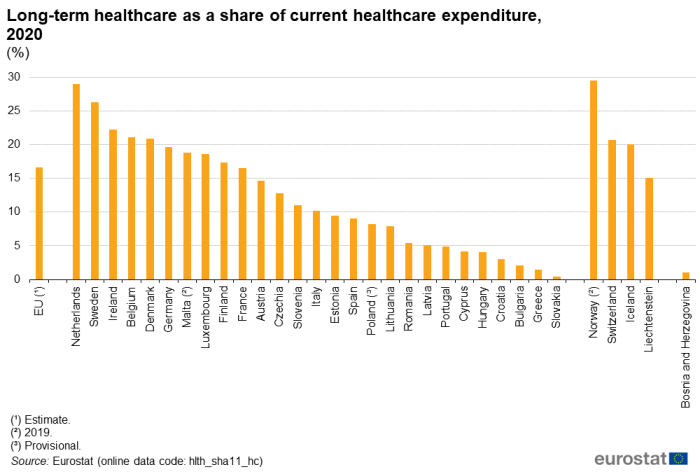
The proportion of healthcare expenditure incurred by long-term healthcare was 16.6 % in the EU in 2020: more information about this function is given in a special focus below.
The fourth largest function was ancillary services (such as laboratory testing or the transportation of patients), which accounted for 4.8 % of healthcare expenditure in the EU in 2020. The share of these services exceeded 10.0 % in Latvia, Cyprus, Estonia and Croatia. Expenditure related to health system governance and the administration of financing averaged 3.7 % in the EU in 2020 and ranged from 0.8 % in Finland to 5.5 % in France. Expenditure for preventive care averaged 3.4 % of current healthcare expenditure in 2020 in the EU, ranging from 1.0 % in Slovakia to 5.5 % in Italy and 5.6 % in Finland.
Long-term healthcare expenditure accounted for more than a quarter of current healthcare expenditure in the Netherlands and Sweden in 2020
As noted above, services related to long-term healthcare (see Figure 7) accounted for 16.6 % of current healthcare expenditure in the EU in 2020. This share was below 10.0 % in 13 of the EU Member States. Relatively low shares could be due to the main burden of long-term healthcare residing with family members, with no payment being made for providing these services. On the other hand, more than one-fifth of healthcare expenditure was attributed to long-term healthcare in Denmark, Belgium and Ireland, with this share exceeding one-quarter in Sweden and the Netherlands (26.2 % and 29.0 %, respectively). Among the EFTA countries, a relatively high share (29.5 %, 2019 data) was recorded in Norway (higher than in any of the Member States). It should be noted that it can be difficult to separate the medical and social components of expenditure for long-term care, leading to an inevitable impact on cross-country comparisons.
(%)
Source: Eurostat (hlth_sha11_hc)
Healthcare expenditure by provider
In expenditure terms, hospitals were the main providers of healthcare in most EU Member States
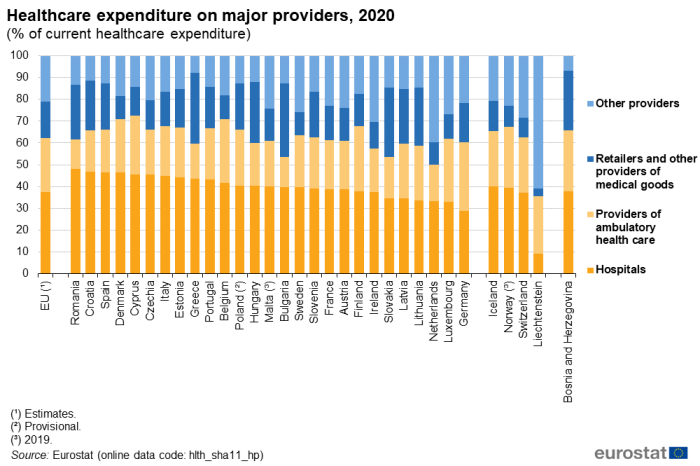
An analysis of current healthcare expenditure by provider is shown in Figure 8 and Table 7. It should be borne in mind that healthcare providers classified under the same group do not necessarily perform the same set of activities. For example, hospitals may offer day care, out-patient, ancillary or other types of services, in addition to in-patient services.
Hospitals accounted for the highest proportion (37.4 %) of healthcare expenditure in 2020 in the EU. Among the EU Member States, the share of current healthcare expenditure related to hospitals ranged from 28.8 % of the total in Germany to 48.0 % in Romania. Only Germany reported that hospitals did not have the highest share of healthcare expenditure, as ambulatory health care providers accounted for a greater share (31.4 %) of total healthcare expenditure. Among the EFTA countries, Liechtenstein reported a particularly low share of healthcare expenditure on hospitals (9.2 %), reflecting the fact that some healthcare activities provided by specialised hospitals are only available abroad.
(% of current healthcare expenditure)
Source: Eurostat (hlth_sha11_hp)
The second largest healthcare provider (in expenditure terms) was generally that of ambulatory health care providers. Their share of current healthcare expenditure in 2020 averaged 24.8 % in the EU and ranged from 13.6 % in Romania and 13.7 % in Bulgaria to 31.4 % in Germany.
The share of current healthcare expenditure accounted for by retailers and other providers of medical goods averaged 16.7 % in the EU in 2020. However, their share varied greatly between the EU Member State, from 10.2 % in the Netherlands to 31.8 % in Slovakia, 32.5 % in Greece and 33.6 % in Bulgaria.
Table 7 gives information on the relative size of the providers shown in Figure 8 as well as more detailed information on the shares of other providers. By far the largest of the other providers was residential long-term care facilities, which accounted for 10.3 % of current healthcare expenditure in the EU in 2020. Among the EU Member States, this share varied even more than the share for retailers and other providers of medical goods: the highest share for residential long-term care facilities was 28.7 % in the Netherlands, while in Croatia, Bulgaria and Slovakia the share was below 1.0 %.
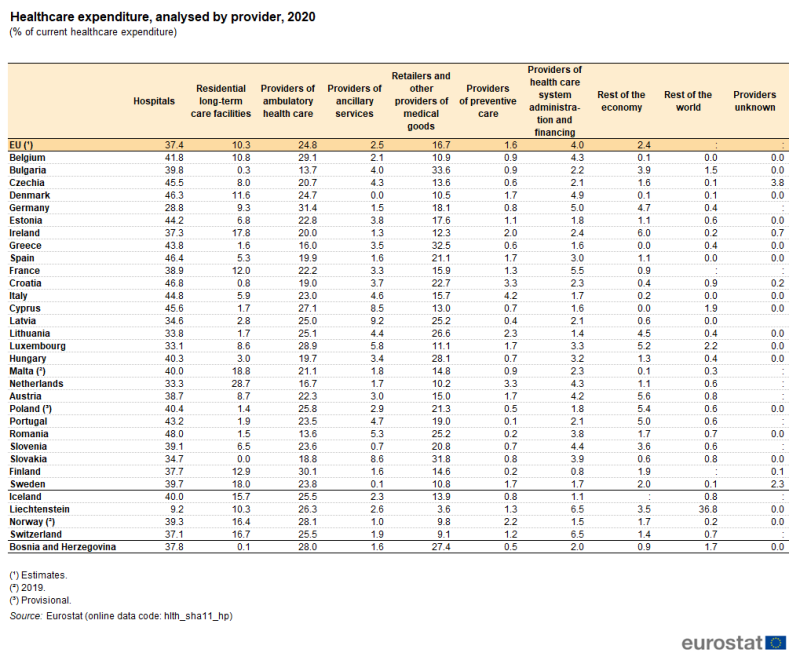
(% of current healthcare expenditure)
Source: Eurostat (hlth_sha11_hp)
Source data for tables and graphs
Data sources
The data for the EU for 2020 are estimates.
Data for Malta and Norway are not available for the reference year 2020, their 2019 data are shown instead in this article.
Tables in this article use the following notation:
- a dash ' – ' is use to show where a value is not applicable, for example a rate of change calculated for an indicator that initially had a value of zero;
- a colon ' : ' is used to show where data are not available.
Key concepts
Current healthcare expenditure quantifies the economic resources dedicated to health functions, excluding capital investment. Healthcare expenditure is primarily concerned with healthcare goods and services that are consumed by resident units, irrespective of where that consumption takes place (it may be in the rest of the world) or who is paying for it. As such, exports of healthcare goods and services (to non-resident units) are excluded, whereas imports of healthcare goods and services for final use are included.
Medical goods (non-specified by function) are split into i) pharmaceuticals and other medical non-durable goods and ii) therapeutic appliances and other medical durables. This category aims to include all consumption of medical goods where the function and mode of provision is not specified. It includes medical goods acquired by the beneficiary either as a result of prescription following a health system contact or as a result of self-prescription. It excludes medical goods consumed or delivered during a health care contact that are prescribed by a healthcare professional.
Long-term healthcare consists of a range of medical and personal care services that are consumed with the primary goal of alleviating pain and suffering and reducing or managing the deterioration in health status in patients with a degree of long-term dependency. The aim of long-term social care is to provide services and support, by formal and informal care givers, to individuals who, for reasons of disability, illness or other dependency, need help to live as normal a life as possible. Social care covers a wide range of services, including professional advice and support, accommodation, various types of assistance in carrying out daily tasks, home visits, home help services, provision of meals, special equipment, house adaptation for disabled persons, as well as assessment and care management services. There may be a mixed economy of health and social care provision and this mix of services can make it difficult to separate expenditure between health and social components. For the purpose of this article, the analysis of long-term care (as shown in Figure 7) is composed solely of the health component.
System of health accounts
Eurostat, the Organisation for Economic Cooperation and Development (OECD) and the World Health Organization (WHO) established a common framework for a joint healthcare data collection exercise. The data collected relates to healthcare expenditure following the methodology of the system of health accounts (SHA).
The SHA shares the goals of the system of national accounts (SNA): to constitute an integrated system of comprehensive, internally consistent and internationally comparable accounts, which should as far as possible be compatible with other aggregated economic and social statistical systems. Health accounts provide a description of the financial flows related to the consumption of healthcare goods and services from an expenditure perspective. Health accounts are used in two main ways: internationally, where the emphasis is on a selection of comparable expenditure data; nationally, with more detailed analyses of healthcare spending and a greater emphasis on comparisons over time.
In 2011, as a result of four years of extensive and wide-reaching consultation, Eurostat, the OECD and the WHO released an updated manual for the collection of health accounts, A system of health accounts, 2011 – revised edition. The core set of SHA tables addresses three basic questions: i) what kinds of healthcare goods and services are consumed, ii) which healthcare providers deliver them and, iii) which financing schemes are used to deliver them?
Healthcare expenditure is recorded in relation to the international classification for health accounts (ICHA), defining:
- healthcare expenditure by financing schemes (ICHA-HF) – classifies the types of financing arrangements through which people obtain health services; healthcare financing schemes include direct payments by households for services and goods and third-party financing arrangements;
- healthcare expenditure by function (ICHA-HC) – details the split in healthcare expenditure following the purpose of healthcare activities – such as, curative care, rehabilitative care, long-term care, or preventive care;
- healthcare expenditure by provider (ICHA-HP) – classifies units contributing to the provision of healthcare goods and services – such as hospitals, residential facilities, ambulatory health care services, ancillary services or retailers of medical goods.
Healthcare expenditure – methodology
Commission Regulation (EU) 2015/359 of 4 March 2015 implementing Regulation (EC) No 1338/2008 as regards statistics on healthcare expenditure and financing is the legal basis for data collection according to SHA 2011 methodology for healthcare expenditure. The regulation applies to data from reference year 2014 to 2020 and therefore the information for the most recent years shown in this article presents a harmonised set of data based on this methodology.
A new implementing regulation (Commission Regulation (EU) 2021/1901 of 29 October 2021 as regards statistics on health care expenditure and financing) will apply to data from the 2021 reference year.
Statistics on healthcare expenditure are documented in a background article which provides more information on the scope of the data, the legal framework, the methodology employed, as well as related concepts and definitions.
Context
Health systems across the globe are developing in response to a multitude of factors, including: new medical technology and improvements in knowledge; new health services and greater access to them; changes in health policies to address specific diseases and demographic developments; new organisational structures and more complex financing mechanisms. However, access to healthcare and greater patient choice is increasingly being considered against a background of financial sustainability.
The European Commission adopted a Strategic Plan for the period 2020–2024. In order to improve the quality and effectiveness of public expenditure and contribute to prosperity and social cohesion, the European Commission seeks to provide expertise on health systems and support actions that help prevent and reduce the impact of ill-health on individuals and economies, while encouraging and supporting innovation and the uptake of modern technologies for better care delivery and cost-effectiveness.
The Directorate-General for Health and Food Safety has constituted a list of 88 European core health indicators (ECHIs) for monitoring progress in relation to health policy and broader objectives. Among these, it recommends specifically following developments for:
Direct access to
Online publication
Methodology
General health statistics articles
- Health (hlth), see:
- Health care (hlth_care)
- Health care expenditure (SHA 2011) (hlth_sha11)
- A system of health accounts 2011 – revised edition
- Healthcare expenditure (SHA 2011) (ESMS metadata file – hlth_sha11_esms)
Implementing legislation
- European Commission – Directorate-General for Health and Food Safety – Public Health, see:
- European Economy – The 2021 Ageing Report
- OECD – Health expenditure
- World Health Organization (WHO) – European Observatory on Health Systems and Policies
- World Health Organization (WHO) – Health system governance
