Businesses in the manufacturing sector
Data extracted in January 2024
Planned article update: January 2025
Highlights
2.1 million enterprises employed 30 million persons in the EU in 2021 in the manufacturing sector.

(% share of sectoral employment)
Source: Eurostat (sbs_sc_ovw)
This article presents an overview of statistics for the European Union's (EU) manufacturing sector, as covered by NACE Rev. 2 Section C. It belongs to a set of statistical articles on 'Business economy by sector'.
The manufacturing sector includes a vast range of activities and production techniques, from small-scale enterprises using traditional production techniques, such as the manufacture of musical instruments, to very large enterprises sitting atop a high and broad pyramid of parts and components suppliers collectively manufacturing complex products, such as aircraft. An analysis of the manufacturing sector as a whole gives an idea of the scale of this sector. It should be noted, however, that indicators of its inputs (for example, labour or capital goods), its performance, or its size structure are effectively an average across very different activities. While this can also be said of other large and diverse sectors, such as distributive trades and transport services, the manufacturing sector is probably the most varied activity within the business economy at the NACE section level of detail.
Full article
Structural profile
Almost 1 in 7 (6.8 %) of all enterprises in the EU's business economy (Sections B to N and P to R, as well as Divisions S95 and S96) were classified as 'Manufacturing' (Section C) in 2021, a total of more than 2.1 million enterprises.
The manufacturing sector employed around 29.7 million persons in 2021, with 1.1 % more than in 2020 and generated €2.2 trillion of value added, an increase of 18 % compared with 2020, an year marked by the COVID-19 pandemic. By these two measures, manufacturing was the largest of the NACE sections within the EU's business economy in terms of its contribution to employment (19 %), as well as the largest contributor to the business economy value added, accounting for almost one quarter of the total (24 %). In terms of turnover, the manufacturing sector had the second highest net turnover within the EU's business economy after distributive trades, recording 8.3 billion, an increase of 16 % compared to the previous year. Together with distributive trades sector, they accounted for more than half (56 %) of the EU’s business economy net turnover.
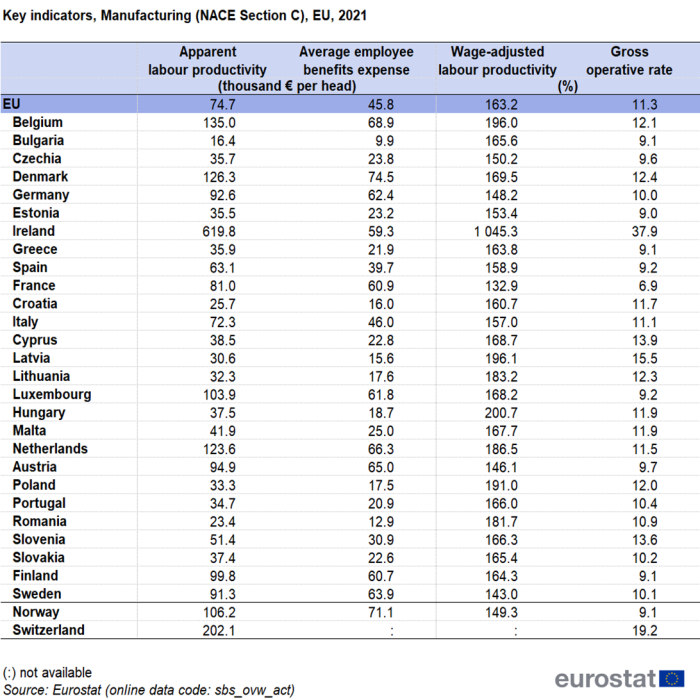
In 2021, the EU's manufacturing sector recorded apparent labour productivity and average personnel costs (Average employee benefits expense) above business economy averages: the apparent labour productivity of the manufacturing sector was €74 700 per person employed, some €14 600 more than the business economy average (€60 200 per person employed), while average personnel costs in the manufacturing sector were €45 800 per employee, some €6 800 above the business economy average (€39 900 per employee). Combining these two ratios into the wage-adjusted labour productivity ratio shows that value added per person employed in the EU's manufacturing sector was equivalent to 163.2 % of average personnel costs per employee, which was slightly above the average for the business economy (154.4 %).
The gross operating rate (the relation between the gross operating surplus and turnover) was 11.3 % for the EU's manufacturing sector in 2021, below the 13.2 % average for the business economy. This sector had the third lowest gross operating rate among any of the NACE sections within the business economy619, only distributive trades and electricity, gas, steam and air conditioning supply sector had a lower gross operating rate (7.1 % and 9.3 %, respectively).
Sectoral analysis
At the NACE division level the manufacturing sector is composed of 24 different subsectors. The largest EU subsector in 2021 (for which there is available data) in terms of value added was the manufacture of machinery and equipment (Division 28), followed by manufacture of food products (Division 10) and manufacture of motor vehicles, trailers and semi-trailers (Division 29). In terms of employment, the largest EU subsectors were manufacture of food products, manufacture of fabricated metal products, except machinery and equipment (Division 25) and manufacture of machinery and equipment— see Figure 1.

(% share of sectoral total)
Source: Eurostat (sbs_ovw_act)
Manufacturing subsectors are very diverse, combining activities with very high turnover (over 1 trillion), such as the manufacture of motor vehicles, trailers and semi-trailers and the manufacture of food products, with other activities that have lower net turnover, such as manufacture of tobacco products (Division 12) and manufacture of leather and related products (Division 15)— see Table 2a.

Source: Eurostat (sbs_ovw_act)

Source: Eurostat (sbs_ovw_act)
In 2021, among the available data, apparent labour productivity within the EU's manufacturing subsectors ranged from €26 800 per person employed or more for the manufacture of wearing apparel (Division 14) €35 000 for the manufacture of furniture (Division 31), to €406 300 per person employed for the manufacture of coke and refined petroleum products (Division 19) and €305 000 for the manufacture of tobacco products— see Table 2b. In line with their very low apparent labour productivity, the manufacture of leather and related products and of furniture recorded the lowest average employee benefits expense in the EU's manufacturing sector, at €27 300 per employee and €28 200 per employee respectively. The highest average employee benefits expense among the manufacturing sector was €77 200 per employee, registered by the subsector of manufacture of basic pharmaceutical products and pharmaceutical preparations (Division 21), this also being the third highest average personnel costs among NACE divisions within the whole of the business economy, after the insurance, reinsurance and pension funding, except compulsory social security and the extraction of crude petroleum and natural gas. In terms of apparent labour productivity, the subsector of manufacture of coke and refined petroleum products was the third highest among all business economy subsectors in 2021 and the manufacture of tobacco products was the fourth highest. These subsectors recorded also the third and fourth highest wage-adjusted labour productivity ratio among all business economy subsectors subsectors, after insurance, reinsurance and pension funding, except compulsory social security and the extraction of crude petroleum and natural gas.
Country overview
Because of the tradable (export and import) nature of manufactured goods it follows that the relative importance of manufacturing within the business economy varies greatly between EU Member States and also that specialisations at the subsector level are sometimes very pronounced. Figure 2 shows that the share of manufacturing within the business economy's value added varied in 2021 from 7.0 % in Luxembourg and 8.6 % in Cyprus to more than 33.0 % of the total in Slovenia and Slovakia and 41.0 %, the highest share, in Ireland. The range in employment terms ranged from 8.9 % in Luxembourg and the Netherlands to 31.1 % in Czechia.

(% share of value added and employment in the business economy total)
Source: Eurostat (sbs_ovw_act)
Among the five largest EU Member States, Germany stood out as its manufacturing sector contributed to almost one-third (32.2 %) of the EU's value added in 2021, above its 29.3 % share of value added in the EU's business economy as a whole. Italy also recorded a the seconf share (12.3 %) of the value added generated in the EU's manufacturing sector and in the business economy as a whole (14.5 %), being followed by France.

(cumulative share of the five principal Member States as a % of the EU total)
Source: Eurostat (sbs_ovw_act)

Source: Eurostat (sbs_ovw_act)
In value added terms, Germany was the largest EU Member State in 20 of the 24 manufacturing subsectors (see Table 3) in 2021; Italy was largest in three (the textiles, wearing apparel, and leather and related products manufacturing subsectors); France was the largest for the manufacture of other transport equipment. In Slovakia, the specialisation rate for the manufacture of motor vehicles, trailers and semi-trailers was very high and amounted to 11.0 % of business economy value added. Equally remarkable was the Latvian specialisation rate for manufacture of wood and of products of wood and cork, except furniture; manufacture of articles of straw and plaiting materials (Division 16). Other high specialisation ratios were recorded in Slovenia for the manufacture of fabricated metal products (Division 25), in Germany for the manufacture of machinery and equipment (Division 28), in Belgium for the manufacture of basic pharmaceutical products and pharmaceutical preparations and and in Greece for the manufacture of food products. Among the EU Member States, the highest turnover in manufacturing was recorded in Germany (€2.5 trillion), which represents 30 % of the total EU net turnover in manufacturing sector in 2021. The second and third highest values in net turnover for the manufacturing sector were recorded in Italy (€1.1 trillion) and France (€1.0 trillion). The same order was kept for employment, value added and gross investment in tangible non-current assets. Denmark recorded the highest level of average employee benefits expense within the manufacturing sector in 2021, €74 500 per employee, above the EU average of €45 800 per employee. Average employee benefits expense were also greater than or equal to €50 000 per employee in Belgium, the Netherlands, Austria, Sweden, Germany, Luxembourg, France, Finland and Ireland. On the other hand, average personnel costs were below €15 000 per employee in Romania and Bulgaria where the lowest levels were recorded. Combining these two indicators gives the wage-adjusted labour productivity ratio, which is a measure of labour productivity that takes into account the very different levels of pay and social charges between EU Member States and activities. The highest such ratios were recorded in Ireland (1045.3 %), Hungary (200.7 %), Latvia (196.1 %), Belgium (196.0 %) and Poland (191.0 %). The lowest wage-adjusted labour productivity ratios in manufacturing were registered in France (132.9 %), Sweden (143.0 %), Austria (146.1 %), and Germany (148.2 %).
Size class analysis
Large enterprises (employing 250 or more persons) contributed more to the EU's manufacturing sector than is typical for the business economy as a whole — in 2021, some 65.9 % of the manufacturing sector's value added was generated by large enterprises and these employed 47.8 % of the manufacturing employment; for comparison, the business economy average for large enterprise was a 47.5 % share of value added and a 35.6 % share of the employment.

Source: Eurostat (sbs_sc_ovw)
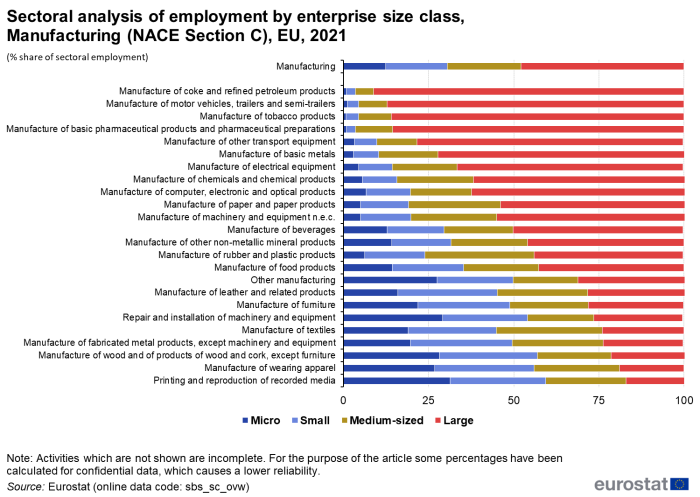
Among the four size classes, large enterprises (employing 250 or more persons) dominate in terms of employment the majority of the subsectors in 2021. The highest shares were concentrated in the manufacture of coke and refined petroleum products (91.2 %), of motor vehicles, trailers and semi-trailers (87.2 %), tobacco products (85.9 %) and of basic pharmaceutical products and pharmaceutical preparations (85.5 %).
Micro enterprises (employing less than 10 persons) contributed to the largest share of employment among the four size classes in printing and reproduction of recorded media (31.3 %), repair and installation of machinery and equipment (29.2 %) and manufacture of wood and of products of wood and cork, except furniture; manufacture of articles of straw and plaiting materials (28.2 %). These subsectors, together with manufacture of wearing apparel have a quite equal share between the four size-classes in terms of employment in 2021 – as shown in Figure 4.

(% share of sectoral employment)
Source: Eurostat (sbs_sc_ovw)
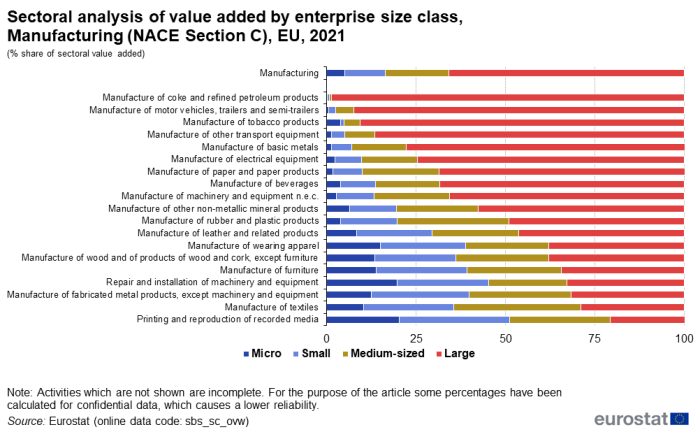
Large enterprises (employing 250 or more persons) contributed to the largest share of value added among the four size classes in most of the manufacturing subsectors for which data is available, the highest shares being recorded in the manufacture of coke and refined petroleum products (98.6 %) and of motor vehicles, trailers and semi-trailers (92.3 %). In terms of absolute values, the subsector of manufacture of motor vehicles, trailers and semi-trailers also recorded the highest value added among all the manufacturing subsectors, being followed by the manufacture of machinery and equipment. The contribution of medium-sized enterprises (employing 50 to 249 persons) to EU value added in manufacture sector was highest among the four size classes only in manufacture of textiles (35.6 %) as shown in Figure 5.

(% share of sectoral value added)
Source: Eurostat (sbs_sc_ovw)
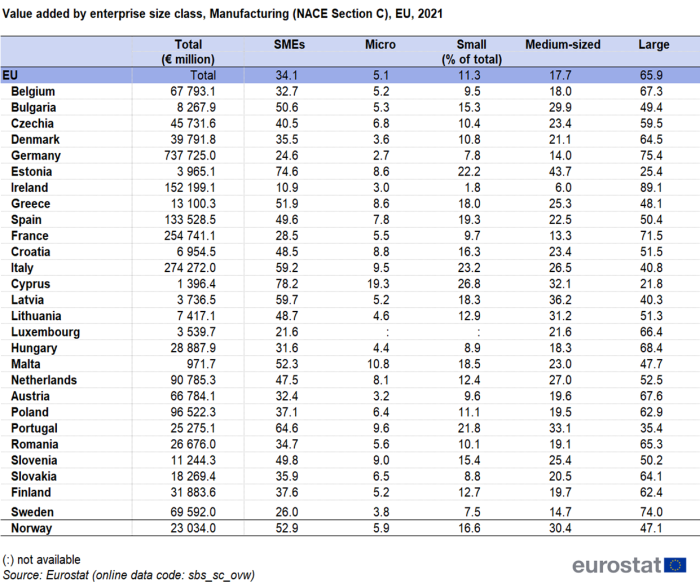
Among the EU Member States the relative significance of large enterprises was at its greatest in Ireland in 2021, as these enterprises contributed to 89.1 % of the large enterprises total value added generated in the manufacturing sector. Value added for large enterprises recorded on EU level (65.9 %) indicates high significance of large enterprises in the sector.
Medium-sized enterprises made a considerable contribution to manufacturing value added in Estonia with 43.7 % of the total value added for this size-class; while this contribution was only around 6.0 % in Ireland and 13.3 % in France.

Source: Eurostat (sbs_sc_ovw)

Source: Eurostat (sbs_sc_ovw)
Source data for tables and graphs
Data sources
Eurostat's structural business statistics describe the structure, conduct and performance of economic activities, down to the most detailed activity level (several hundred sectors). Without this structural information, short-term data on the economic cycle would lack context and would be more difficult to interpret. Coverage Structural business statistics cover the 'business economy', which includes industry, construction and many services (NACE Rev. 2 sections B to N, P to R as well as division S95 and S96). Structural business statistics do not cover agriculture, forestry and fishing, nor public administration. Structural business statistics describe the business economy through the observation of units engaged in an economic activity; the unit in structural business statistics is generally the enterprise. An enterprise carries out one or more activities, at one or more locations, and it may comprise one or more legal units. Enterprises that are active in more than one economic activity (plus the value added and turnover they generate, the people they employ, and so on) are classified under the NACE heading corresponding to their principal activity; this is normally the one which generates the largest amount of value added.
Manufacturing includes the physical or chemical transformation of materials, substances, or components into new products. The raw materials are products of agriculture, forestry, fishing, mining or quarrying as well as products of other manufacturing activities. Substantial alteration, renovation or reconstruction of goods is generally considered to be manufacturing. Selling to the general public products that have been made on the same premises from which they are sold, such as bakeries and custom tailors, is also included in manufacturing rather than retailing.
Manufacturing units may process their own materials, subcontract a part of the processing of their own materials, own legal rights and concepts of the product but subcontract the whole processing, or carry out the aforementioned subcontracted processes. Assembly of the component parts (whether self-produced or purchased) of manufactured products is also considered manufacturing. The output of a manufacturing process may be finished in the sense that it is ready for use or consumption, or it may be semi-finished in the sense that it is to become an input for further manufacturing.
Specialised installation, maintenance and repair of industrial, commercial and similar machinery and equipment is considered as part of manufacturing, however the repair of computers and personal and household goods is classified as a service (Division 95), while the repair of motor vehicles is classified as part of distributive trades (Section G).
Some transformation processes are not classified as manufacturing: logging is classified in forestry (Section A); materials recovery is considered as primarily waste processing (Section E); on-site construction of structures which is classified as part of construction (Section F); activities of breaking bulk and redistribution (including, for example, packaging, bottling or sorting) are classified to distributive trades.
Data sources
The analysis presented in this article is based on the main dataset for structural business statistics (SBS), size class data and regional data, all of which are published annually.
The main series provides information for each EU Member State as well as a number of non-EU member countries at a detailed level according to the activity classification NACE. Data are available for a wide range of variables.
In structural business statistics, size classes are generally defined by the number of persons employed. A limited set of the standard structural business statistics variables (for example, the number of enterprises, turnover, persons employed and value added) are analysed by size class, mostly down to the three-digit (group) level of NACE. The main size classes used in this article for presenting the results are:
- small and medium-sized enterprises (SMEs): with 1 to 249 persons employed, further divided into;
- micro enterprises: with less than 10 persons employed;
- small enterprises: with 10 to 49 persons employed;
- medium-sized enterprises: with 50 to 249 persons employed;
- large enterprises: with 250 or more persons employed.
Structural business statistics also include regional data. Regional SBS data are available at NUTS levels 1 and 2 for most of the EU Member States, Iceland and Norway, mostly down to the two-digit (division) level of NACE. The main variable analysed in this article is the number of persons employed. The type of statistical unit used for regional SBS data is normally the local unit, which is an enterprise or part of an enterprise situated in a geographically identified place. Local units are classified into sectors (by NACE) normally according to their own main activity, but in some EU Member States the activity code is assigned on the basis of the principal activity of the enterprise to which the local unit belongs. The main SBS data series are presented at national level only, and for this national data the statistical unit is the enterprise. It is possible for the principal activity of a local unit to differ from that of the enterprise to which it belongs. Hence, national SBS data from the main series are not necessarily directly comparable with national aggregates compiled from regional SBS.
Context
European enterprise policy is conducted by the Directorate-General (DG) for Internal Market, Industry, Entrepreneurship and SMEs (GROW) The European Commission's enterprise policies aim to create a favourable environment for business to thrive within the EU, creating higher productivity, economic growth, jobs and wealth. Policies are aimed at reducing administrative burden, stimulating innovation, encouraging sustainable production, and ensuring the smooth functioning of the EU's internal market.
In March 2010, the Europe 2021 strategy was adopted: this is the EU's strategy for smart, sustainable and inclusive growth. It is a strategy to enhance the competitiveness of the EU and to create more growth and jobs. The latest revision of the Integrated economic and employment guidelines (revised as part of the Europe 2021 strategy) includes a guideline to improve the business and consumer environment and modernise Europe's industrial base. An integrated industrial policy for the globalisation era was subsequently adopted by the European Commission in October 2010. As a flagship initiative of the Europe 2021 strategy, this policy sets out a strategy that aims to boost growth and jobs by maintaining and supporting a strong, diversified and competitive industrial base offering well-paid jobs while becoming less carbon intensive. The strategy puts forward a wide range of actions mixing broad cross-sectoral measures and actions for specific activities. Among the proposed actions are: the creation of framework conditions for sustainable supply and management of domestic primary raw materials; improving resource efficiency by addressing sector-specific innovation performance, for example in advanced manufacturing technologies; and addressing the challenges of energy-intensive activities through actions to improve framework conditions and support innovation.
Building on and updating the integrated industrial policy, in October 2012 the European Commission adopted a Communication titled 'A Stronger European Industry for Growth and Economic Recovery — Industrial Policy Communication Update' (COM(2012) 582 final), which put forward policies to lay the foundations for Europe's industry of the future. In part this focused on investment in innovation, with the proposal to establish task forces to establish road maps for: markets for advanced manufacturing technologies for clean production; markets for key enabling technologies; bio-based product markets; sustainable industrial policy and construction and raw materials; clean vehicles; and smart grids. Furthermore, the communication looked at issues related to access to the internal and international markets, as well as access to finance and capital and also the role of human capital and skills, in particular developing skills in the labour force for industrial transformation.
Direct access to
- Recent Eurostat publications on SBS
- Key figures on Europe – 2023 edition – see subchapter on Business
- Eurostat’s Regional Yearbook – see chapter 8. Business
- News Release SBS – 2021 final data
Glossary
ESMS metadata files
- Structural business statistics – SBS metadata file


