Recycling – secondary material price indicator
Data from January 2024
Planned article update: February 2025
Highlights
In 2022, average prices of secondary materials were: 65 euro/tonne for glass, 206 euro/tonne for paper and cardboard and 454 euro/tonne for plastic. Compared with 2021 they increased by 39 % for plastic, 11 % for paper and remained almost at the same level for glass.
In 2022 compared with 2021, the weight of secondary waste materials traded increased by 8 % for plastic, 4 % for glass and decreased by less than 2 % for paper.
Average price indicator for glass, paper and cardboard and plastic, EU, 2012-2022
This article presents indicators on the volumes and prices of recyclables in the European Union (EU). The purpose is to provide relevant data and to give a broader overview of the market for secondary materials. Secondary materials are waste materials that are recycled and can be used in manufacturing processes, instead or alongside 'virgin' raw materials.
The indicators consider the average monthly volume of trade in secondary materials (thousand tonnes or million tonnes) and their average monthly prices (euro/tonne). The analysis is based on international trade in goods statistics and monitors exports between EU Member States and countries outside the EU (extra-EU) and imports from EU Member States and non-EU countries (intra-EU, extra-EU). The intra-EU exports are not calculated in order to avoid double counting the volumes from intra-EU trade. The price indicator is presented in a way similar to other market-price related indicators, such as energy import prices.
In contrast to the established markets for steel and aluminium scrap, markets of waste from materials originally used for consumer-related packaging (such as glass, paper and cardboard, and plastic) are less observed. Therefore, this analysis focuses on these materials. The indicators are relevant to stakeholders concerned with long-term performance of secondary-material markets, as well as to policymakers developing recycling strategies in the circular economy. Both elements, trade volumes and prices, are shown within the same graphs to highlight current trends and volatility.
Full article
General overview
The data for glass, paper and cardboard, and plastic show that the prices of recyclables have varied significantly over time. Over the last decades, the most notable change was a sharp reduction in secondary material prices for paper and cardboard, and plastic during the financial crisis of 2008-2009. However, average annual figures for trade within the European Union (EU) suggest that the markets for most secondary materials were not substantially affected.
The data also show that, for materials which are often exported out of the EU for recycling, the price recovered after the sharp drop seen throughout 2008. Extra-EU trade volumes in plastic, for example, dropped significantly for a few months in 2008-2009, but bounced back to levels higher than before 2008. The data also suggest that, since the beginning of 2018, the countries receiving waste materials for recycling from the EU changed significantly.
The growth of inflation in 2022 affected the prices for secondary materials. Volumes in glass as well as paper and cardboard increased slightly from 2019 ‒ reaching the numbers of 2018. Plastic had a 2 % decrease in 2020, but it showed increases in volumes in the period of 2021-2022 with the apex in 2022 (+8 %).
The following sub-sections present the price and trade volumes for glass, paper and cardboard, and plastic. The data and figures are updated regularly on the Eurostat dedicated website on waste statistics.
Average prices and trade volumes
Glass
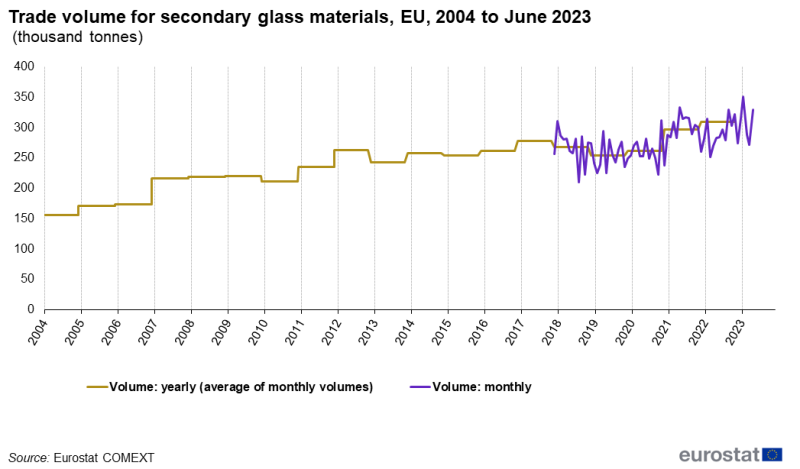
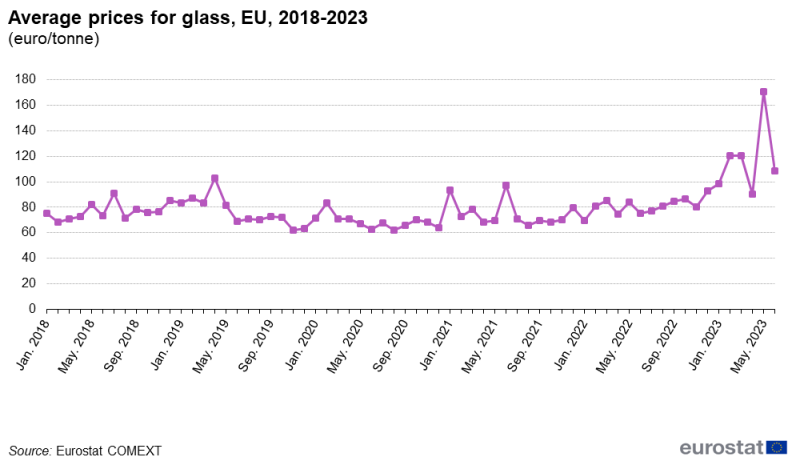
Annual averages of monthly volumes and prices for secondary glass materials from 2004 to 2022 are presented in Figure 1a and Figure 1b. From January 2018 to June 2023, monthly data are also displayed, highlighting the fluctuations in the volume and price data respectively.
In Figure 1a, EU trade in secondary glass materials (golden line – annual average of monthly volumes) shows an increase from an average of around 156 000 tonnes/month in 2004 to 297 000 tonnes/month in 2021 and 310 000 tonnes/month in 2022. The monthly trade data (violet line) demonstrates the high fluctuation. The highest trading volume was observed in March 2023 with 352 000 , the second highest volume recorded in June 2021 with 333 000 tonnes, and another two peaks in October 2022 and June 2023 at 330 000 tonnes. Detailed data (not displayed in Figure 1b) show that the cross-border trade volume is dominated by intra-EU trade of glass material for recycling. Extra-EU export trade is minor for glass (10 % of total trade volume in 2022).
Source: Eurostat COMEXT
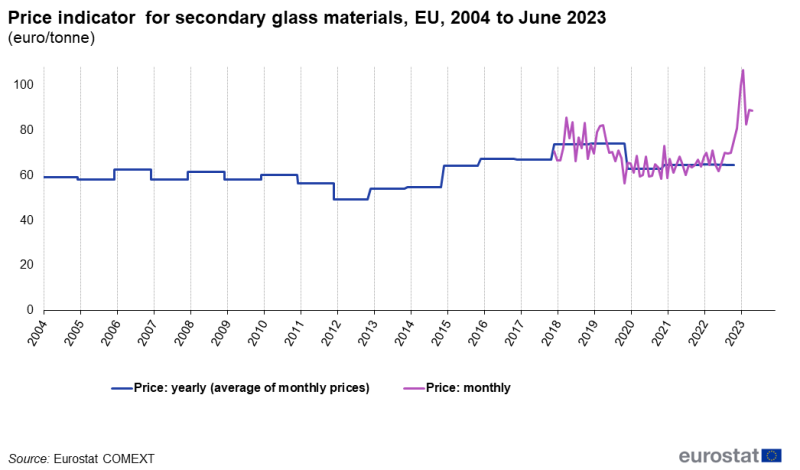
Figure 1b, the dark blue line shows the development of the annual average prices (an average of the monthly prices), while the lighter green line shows the monthly prices. In the period from January 2018 to December 2022, the highest price observed in May 2018 (86 euro/tonne). After that, monthly prices stabilised between 56-84 euro/tonne for the rest of 2019-2022 (the annual average for 2019 was approximately 74 euro/tonne; for both 2021 and 2022 -65 euro/tonne). Peaks were reached in February 2023 (100 euro/tonne) and in March 2023, when the price to 107 euro/tonne before falling to 83 euro/tonne in the month after and slightly increasing to 89 euro/tonne in May-June 2023.
Paper and cardboard
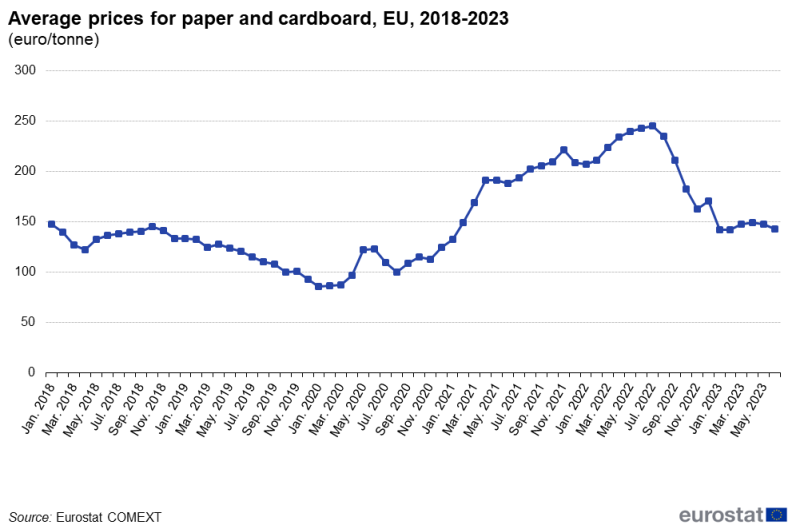
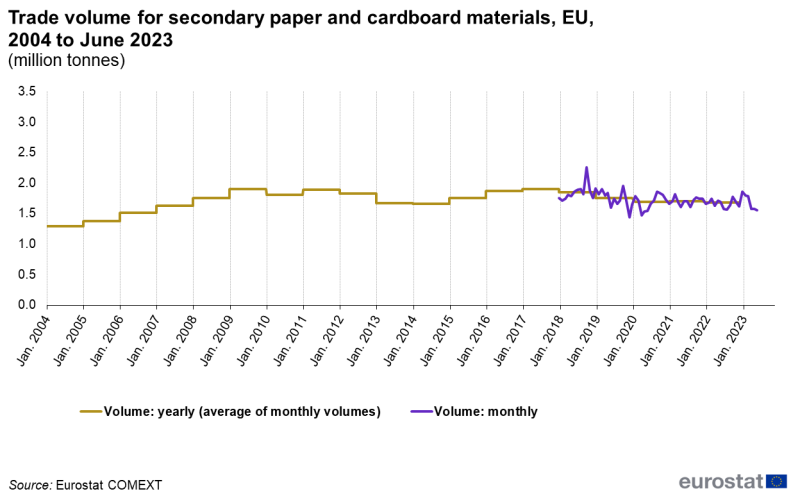
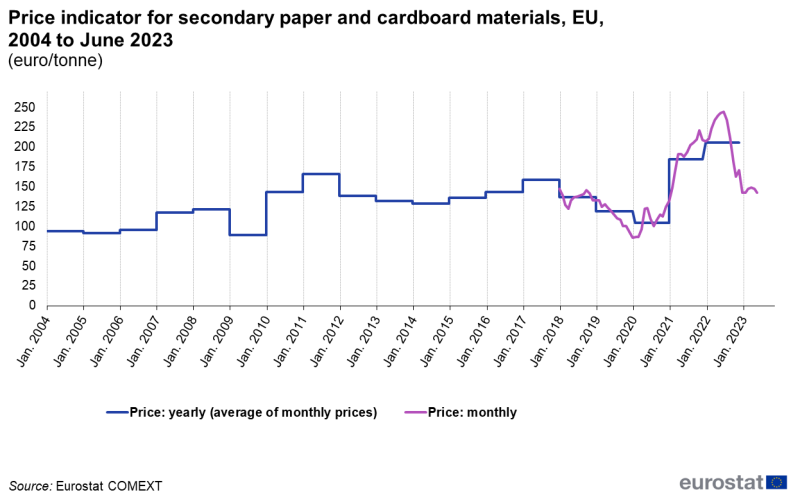
For both series (price and volume), annual averages of monthly volumes and prices for secondary paper and cardboard materials are shown from 2004 to 2023 (Figure 3a; Figure 3b). From January 2018 to June 2023, the data are also displayed on a monthly basis to highlight fluctuations (violet and lilac lines, respectively).
Source: Eurostat COMEXT
In Figure 3a, the traded volume (golden line) increased steadily from 2004 to 2011. The highest average traded volume was recorded in 2009 and 2017 with 1.90 million tonnes/month. The annual average of monthly trade fluctuated between 1.30 and 1.90 million tonnes/month in the other years. The monthly volume (violet line) shows the fluctuations around the 12 months' averages, with the monthly volume rising to a high of 2.26 million tonnes in October 2018 before falling to 1.88 million tonnes in the month after. The second highest volume 1.95 million tonnes recorded in October 2019. Monthly volume stabilised between 1.43-1.91 million tonnes for the rest of time. The annual average for 2022 was stable at approximately 1.70 million tonnes.
Source: Eurostat COMEXT
The price data (Figure 3b) do not follow the same trend as the data on traded volume. During the economic crisis, the average price dropped from 121.8 euro/tonne in 2008 to around 88.8 euro/tonne in 2009. The price rebounded sharply through 2010 and 2011, peaking at 165.7 euro/tonne in 2011, before trailing off in the following years. In 2017, the average price over the year climbed to a high of 159 euro/tonne, but fell sharply to 137 euro/tonne in 2018, 118 euro/tonne in 2019 and took another decrease in 2020 to 104 euro/tonne before rebounding to 184 euro/tonne in 2021 and peaking at 205.5 euro/tonne in 2022. Over the most recent period, there was a sharp decline in the monthly prices from around 146 euro/tonne in October 2018, falling month-by-month to around 86 euro/tonne in January 2020. However, a rebound was observed in the next months coinciding with the COVID-19 pandemic, growing to 221 euro/tonne in November 2021, and reaching its maximum over the whole period at 244 euro/tonne in July 2022 before taking another decrease in January-February 2023 to 142 euro/tonne.
Plastic
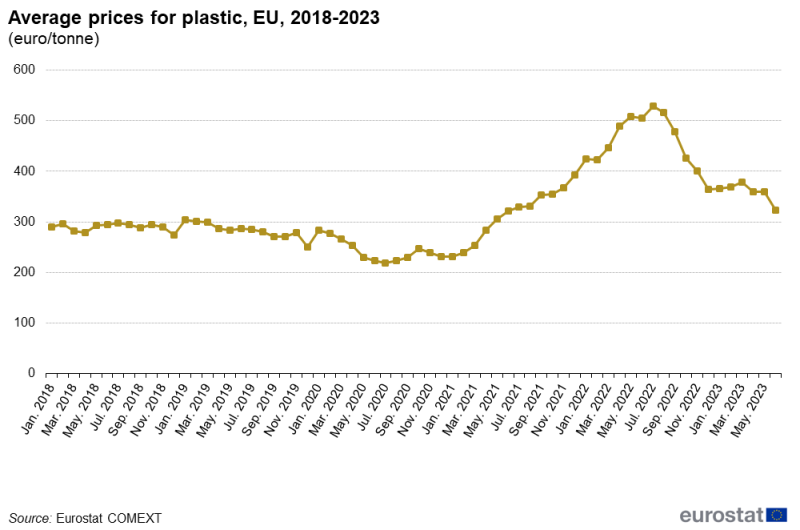
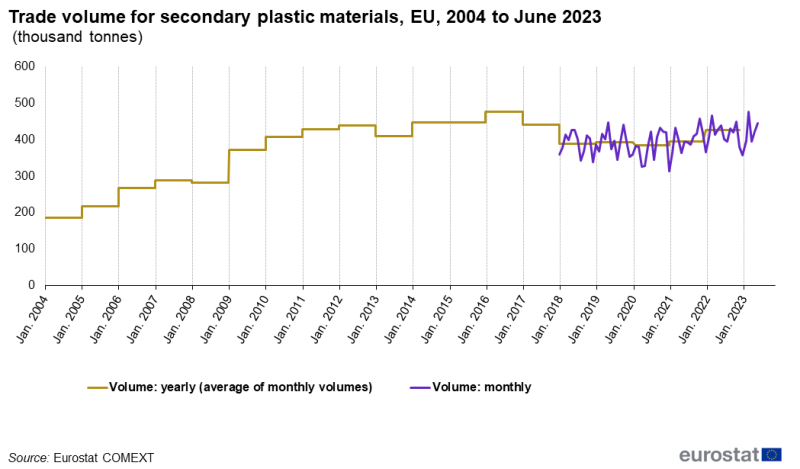
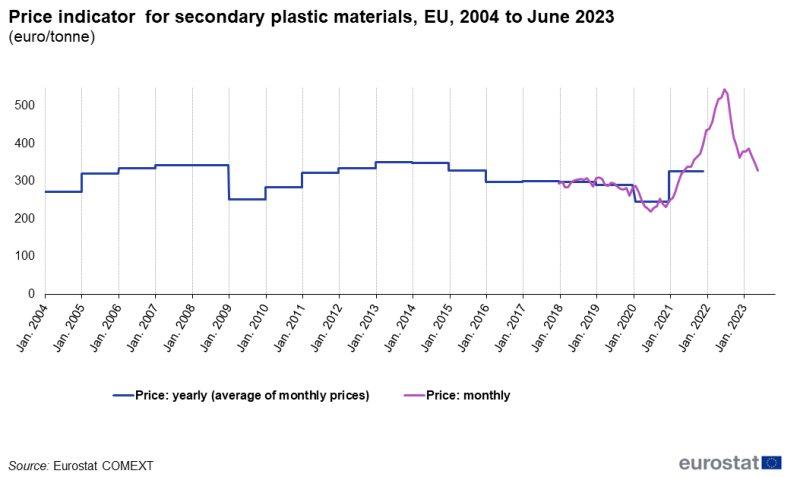
For both price and volume of waste plastic, annual averages of monthly volumes and prices are given from 2004 to June 2023 (Figure 5a; Figure 5b). From 2018 to June 2023, data are also displayed on a monthly basis, highlighting fluctuations over the years (lilac and violet lines, respectively).
Source: Eurostat COMEXT
In Figure 5a, the traded volume for secondary plastic materials (golden line) grew continuously from 2004 to 2016, with the only exception of a slight decrease to 410 000 tonnes/month in 2013. The peak volume was recorded in 2016 with an average of 477 000 tonnes/month. The traded volume tailed off in subsequent years, falling to 389 000 tonnes/month in 2018, 393 000 tonnes/month in 2019 and 384 000 tonnes/month in 2020, before rebounding to 426 000 tonnes/month in 2022. Within last 2.5 years, the volatility in the volumes traded was also significant. In 2021, spikes were observed in November (458 000 tonnes); in 2022, the highest level was in March (466 000 tonnes); and the peak volumes of the period were recorded in March 2023 (477 000 tonnes). Between 2018 and 2023 the lowest monthly volume was recorded in January 2021, with 313 000 tonnes. After that, a rebound was observed with the volume levels between 357 and 477 tonnes. In the second half of 2022 and during the period of March-June 2023, a recovery in volume was observed averaging 412.9 tonnes for the last six months of 2022 and 434.7 tonnes for the period of March-June 2023.
Source: Eurostat COMEXT
The price of secondary plastic materials depends on the one hand, the supply and demand of secondary plastic material and, on the other hand, the crude oil price, which strongly influences the price of the virgin (primary) material.
The indicator (lilac line) shows an increase in the price of secondary plastic materials between January 2021 and July 2022 when the levels are growing from 231 euro/tonne to 528 euro/tonne. Before that period prices for plastic were more stable and fluctuated between 250-300 euro/tonne, the price had recorded the minimum price level at 218 euro/tonne in July 2020. Since then, the price went up to 327 euro/tonne on average in 2021 and further increased, reaching average price of 454 euro/tonne in 2022. For the previous three years the average price was between 247 euro/tonne and 298 euro/tonne.
Monthly prices continued to fluctuate over the years. However, a constant fall was observed between July 2022 and June 2023, with an exception in March 2023. The price went down from its peak 528 euro/tonne to much lower level 323 euro/tonne.
Development of prices for low and high quality secondary materials — paper and cardboard
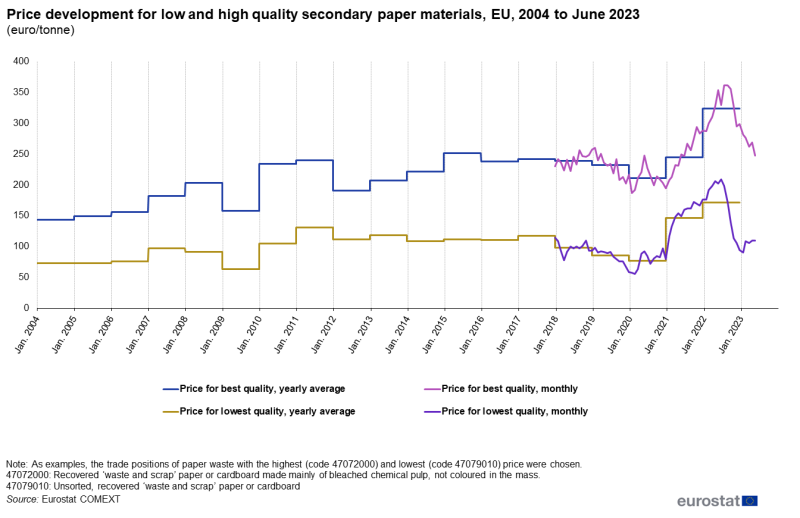
For paper and cardboard, more than one product is used for the calculation of the price indicator. The different codes describe secondary materials which may include industrial residues of high quality or separately collected waste. Figure 7 illustrates the difference in price and the corresponding development over time. As an example, the trade positions of paper and cardboard waste with the highest (code 47072000) and lowest (code 47079010) price were chosen.
Source: Eurostat COMEXT
Since January 2021 until July 2022, prices for low and high quality secondary paper and cardboard materials regularly increased each month with few exceptions. They reach a high point in July 2022 for low quality materials at 209 euro/tonne and in August 2022 for high quality materials at 361 eurouro/tonne.
The difference in price between the lowest and highest quality secondary paper and cardboard remained constant, with the prices for the two qualities developing roughly in parallel. The observation of trade volumes provides a similar picture. Therefore, it is reasonable to calculate only one price indicator for paper.
Average price indicator and trade flows
Trends in material prices and trade flows can give some additional information about the recycling economy.
Glass
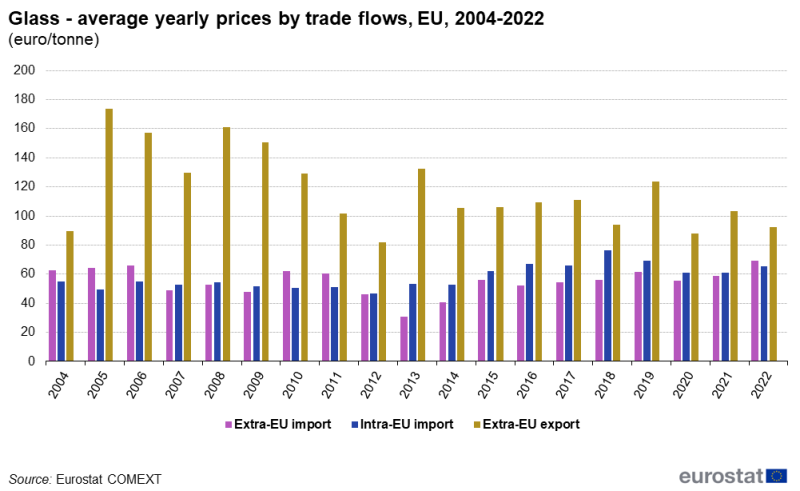
Glass is a heavy and low-cost material. A consequence is that transport costs constitute a considerable share of the total costs when trading in waste glass. Hence, the trade volume is low in comparison with the overall recycling volume. In addition, most trade takes place between neighbouring countries, limiting the transport distances and transport costs, thus extra-EU export volumes are also low.
For paper and cardboard, and plastic, the data show a more complex picture.
Paper
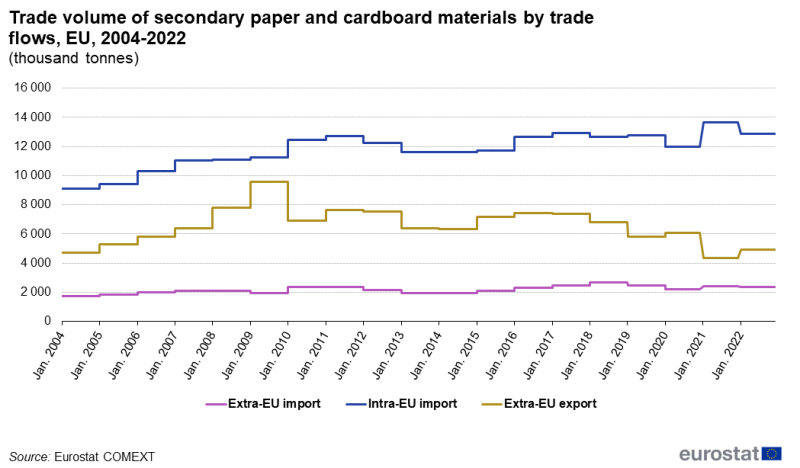
Figure 9 shows the EU trade volume of secondary paper and cardboard materials according to trade flows. For paper and cardboard materials, intra-EU trade increased from 9.08 million tonnes in January 2004 to 13.67 million tonnes in December 2021. In the period 2013-2015, intra-EU trade volume fell below 12 million tonnes per year. Then it stabilised at around 12.7-12.9 million tonnes per year in the period 2016-2019. In 2020, intra-EU trade volume fell below 12 million tonnes before rebounding to 13.67 million tonnes in 2021 and then felling again to 12.85 million tonnes in 2022. Extra-EU export volumes for secondary paper and cardboard materials are relatively fewer and stable. Extra-EU exports grew strongly from just 4.71 million tonnes/year in 2004 to close to 9.59 million tonnes/year in 2009. However, this dropped to between 6 and 7 million tonnes/year in the period 2010-2020. In 2021 and 2022, the volume of paper and cardboard waste exported to countries outside the EU fell below 5 million tonnes.
Source: Eurostat COMEXT
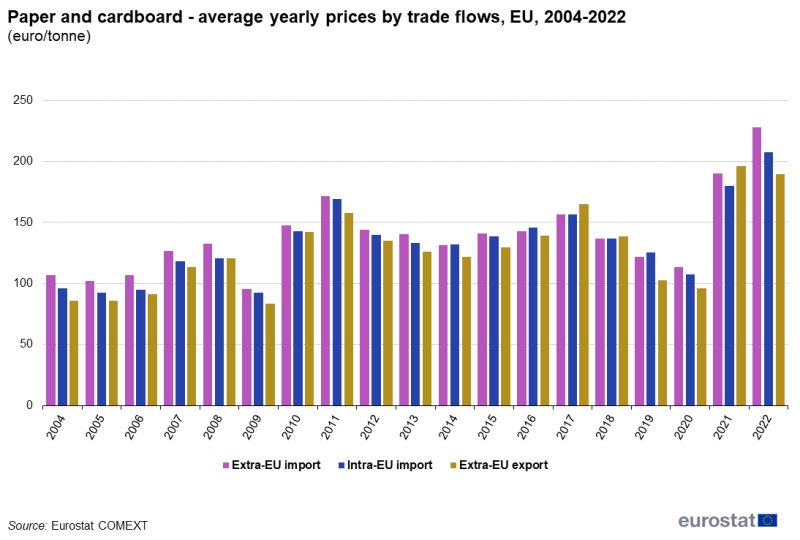
The price indicator for secondary paper and cardboard materials in the EU by trade flow, is shown in Figure 10. The prices of all three categories show similar trends. Due to the inclusion of transport costs, import prices tend to be higher than export prices with few exceptions during the period 2017-2022.
Source: Eurostat COMEXT
Plastic
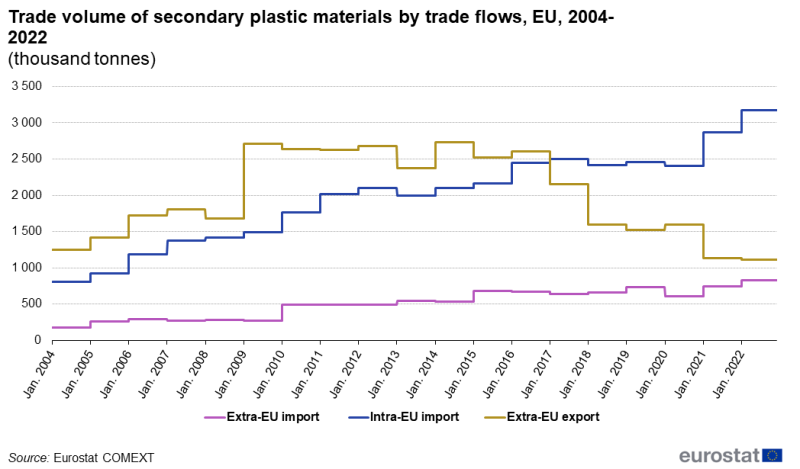
The developments of the trade flows for secondary plastic materials are shown in Figure 11. The overall trend doesn't look similar to that of secondary paper and cardboard materials in Figure 9. Extra-EU imports of plastic waste amounted to approximately 179 000 tonnes in 2004 and rose to 735 000 tonnes in 2019, this dropped to 610 000 tonnes in 2020 before rebounding to 741 000 tonnes in 2021 and reaching its peak at 826 000 tonnes in 2022. From 2009 to 2010, the volumes imported from outside the EU almost doubled, reaching 487 000 tonnes in 2010. A steep increase with few exceptions was also observed from 2011 (494 000 tonnes) to 2015 (685 000 tonnes). Intra-EU trade in secondary plastic materials stood at approximately 806 000 tonnes in 2004 and increased to more than 3 million tonnes by 2022. Extra-EU exports rose from 1.25 million tonnes in 2004 to around 2.7 million tonnes in 2009, more than doubling over that period. However, the exports of secondary plastic materials fell sharply to 2.156 million tonnes in 2017 and continued this steep fall to 1.522 million in 2019 and 1.13 million in 2021. This reflected the decision of China, as of 1 January 2018, to ban imports of secondary plastic materials, among several categories of solid secondary materials. In 2022, it continued to decrease and recorded its minimum at 1.11 million.
Source: Eurostat COMEXT
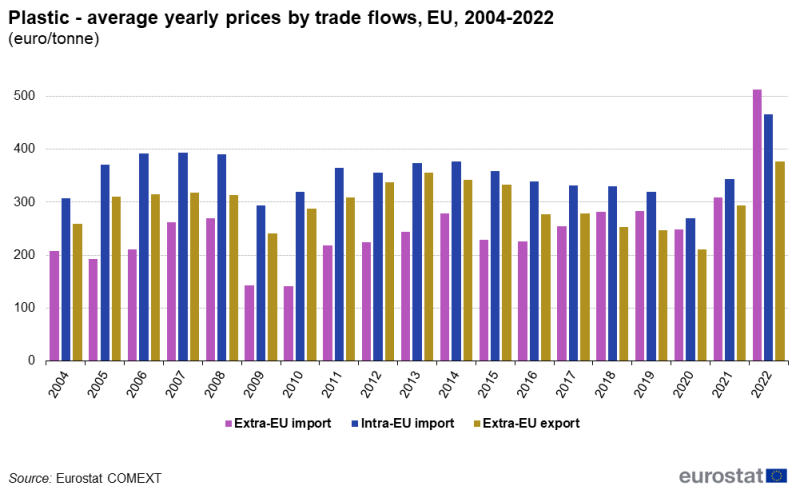
The development of the specific price of secondary plastic materials by trade flow is shown in Figure 12. The trend is quite different from that of paper. The higher price seen in the intra-EU trade of secondary plastic materials suggests that the quality of this material was better than that imported to or exported from the EU. The price slumped for all three-trade flows in 2009 and 2010, in connection with the international financial and economic crisis, but recovered from 2011 onwards. The announcement of China’s decision to stop importing plastic waste and a number of other solid waste categories from the end of 2017 led to a sharp fall in extra-EU export prices in 2018. The price of extra-EU exports fell to 254 euro/tonne in 2018, falling below the price of extra-EU imports (282 euro/tonne) for the first time. By 2019, the extra-EU export price had fallen to 247 euro/tonne, almost equalling the bottom level seen in 2009 (240 euro/tonne) at the height of the economic crisis. In 2020, the price of plastic hit a new low at 211 euro/tonne for extra-EU exports and 248 euro/tonne for extra-EU imports. The price rebounded through 2021 to 294 for extra-EU exports and 310 euro/tonne for extra-EU imports and peaked at 377 euro/tonne for extra-EU exports and 512 euro/tonne for extra-EU imports in 2022.
Conclusion
The presented trade figures allow valuable insights for the implementation of the European thematic strategies on resources, waste prevention and recycling and for the circular economy. Assessing the international trade in goods data with the same methodology by country of origin and destination would provide an even more detailed insight.
The European market has a big trade surplus and the intra-EU trade is in development. The pandemic didn't affect the trade of secondary materials.
On 1 January 2018, China's import ban for certain waste materials came into effect. As a result, EU exports have almost halved. The remaining exports have shifted to other countries.
Source data for tables and graphs
Data sources and availability
Eurostat’s International trade in goods statistics is the data source for the presented indicators. The following paragraphs detail the international trade in goods statistics codes considered for the different waste categories.
Glass secondary materials
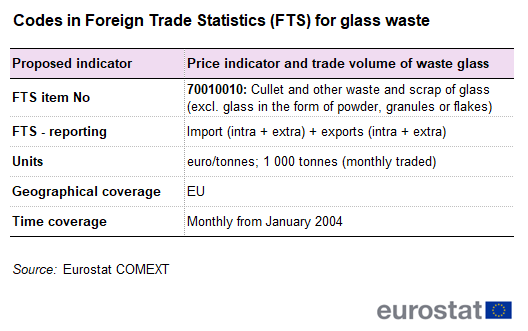
Glass materials are reported in international trade in goods statistics under one code: 70010010 (see Table 1). Please take note that the code 'glass cullets' also contains some industrial material.
Paper and cardboard secondary materials
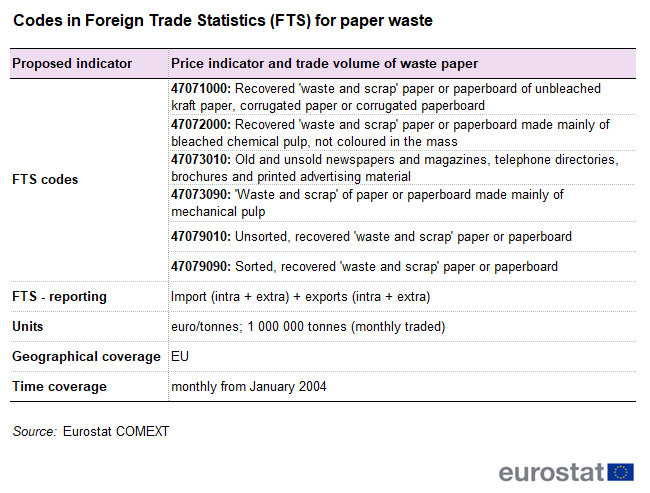
Paper and cardboard materials are reported in international trade in goods statistics under six codes (see Table 2). It reports three fractions of mostly industrial waste (47071000, 47072000, 47073090) and three fractions covering waste paper and cardboard collected and sorted. As all fractions are covered by the Waste Statistics Regulation, we take all six products into account for the indicator.
Plastic secondary materials
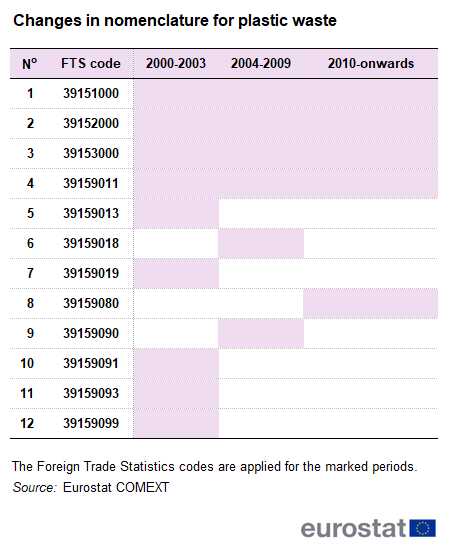
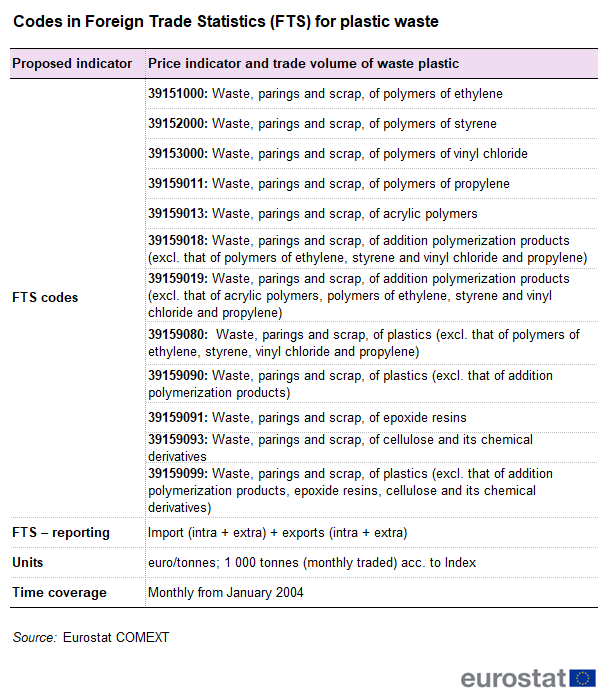
Plastic materials are reported in international trade in goods statistics under nine codes from 2000 to 2003, under six codes from 2004 to2009 and five codes from 2010 onwards (see Table 3 and Table 4). In 2004, the nomenclature changed and some codes were combined. In 2010, two codes were merged to one new code. Table 3 shows the years in which data is reported under which code. Numbers 5 and 7 in the table are combined to the new position number 6. Additionally, the positions number 10, number 11 and number 12 are combined to the new position number 9. In 2010, the codes number 6 and number 9 are merged to number 8.
Inflation The article compares the increase of prices in 2022 with inflation. Inflation data is derived from the table Harmonized index of consumer prices (HICP) – inflation rate on Eurostat’s online database.
Context
The price indicator sums up all value (in euro) and volume (in tonnes) of all relevant international trade in goods codes. Value divided by volume gives the specific price indicator (in euro/tonne)
Value and volume are extracted from international trade in goods statistics as intra-EU and extra-EU trade for import, extra-EU for export. The price indicator is shown as monthly data or yearly average data.
The total volume of the traded secondary materials (import plus export) is shown as an additional indicator. This indicator (tonnes/month) shows the market activity and covers intra- and extra- trade in the EU. This indicator is shown as monthly data (tonnes/month) for a month or the yearly average (12 times tonnes/month).
International trade in goods statistics are published monthly, with a delay of approximately 2.5 months.
The United Kingdom is considered as an external partner country of the EU for the whole period covered by this article. However, the United Kingdom was still part of the internal market until the end of the transition period (31 December 2020), meaning that, data on trade with the United Kingdom were still based on statistical concepts applicable to trade between the EU Member States. Consequently, while imports from any other extra-EU trade partner are grouped by country of origin, the United Kingdom data reflect the country of consignment. In practice, this means that the goods imported by the EU from the United Kingdom were physically transported from the United Kingdom but part of these goods could have been of other origin than the United Kingdom. For this reason, data on trade with the United Kingdom are not fully comparable with data on trade with other extra-EU trade partners.
Direct access to
All publications on waste issued by Eurostat.
- Intra-EU trade (or Intrastat)- Regulation (EC) No 638/2004 of the European Parliament and of the Council of 31 March 2004 on Community statistics relating to the trading of goods between EU Member States and repealing Council Regulation (EEC) No 3330/91 and Commission Regulation (EC) No 1982/2004 of 18 November 2004 implementing Regulation (EC) No 638/2004.
- Extra-EU trade (or Extrastat)- Regulation (EC) No 471/2009 of the European Parliament and of the Council of 6 May 2009 on Community statistics relating to external trade with non-member countries and repealing Council Regulation (EC) No 1172/95, Commission Regulation (EU) No 113/2010 of 9 February 2010 implementing Regulation (EC) No 471/2009 of the European Parliament and of the Council on Community and Commission Regulation (EU) No 92/2010 of 2 February 2010 implementing Regulation (EC) No 471/2009 of the European Parliament and of the Council on Community.
- Combined Nomenclature- Regulation (EC) No 638/2004 of the European Parliament and of the Council of 31 March 2004 on Community statistics relating to the trading of goods between EU Member States and repealing Council Regulation (EEC) No 3330/91 and Council Regulation (EEC) No 2658/87 of 23 July 1987 on the tariff and statistical nomenclature and on the Common Customs Tariff and Commission Implementing Regulation (EU) 2021/1832 of 12 October 2021 amending Annex I to Council Regulation (EEC) No 2658/87 on the tariff and statistical nomenclature and on the Common Customs Tariff.
- Regulation (EC) No 2150/2002 of the European Parliament and of the Council of 25 November 2002 on waste statistics
