Archive:Social protection statistics - financing
Data extracted in April 2020.
Planned article update: June 2022.
Highlights
In 2017, social protection receipts were equivalent to 29.2 % of GDP in the EU-27.
In 2017, social contributions were nearly three fifths (58.3 %) of all social protection receipts in the EU-27.
Social protection receipts relative to GDP, 2017
This article presents statistics on social protection receipts in the European Union (EU). These receipts are transactions whose purpose is to finance the provision of social protection benefits, the latter being transfers to households, in cash or in kind, intended to relieve them of the financial burden of, for example, disability/sickness, old age, family/children, unemployment, housing or social exclusion. The data are collected through the European system of integrated social protection statistics (ESSPROS).
Full article
Social protection receipts in the EU
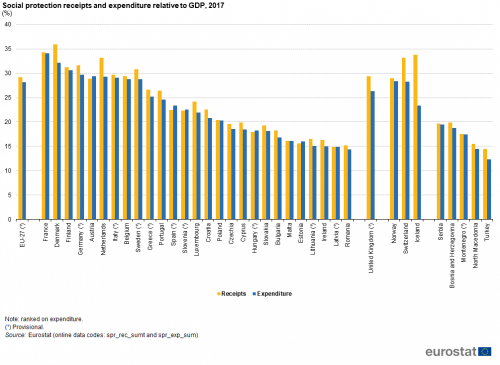
In the long term, social protection receipts are expected to balance with social protection expenditure, but this is not necessarily the case in the short or medium term. Indeed, receipts exceeded expenditure each year from 2008 to 2017 across the EU-27. In 2017 (the latest year for which data are available), the difference was 1.0 % of GDP.
Social protection receipts in the EU-27 represented 29.2 % of GDP in 2017, which was 0.2 % of GDP less than in 2016. In 20 EU Member States, receipts exceeded expenditure (see Figure 1) in 2017: the largest gaps — with higher levels of receipts — were recorded in the Netherlands (3.9 % of GDP) and Denmark (3.7 % of GDP). Among the non-member countries shown in Figure 1, receipts exceeded expenditure in each case, with the gaps in Iceland (10.4 % of GDP) and Switzerland (4.9 % of GDP) larger than in any of the Member States. By contrast, among the five EU Member States where social protection expenditure was greater than receipts, the gap was never greater than 1.0 % of GDP, as recorded in Spain, where expenditure represented 23.4 % of GDP compared with 22.4 % for receipts. Note that there was no difference between these two ratios (they were balanced) in Latvia and Malta.
There is no common financing structure for social protection across the EU Member States or even across social protection schemes within a country. The data presented here for the EU-27 aggregate and for individual Member States provide a general overview of the situation but do not necessarily reflect the financing structure of individual social protection schemes at a more detailed level. That said, one of the most useful aspects of data on social protection receipts is that they may be used to identify the means by which social protection is financed. The analysis presented in the rest of this article illustrates two ways in which this can be undertaken, either through an analysis of the type of receipts or the sector of their origin.
(%)
Source: Eurostat (spr_rec_sumt) and (spr_exp_sum)
Types of social protection receipts
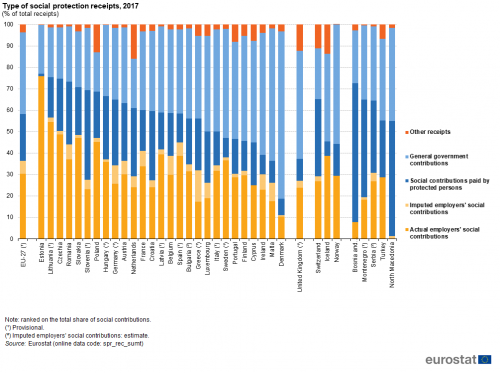
In 2017, social protection receipts in the EU-27 were predominantly composed of social contributions (58.3 %); these are transfers which are made with the explicit purpose of securing entitlement to social benefits (see Figure 2). Social contributions can be analysed in more detail as they are composed of contributions paid by employers (for the benefit of employees, former employees and their dependants) and contributions paid by protected persons (individuals and households). In 2017, the share of EU-27 total receipts that were financed by employer contributions was higher than one third (36.3 %), while protected persons contributed more than one fifth (22.0 %) to total receipts. Employers’ social contributions can be further subdivided into actual and imputed social contributions. The former are payments to insurers to secure entitlement to benefits while the latter are costs incurred by employers as a result of providing eligibility to social benefits without an autonomous insurer or by maintaining separate reserves in their balance sheets. Across the EU-27 actual contributions accounted for 30.4 % of total receipts and imputed contributions for 6.0 %.
The second largest component of EU-27 social protection receipts in 2017 was general government contributions (38.2 % of total receipts); these consist of costs incurred by general government for government-controlled non-contributory social protection schemes and financial support provided by general government to other resident schemes. The final component concerned other receipts, which include property income, gifts, proceeds of private lotteries and insurance claims; they provided a relatively small contribution to total receipts in the EU-27 (3.6 %).
(% of total receipts)
Source: Eurostat (spr_rec_sumt)
The structure of receipts used to finance social protection varies considerably between countries. Three groups can be identified when analysing the results for 2017 (see Table 1). A first group of six EU Member States is composed of those where government contributions made up the largest component of receipts. The share of general government contributions in total receipts peaked at more than three quarters in Denmark (77.8 %), while there were three additional Member States where the share of general government contributions was more than half: Malta, Ireland and Sweden; the final two Member States in this cluster were Cyprus and Finland.
Aside from these six, social contributions accounted for the highest share of social protection receipts in the remaining EU Member States and usually provided more than half of all receipts, the only exception being Portugal. The share of social contributions in total receipts peaked at more than three quarters (77.0 %) in Estonia, while this ratio was also higher than two thirds in Lithuania, Czechia, Romania, Slovakia, Slovenia, Poland and Hungary. The cluster of Member States where social contributions were the largest component can be subdivided into a group of 11 Member States where employers’ contributions (actual or imputed) accounted for at least 65 % of all social contributions (Belgium, Czechia, Estonia, Spain, France, Italy, Latvia, Lithuania, Poland, Portugal and Slovakia) and a final group of 10 Member States where employers’ contributions accounted for less than 65 % of all social contributions (Bulgaria, Germany, Greece, Croatia, Hungary, Luxembourg, the Netherlands, Austria, Romania and Slovenia).
Other receipts tended to account for a relatively small share of social protection receipts. In 2017, they only contributed more than 10 % of total receipts in the Netherlands and Poland.
Among the non-member countries shown in Table 1, in Switzerland, Montenegro, North Macedonia, Serbia, Turkey, and Bosnia and Herzegovina social contributions accounted for a majority of the receipts with less than 65 % of all social contributions coming from employers, whereas this share was above 85% in Iceland. In the United Kingdom and Norway, government contributions were the largest component of total social protection receipts. In Iceland, the United Kingdom and Switzerland, more than 10 % of total receipts were other receipts.
Note that the relative importance of different types of social protection receipts is likely to be influenced by numerous factors including the forms of social protection benefits provided (for example the function and type of benefits) and the distribution of benefits between different categories of social protection schemes (for example between government and non-government schemes, or between contributory and non-contributory schemes).
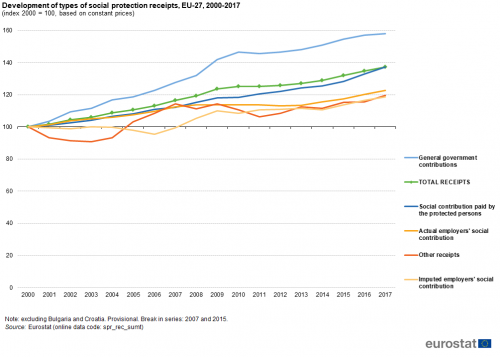
Between 2000 and 2017, the value of EU social protection receipts increased overall by 37.2 % in constant price (or real) terms (see Figure 3). Note that this time series excludes information for Bulgaria and Croatia (for which information for the earlier years is not available). While there was a real increase in the value of all types of receipts during the period under consideration, the main driver of these developments was general government contributions, which increased overall by 58.1 %. This rapid increase led to the share of government contributions in total receipts increasing (in real terms) from 33.1 % in 2000 to 38.1 % by 2017. During the same period, the share of social contributions paid by protected persons remained stable (at 21.9 %) and the shares for the other types of receipts fell.
(index 2000 = 100, based on constant prices)
Source: Eurostat (spr_rec_sumt)
Sectors of origin of social protection receipts
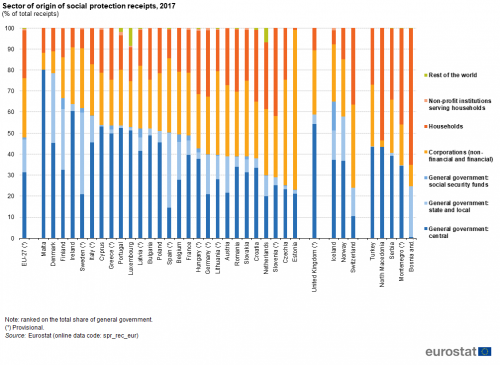
In 2017, social protection receipts in the EU-27 mainly originated from the general government sector (47.9 %), while smaller shares were attributed to corporations (28.2 %) and households (22.8 %). Less than 1.0 % of the total receipts in the EU-27 were derived from non-profit institutions serving households (NPISHs) or from the rest of the world (for example, non-resident units).
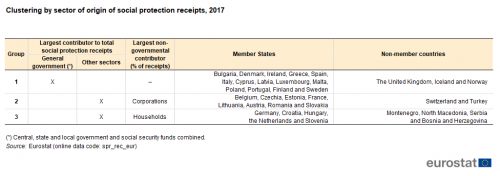
The structure of receipts by sector of origin varied considerably between the EU Member States as can be seen in Figure 4. By focusing on the distribution of receipts between general government and non-government sectors and then between corporations and households, it is possible to identify three distinct groups/clusters, as shown in Table 2.
A first group of 14 EU Member States (Bulgaria, Denmark, Ireland, Greece, Spain, Italy, Cyprus, Latvia, Luxembourg, Malta, Poland, Portugal, Finland and Sweden) comprised those in which an absolute majority (at least 50.0 %) of receipts in 2017 originated from the general government sector (central government, state and local government, or social security funds). Among these, receipts from general government constituted more than three quarters of total receipts in Malta (80.0 %) and Denmark (78.4 %), a far greater share than in the other Member States: Finland had the next highest share (66.6 %).
This large cluster of EU Member States may be subdivided based on the relative significance of the different government sectors. In most cases the highest proportion of receipts from the government sector were derived from central government but in two of the Member States — Spain and Sweden — the highest share of receipts from the government sector could be attributed to state and local government.
The 13 EU Member States where receipts from corporations or households together made up the largest contribution to social protection receipts in 2017 could be divided into two groups. There were eight — Belgium, Czechia, Estonia, France, Lithuania, Austria, Romania and Slovakia — where corporations provided the highest share of social protection receipts. In these eight, corporations were the source for at least 30 % of total receipts, with this share reaching 50.2 % in Czechia and 76.0 % in Estonia. Corporations also provided at least 30 % of total receipts in Spain (35.1 %) and the Netherlands (31.4 %), although the former’s state and local government sector (35.4 %) and the latter’s households sector (31.9 %) were the largest contributors to their total receipts.
In the final group of five EU Member States — Germany, Croatia, Hungary, the Netherlands and Slovenia — households contributed the largest share of total receipts in 2017. At least 30 % of total receipts in all five of these Member States was derived from households, with this share peaking at 41.9 % in Slovenia.
Among the non-member countries, in Iceland, the United Kingdom and Norway the general government sector was the largest source of social protection receipts, with this sector’s share reaching 64.9 % in Iceland. Corporations provided the largest share of receipts in Switzerland (39.6 %). Corporations were also the largest non-governmental contributor in Turkey (29.3 %), although this was less than the share of central government (43.5 %). In Montenegro, North Macedonia, Serbia, and Bosnia and Herzegovina, the household sector was the largest non-governmental contributor, its share reaching 64.7 % of total receipts in Bosnia and Herzegovina.
Source: Eurostat (spr_rec_eur)
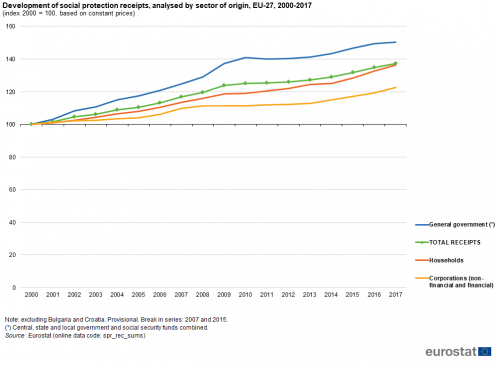
As already noted, from 2000 to 2017 the value of EU social protection receipts increased overall by 37.2 % when measured in constant price (or real) terms (see Figure 5); note again that the time series excludes information for Bulgaria and Croatia. Receipts from the three main sectors of origin — general government, corporations and households — increased during the period under consideration. The highest growth was recorded for the general government sector, where social protection receipts increased overall by 50.4 %.
(index 2000 = 100, based on constant prices)
Source: Eurostat (spr_rec_sums)
Cross-analysis of types and sectors of origin of social protection receipts
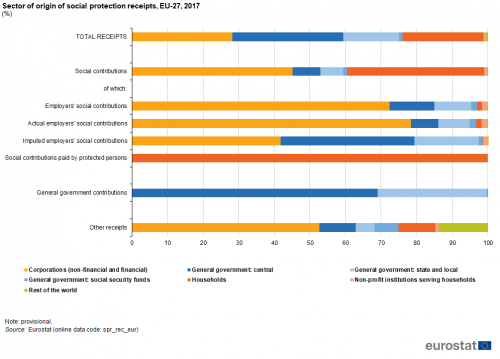
An analysis of receipts by type and by sector is shown in Figure 6. Note that certain types of receipts can only originate from specific sectors of origin. For example, social contributions that are made by protected persons can only originate from households (including a tiny proportion from non-resident households). Equally, general government contributions can only be made by the various types of government. In 2017, the proportion of EU-27 receipts derived from the general government sector (47.9 %) exceeded the proportion of receipts classified as general government contributions (38.2 %) by just less than 10 percentage points. This can be explained by the fact that the general government is an employer, which also pays social contributions on behalf of its employees. Indeed, the analysis of receipts by type and by sector of origin shows that more than one seventh of all social contributions (15.4 %) and more than one fifth of other receipts (22.2 %) originated from the government sector (central, state and local or social security funds).
(%)
Source: Eurostat (spr_rec_eur)
Source data for tables and graphs
Data sources
All of the data presented in this article are from the European system of integrated social protection statistics (ESSPROS), specifically from the core system. These data are collected from national statistical institutes and/or ministries of social affairs and are generally compiled from administrative sources.
Regulation (EC) No 458/2007 of the European Parliament and of the Council provides the legal basis for the collection of the data. A series of Commission Regulations provide further specifications for the implementation of this Regulation.
Data on social protection are collected with reference to each social protection scheme, which is the statistical unit that is used by ESSPROS. For each scheme, data are compiled for both sides of the balance sheet, in other words, in relation to the receipts that are financing a scheme, as well as the expenditure (or costs) incurred by each scheme for the provision of social benefits (directly by the scheme or via transfers to other schemes) plus its administration costs.
The main reason why expenditure and receipts may not balance is because the relevant amounts are recorded on an accruals basis, in other words, at the time that the events creating the related claims and liabilities occur. For a given period, the events underlying transactions for expenditure and receipts are not necessarily related, for example, unemployment benefits (expenditure) are paid out in relation to specific periods of unemployment while social contributions (receipts) are generally made in relation to periods of employment. However, for some social protection schemes, expenditure and receipts may balance because contributions from general government are used, on an annual basis, to either finance a scheme in full or to finance the gap between expenditure and receipts from other sources.
The balance between receipts and expenditure at scheme level is influenced not only by the mode of financing used but also by the phase of implementation. For example, consider pension schemes funded by contributions. Recently introduced pension schemes are liable to have more receipts than expenditure as they accumulate funds for the disbursement of social benefits in the future. On the other hand, older pension schemes that are in the process of being phased-out are liable to have more expenditure than receipts as pensions are in the process of being disbursed to a relatively high number of pensioners while those contributing may be relatively few.
Context
The open method of coordination for social protection and social inclusion (Social OMC) aims to promote social cohesion and equality through adequate, accessible and financially sustainable social protection systems and social inclusion policies. Through the Social OMC — and in collaboration with the Social Protection Committee — the EU provides a framework for national strategy development for social protection and social investment, as well as for coordinating policies between EU Member States on issues relating to: poverty and social exclusion, health care, long-term care, pensions, and access to social protection.
The organisation and financing of social protection systems is the responsibility of each of the EU Member States. Nevertheless, the European Commission provides guidance to Member States to modernise their welfare systems through the social investment package.
Direct access to
- Social protection statistics - overview
- Social protection statistics — background
- Social protection statistics — family and children benefits
- Social protection statistics — net expenditure on benefits
- Social protection statistics — pension expenditure and pension beneficiaries
- Social protection statistics — social benefits
- Social protection statistics — sickness and health care benefits
- Social protection statistics — unemployment benefits
- Publications on social protection
- Share of EU GDP spent on social protection slightly down — News release, 22 November 2019
- Social protection (spr), see:
- Social protection expenditure (spr_expend)
- Social protection receipts (spr_receipts)
- Pensions beneficiaries (spr_pension)
- Net social protection benefits (spr_net_ben)
- Compendium of methodological clarifications — ESSPROS, European system of integrated social protection statistics — 2017 edition
- European system of integrated social protection statistics — ESSPROS — 2019 edition
- Social protection methodology
- Social protection (spr) (ESMS metadata file — spr_esms)
- Regulation (EC) No 458/2007 of 25 April 2007 on the European system of integrated social protection statistics (ESSPROS).
- Regulation (EC) No 1322/2007 of 12 November 2007 implementing Regulation (EC) No 458/2007 of the European Parliament and of the Council on the European system of integrated social protection statistics (ESSPROS) as regards the appropriate formats for transmission, results to be transmitted and criteria for measuring quality for the ESSPROS core system and the module on pension beneficiaries.
- Regulation (EC) No 10/2008 of 8 January 2008 implementing Regulation (EC) No 458/2007 of the European Parliament and of the Council on the European system of integrated social protection statistics (ESSPROS) as regards the definitions, detailed classifications and updating of the rules for dissemination for the ESSPROS core system and the module on pension beneficiaries.
- Summaries of EU legislation: European system of integrated social protection statistics (ESSPROS)

