Archive:European Neighbourhood Policy - East - agriculture statistics
Data extracted in January 2022.
Planned article update: March 2023.
Highlights
In 2020, the contribution of agriculture, forestry and fisheries to total gross value added in the ENP-East countries varied between 12.3 % in Armenia and 7.7 % in Azerbaijan, compared to 1.8 % in the EU.
In Georgia, employment in agriculture, forestry and fisheries as a share of total employment fell from 48.0 % in 2010 to 19.8 % in 2020, but rose from 10.4 % in 2010 to 10.9 % in 2020 in Belarus.
In 2020, Ukraine produced almost five times as much cereals (excluding rice) for the production of grain (including seed), around three times as much potatoes and more than 13 times as much oilseeds than the other five ENP-East countries together.
Employment in agriculture, forestry and fishing, 2010 and 2020
This article is part of an online publication and provides a description of the agriculture, forestry and fishing sector in the European Union (EU) and in the six countries that together form the European Neighbourhood Policy-East (ENP-East) region, namely, Armenia, Azerbaijan, Belarus, Georgia, Moldova and Ukraine. Data shown for Georgia exclude the regions of Abkhazia and South Ossetia over which Georgia does not exercise control and the data shown for Moldova exclude areas over which the government of the Republic of Moldova does not exercise control. Since 2014, data for Ukraine generally exclude the illegally annexed Autonomous Republic of Crimea and the City of Sevastopol and the territories which are not under control of the Ukrainian government.
The article focuses on several aspects: the contribution of agriculture, forestry and fishing to the total economy (in terms of gross value added and employment), the production of cereals, livestock populations, meat production and international trade in food and live animals.
Full article
Gross value added and employment
Between 2010 and 2020, the gross value added and employment shares of the agriculture, forestry and fishing sector generally declined in the ENP-East countries (subject to data availability), although there were increases in the value added shares in Ukraine and Azerbaijan and in the employment shares in Belarus. These activities continued to account for a relatively high proportion of total economic activity in the ENP-East countries. In 2020, the output of agriculture, forestry and fishing ranged from 7.7 % of total gross value added in Azerbaijan to 12.3 % in Armenia. In the other ENP-East countries, the shares were 11.0 % in Moldova, 10.8 % in Ukraine, 8.4 % in Georgia and 7.8 % in Belarus. In the EU, the share was substantially lower, accounting for 1.8 % in 2020 (see Figure 1).
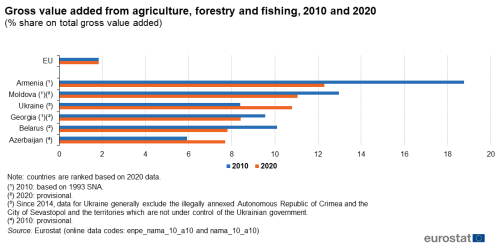
(% share on total gross value added)
Source: Eurostat (enpe_nama_10_a10) and (nama_10_a10)
In 2020, the share of employment in the agriculture, forestry and fishing sector in the total workforce was 10.9 % in Belarus, the lowest proportion among the ENP-East countries. In Ukraine and Georgia, the proportion of the workforce employed in this sector was lower than 20 % in 2020 (14.1 % and 19.8 %, respectively). In Moldova and Armenia, the share reached 21.1 % and 22.1 %, respectively, in 2020, while more than one third of the workforce was employed in this sector in Azerbaijan (36.3 %). Thus, the proportion of people working in agriculture, forestry and fishing in Azerbaijan was nine times as high as in the EU, where 4.0 % of the working population were employed in these activities (see Figure 2).
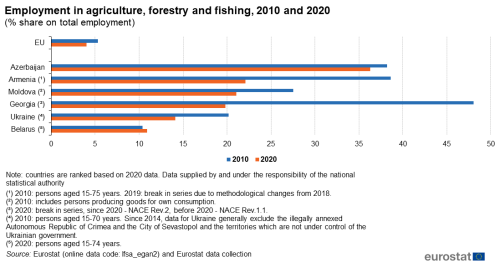
(% share on total employment)
Source: Eurostat (lfsa_egan2) and Eurostat data collection
Land use
The area within each country that is used for farming varies according to climate, terrain and soil type, while the level of economic development and population density may also play a role in determining land use.
The proportion of land that is given over to agriculture was nearly 70 % of the total area of Armenia and Ukraine in 2020 (see Figure 3). This was particularly noteworthy in Ukraine which is a relatively large country in terms of its total area: indeed, some 41 million hectares of land were used for agricultural activities in Ukraine, equivalent to just above one quarter of the total utilised agricultural area of the EU. In Azerbaijan and Belarus, the proportion of land attributed to agriculture reached 55 % and 40 %, respectively. There is no data available for Georgia and Moldova. All ENP-East countries for which data is available had higher shares than the proportion observed in the EU. Within the EU, more than 38 % of the total area were used in 2020 for farming and for forest and woodland, with the remainder of the land being built-up areas (villages, towns and cities), infrastructure (such as roads or railways), scrub or waste land.
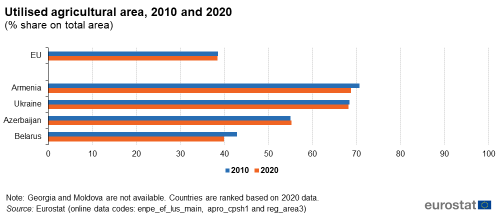
(% share on total area)
Source: Eurostat (enpe_ef_lus_main), (apro_cpsh1) and (reg_area3)
Crop production
Plants need sunlight, water, healthy soils, air and heat to grow. Thus, crop production is particularly sensitive to the weather and climatic conditions at key times of the growing season, with temperature and precipitation (rainfall) of particular significance for yields and production levels. Extreme weather events, in terms of e.g. frosts, droughts or floods can also have substantial impact on production. The meteorological conditions and the utilised agricultural area (UAA) dedicated to the crops in question should be taken into consideration when comparing crop production in different years.
Compared to the other ENP-East countries, Ukraine had by far the highest production of cereals (excluding rice) for the production of grain (including seed), at 64.3 million tonnes in 2020; of potatoes, at 20.8 million tonnes; and of oilseeds, at 18.5 million tonnes (see Table 1). When comparing to 2010, the production of cereals in Ukraine had increased by 67 % in 2020, while the production of oilseeds almost doubled (+84 %). The production of potatoes also increased, but to a lesser extent (+11 %). However, production varied considerably from year to year. Over the period 2010 to 2020, Ukraine's production of cereals ranged from a low of 38.5 million tonnes (2010) to a peak of 74.4 million tonnes (2019), with an average production of 59.9 million tonnes. For potatoes, the production level ranged from 18.7 million tonnes (2010) to 24.2 million tonnes (2011) with an average of 21.9 million tonnes. For oilseeds, the peak in Ukrainian production in this period was at 22.3 million tonnes (2019) and the low at 10.0 million tonnes (2010). The average production of oilseeds in Ukraine 2010-2020 was 16.7 million tonnes.
Belarus also reported a large increase in the production of oilseeds to 771 000 tonnes (+97 %) and cereals to 8.8 million tonnes (+26 %) in 2020 compared to 2010. However, in the same period, the production of potatoes dropped substantially, to 5.2 million tonnes (-33 %).
Armenia (wheat, rye and barley only) and Georgia were the smallest producers of cereals among the ENP-East countries in 2020, each recording output below half a million tonnes. Production of cereals in Armenia decreased substantially in 2020 compared to 2010 (-26 %), while in Georgia it increased substantially (+89 %).
These two countries plus Moldova were also the smallest producers of potatoes among the ENP-East countries in 2020. All of these three countries registered drops in the production of potatoes between 2010 and 2020, especially in Moldova (-39 %).
Azerbaijan was the only country, together with Ukraine, to register increases in the production of cereals, of potatoes and of oilseeds from 2010 to 2020. In particular, the production of cereals increased in Azerbaijan by 62 % and the production of oilseeds by 55 %.
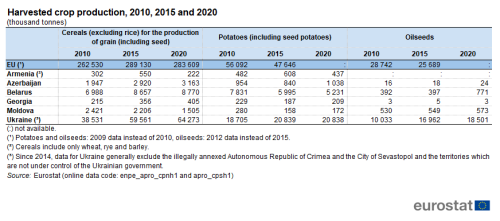
(thousand tonnes)
Source: Eurostat (enpe_apro_cpnh1) and (apro_cpsh1)
Livestock: population structure and production
The structure of livestock populations in the ENP-East countries is presented in Figure 4. Collectively, there were more cattle than pigs in the ENP-East countries in 2020, while in the EU the opposite was observed. Farmers in Belarus were specialised in raising cattle (59 % of total livestock), while in Azerbaijan the most common form of livestock was sheep (70 %). In Georgia, the number of cattle was similar to the number of sheep (around 45 % for both). In Armenia, the number of sheep was slightly higher than the number of cattle (45 % and 40 %, respectively). Moldova (no data for sheep and goats) and Ukraine reported a higher number of pigs (76 % and 59 %, respectively). Azerbaijan had the highest share of goats among the ENP-East countries, closely followed by Ukraine (6 % and 5 %, respectively). Some of these differences between countries may reflect religious or cultural practices.
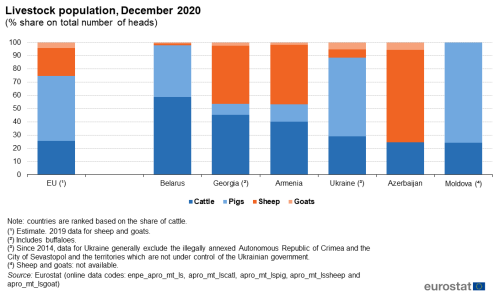
(% share on total number of heads)
Source: Eurostat (enpe_apro_mt_ls), (apro_mt_lscatl), (apro_mt_lspig), (apro_mt_lssheep) and (apro_mt_lsgoat)
The structure of animal output — as measured by the quantity of slaughtered production — differs from the structure of the animal populations, in large part because a proportion of cattle, sheep and goats are reared for milk rather than for meat. In Armenia and Azerbaijan, cattle accounted for the highest quantity of slaughtered production in 2020, while in Moldova the largest quantity came from pigs and in Belarus, Georgia and Ukraine from poultry (see Table 2).
Compared to 2010, the levels of poultry slaughtering increased substantially in all ENP-East countries, the most noticeably for Armenia, Georgia and Belarus where it more than doubled in the period to 2020 (+133 %, +109 % and +107 %, respectively). The quantity of slaughtered pigs also increased substantially in 2020 compared to 2010 in most of the ENP-East countries. The exceptions were Azerbaijan, where the very small quantity decreased further (from 800 tonnes to 500 tonnes), and Belarus where it remained relatively stable (+1 %). Regarding cattle, the situation was more balanced. In Georgia (-25 %), Moldova and Ukraine (both -19 %), the slaughtered production of cattle decreased substantially, while in Armenia (+43 %), Azerbaijan (+27 %) and Belarus (+11 %) it showed a positive trend.
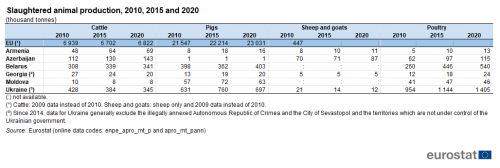
(thousand tonnes)
Source: Eurostat (enpe_apro_mt_p) and (apro_mt_pann)
Trade in food and live animals
The value of international trade in food and live animals has grown at a rapid pace over the last decade in most of the ENP-East countries. This may in part be due to increased prices, as the values shown in Table 3 are presented in current price terms. Fluctuating prices for raw and processed foodstuffs may have a considerable impact on the trade position of a country, while climatic conditions can affect yields and determine if there is a surplus of food for export.
When comparing exports and imports, Ukraine recorded a trade surplus for food and live animals throughout the period 2010-2020, rising from a surplus of €1.0 billion in 2010 to €8.3 billion in 2020, with a peak at €9.1 billion in 2019. Belarus also recorded a trade surplus throughout the period, with a peak at €1.8 billion in 2020. Moldova moved from recording a deficit between 2010 and 2013 to a surplus between 2014 and 2019 and a deficit was again observed in 2020. In contrast, Armenia, Azerbaijan and Georgia recorded trade deficits for food and live animals during the whole decade. When looking at the EU, a consistent trade surplus for food and live animals products was observed over the period 2010-2020; note that the trade data presented for the EU concern extra-EU trade and the trade data presented for the ENPE-East countries refer to imports/exports from/to all countries of the world.
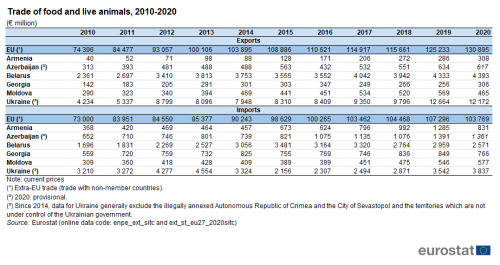
(€ million)
Source: Eurostat (enpe_ext_sitc) and (ext_st_eu27_2020sitc)
Collectively, the exports of food and live animals from ENP-East countries were valued at €18.3 billion in 2020, equivalent to 14.0 % of the value for the EU, while the value of imports of these goods to the ENP-East countries was €9.9 billion, equivalent to 9.6 % of the EU value.
The highest value of food and live animals exports among the ENP-East countries in 2020 was recorded in Ukraine (€12.2 billion). This was almost three times the value of exports from Belarus, which recorded the second highest value (€4.4 billion). Georgia and Armenia had the lowest values of food and live animals exports among the ENP-East countries in 2020, with €306 million and €308 million, respectively.
Exports of food and live animals from Armenia were almost eight times as high in 2020 as their level in 2010, while exports from Ukraine were three times as high (despite the change in geographical coverage for Ukraine), exports from Georgia more than doubled and exports from Azerbaijan and Belarus almost doubled. Exports from Moldova increased by 60 % between 2010 and 2020. For comparison, exports from the EU increased by 76 % in the same period.
Imports of food and live animals to Armenia and Azerbaijan more than doubled in 2020 compared to 2010, while imports to Moldova almost doubled. Imports to Belarus, Georgia and Ukraine increased by 52 %, 37 % and 20 % between 2010 and 2020, respectively. For comparison, imports of food and live animals to the EU increased by 42 % in the same period.
Source data for tables and graphs
Data sources
The data for ENP-East countries are supplied by and under the responsibility of the national statistical authorities of each country on a voluntary basis. The data presented in this article result from an annual data collection cycle that has been established by Eurostat. These statistics are available free-of-charge on Eurostat’s website, together with a range of different indicators covering most socio-economic areas.
The utilised agricultural area describes the area used for farming. It includes arable land, permanent grassland, permanent crops (such as orchards, olive trees and vineyards) and other agricultural land such as kitchen gardens.
Statistics on crop production relate to harvested production. Cereals include wheat (common wheat and spelt and durum wheat), rye, maslin, barley, oats, mixed grain other than maslin, grain maize, sorghum, triticale, and other cereal crops such as buckwheat, millet, canary seed and rice.
Meat production is based on the activity of slaughterhouses regarding meat fit for human consumption.
The data for the EU presented in this article come from Eurostat‘s online database, including trade data from Comext.
Tables in this article use the following notation:
| Value in italics | data value is forecast, provisional or estimated and is therefore likely to change; |
| : | not available, confidential or unreliable value. |
Context
Agriculture was one of the first sectors of the economy (following coal and steel) to receive the attention of EU policymakers, and statistics on agriculture were initially designed to monitor the main objectives of the Common agricultural policy (CAP). While the CAP remains one of the EU’s most important policies, it has undergone a widespread evaluation, which has led to a range of new objectives designed to correct imbalances and overproduction.
In December 2013, a reform of the CAP was formally adopted by the European Parliament and the Council. The main objectives of the CAP for the period 2014-2020 was to strengthen the competitiveness of the sector, promote sustainable farming and innovation, to support jobs and growth in rural areas and to move financial assistance towards the productive use of land.
In 2018, the European Commission presented legislative proposals for a new, reformed Common Agricultural Policy (CAP) beyond 2020. The reformed CAP should be key to helping the European Union achieving the objectives of the European Green Deal, and 40 % of the funds allocated to the CAP over the next 7-years programming period should be dedicated to actions contributing towards these.
The reformed CAP will help European farmers to contribute more decisively to tackling climate change, protecting the environment and moving to more sustainable and resilient food systems. It will generate economic opportunities for farmers and improve their position in the food supply chain, and better link support for farm income and rural areas to the take-up of sustainable models and practices.
For the years 2021-22, a transitional regulation (Regulation (EU) 2020/2220) is in force, extending and amending provisions set out in the preceding regulations. It will remain in force until the new framework of CAP strategic plans is implemented (due to begin on 1 January 2023).
On 2 July 2021, the European Commission and the EU High Representative for Foreign Affairs and Security Policy presented the Eastern Partnership: a Renewed Agenda for cooperation with the EU’s Eastern partners. This agenda is based on the five long-term objectives, with resilience at its core, as defined for the future of the Eastern Partnership in the Joint Communication Eastern Partnership policy beyond 2020: Reinforcing Resilience – an Eastern Partnership that delivers for all in March 2020. It is further elaborated in the Joint Staff Working Document Recovery, resilience and reform: post 2020 Eastern Partnership priorities. It will be underpinned by an Economic and Investment plan. The Joint Declaration of the Eastern Partnership Summit ‘Recovery, Resilience and Reform’ of 15 December 2021 reaffirms strong commitment to a strategic, ambitious and forward-looking Eastern Partnership.
In cooperation with its ENP partners, Eurostat has the responsibility ‘to promote and implement the use of European and internationally recognised standards and methodology for the production of statistics, necessary for developing and monitoring policy achievements in all policy areas’. Eurostat undertakes the task of coordinating EU efforts to increase the statistical capacity of the ENP countries. Additional information on the policy context of the ENP is provided here.
Direct access to
- All articles on agriculture
- All articles on non-EU countries
- European Neighbourhood Policy countries — statistical overview — online publication
- Statistical cooperation — online publication
Books
Factsheets
Leaflets
- Basic figures on the European Neighbourhood Policy — East countries — 2020 edition
- Basic figures on the European Neighbourhood Policy — East countries — 2019 edition
- Basic figures on the European Neighbourhood Policy — East countries — 2018 edition
- Basic figures on the European Neighbourhood Policy — East countries — 2016 edition
- Basic figures on the European Neighbourhood Policy — East countries — 2015 edition
- Basic figures on the European Neighbourhood Policy — East countries — 2014 edition
- International trade for the European Neighbourhood Policy — East countries — 2016 edition
- European Neighbourhood Policy-East countries — Statistics on living conditions — 2015 edition
- European Neighbourhood Policy — East countries — Key economic statistics — 2014 edition
- European Neighbourhood Policy — East countries — Labour market statistics — 2014 edition
- European Neighbourhood Policy — East countries — Youth statistics — 2014 edition
- Agriculture and fisheries (enpe_agrifish)
- Agriculture (enpe_agri)
- Agriculture and fisheries (enpe_agrifish)
- Eastern European Neighbourhood Policy countries (ENP-East) (ESMS metadata file — enpe_esms)
- European External Action Service — European Neighbourhood Policy
- Joint Communication JOIN(2020) 7 final: Eastern Partnership policy beyond 2020: Reinforcing Resilience - an Eastern Partnership that delivers for all (18 March 2020)
- Joint Staff Working Document SWD(2021) 186 final: Recovery, resilience and reform: post 2020 Eastern Partnership priorities (2 July 2021)
- Joint Declaration of the Eastern Partnership Summit: ‘Recovery, Resilience and Reform’ (15 December 2021)
- Directorate-General for Agriculture and Rural Development