Archive:Causes of death statistics at regional level
- Data from February 2010, most recent data: Further Eurostat information, Main tables and Database.
This article takes a look at mortality patterns in the European Union (EU), down to the regional level (NUTS 2). These vary significantly with age and gender, but also between countries and regions. Three types of factor determine mortality: intrinsic factors, such as age and gender; extrinsic factors, such as biological or collective social factors, living or working conditions; and individual factors, such as lifestyle, smoking, alcohol consumption, driving and sexual behaviour.
As a general rule, the mortality rate is higher among men than among women in all age groups. Although there are signs that the mortality gap is narrowing in some Member States, there are still significant differences between genders.
Main statistical findings
Variations in mortality patterns reveal significant differences in causes of death, depending on the age group of the population. Since nowadays people tend to live longer, diseases of the circulatory system are the main cause of death in the European Union. Malignant neoplasms follow as the second most frequent cause, affecting mainly the middle-aged or elderly. In the younger age groups, however, the largest share of deaths is down to external causes (including road accidents). The distribution of causes of death also depends on geographical location. For example, most of the new Member States have high death rates due to diseases of the circulatory system, with the Baltic Member States also recording above-average mortality from external causes.
These are all good reasons to take a closer look at mortality rates at both national and regional levels, distinguishing between men and women and between different age groups.
Respiratory diseases
Respiratory diseases include infectious acute respiratory diseases (influenza and pneumonia) and chronic obstructive diseases. They are the third most frequent cause of death in the EU, accounting for 8 % of all deaths. Respiratory diseases mainly affect older people: nine out of 10 deaths from them occur after the age of 65.
There are considerable differences in the patterns of deaths from respiratory diseases within Europe. The rates vary between 82 deaths per 100 000 men and 69 deaths per 100 000 women, of all ages in both cases.
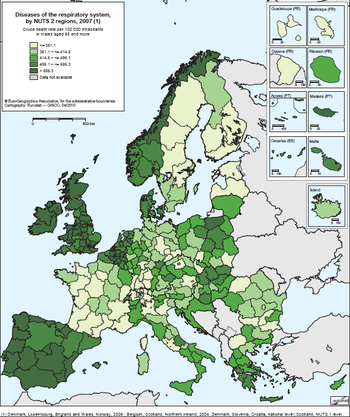
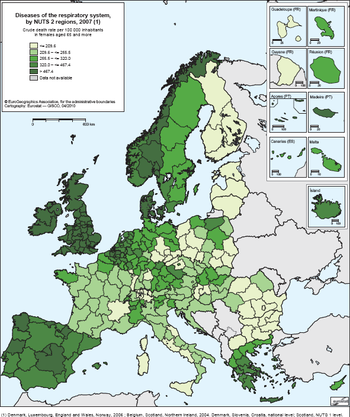
Looking at people over 65, the mortality rates from respiratory diseases are higher for men in almost every region, except for four regions in the United Kingdom (Lincolnshire, East Anglia, Kent, and Cornwall and Isles of Scilly) and in Iceland, where more female deaths were recorded (437.4 per 100 000 inhabitants compared with 385.2). For other regions within the EU-27 the variation can be quite high, ranging from a male/female ratio of 1 in Berkshire, Buckinghamshire and Oxfordshire (UK) to more than 3.0 in Pohjois-Suomi (Finland), Estonia, Lubelskie (Poland) and as much as 4.1 in Lithuania.
The regional pattern for mortality from respiratory diseases emerges very clearly. In the regions of Spain, Norway, the United Kingdom and Portugal, high mortality can be observed. The highest crude death rates for citizens over 65 years old are reported in Regiao Autonoma da Madeira (Portugal — 1 653.3 deaths per 100 000 males and 940.1 deaths per 100 000 females), Merseyside (UK — 945.6 for males and 819.3 for females), Greater Manchester (UK — 942.5 for males and 902.1 for females) and Lancashire (UK — 918.4 for males and 867.1 for females). The national values of these two countries are 37 % (for Portugal) and 70 % (for the UK) higher than the EU-27 average and account for 24 % of all deaths of Europeans other end of the scale, the regions with the lowest rates differ, depending on gender, except for Latvia. For males, these regions are Guadeloupe in France (193.8), Sachsen-Anhalt in Germany (234.8) and Latvia (240.5), whereas for females the regions with the lowest rates are Latvia (66.2)and Estonia (76.8).
Chronic lower respiratory diseases
Chronic lower respiratory diseases (chronic pulmonary diseases, emphysema and asthma) are the main group of respiratory diseases and account for 3.9 % of male deaths and 2.6 % of female deaths in the EU-27. Of these, chronic obstructive pulmonary diseases (COPD) are the most common, accounting for 31 % of deaths from respiratory diseases. Most of these deaths occur after the age of 65 but even so, just as in the case of respiratory diseases as a whole, the national and regional distributions of deaths due to chronic lower respiratory diseases differ.
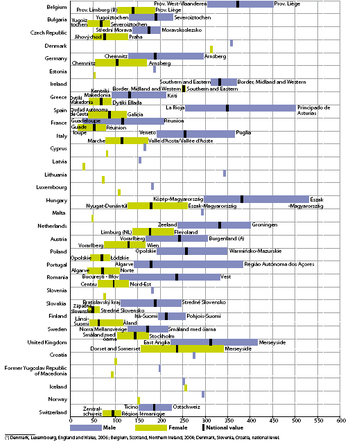
For chronic lower respiratory diseases the highest national crude death rates per 100 000 inhabitants for males aged 65 and over are found in Hungary (382.4), Belgium (373.1), Denmark (314.0) and Lithuania (341.4).
Female mortality rates, on the other hand, are high in Denmark (314.2), Iceland (254.3), Ireland (253.5) and the United Kingdom (237.3).
The lowest national values for males are in France 116.4) and Greece (131.2). For females Latvia (28.9) and Malta (49.1) are at the bottom of the table.
The data reveal marked differences between the lowest values for males and females. Comparing regional values, the highest crude death rates for males aged 65 and over are reported in Eszak-Magyarorszag (Hungary) with 531.6 and Principado de Asturias (Spain) with 504.0 and the lowest in Guadeloupe (France) with 29.4 and Kentriki Makedonia (Greece) with 92.7. For females, Merseyside (UK) with 341.1 and Oslo og Akershus (Norway) with 268.9 report the highest regional rates. Just as for males, Guadeloupe (France) shows the lowest mortality rate for women (16.2), followed by Yugoiztochen (Bulgaria) with 38.4.
Data sources and availability
Causes of death statistics are based on information derived from medical death certificates. Causes of death statistics record the underlying cause of death, i.e. ‘the disease or injury which initiated the train of morbid events leading directly to death, or the circumstances of the accident or violence which produced the fatal injury’. This definition has been adopted by the World Health Assembly.
In addition to absolute numbers, crude death rates and standardised death rates for COD are provided at national and regional level. Regional level data are provided in form of three-year averages. The crude death rate describes mortality in relation to the total population. It is expressed per 100 000 inhabitants, being calculated as the number of deaths recorded in the population for a given period divided by the population in the same period and then multiplied by 100 000. Crude death rates are calculated by five-year age groups. At this level of detail, comparisons between countries and regions are meaningful. However, the crude death rate for the total population (all ages) by sex and age is a weighted average of the age-specific mortality rates.
The weighting factor is the age distribution of the population whose mortality is being observed. Thus, the population structure strongly influences this indicator for broad age classes. In a relatively ‘old’ population, there will be more deaths than in a ‘young’ population because mortality is higher in higher age groups. For comparisons, the age effect can be taken into account by using a standard population. The standardised death rate (SDR) is a weighted average of age-specific mortality rates. The weighting factor is the age distribution of a standard reference population. The standard reference population used is the ‘standard European population’ as defined by the World Health Organization (WHO).
Standardised death rates are expressed per 100 000 inhabitants and calculated for the age group 0–64 (‘premature death’) and for all ages. Causes of death are classified by the 65 causes on the ‘European shortlist’ of causes of death. This shortlist is based on the International statistical classification of diseases and related health problems (ICD), a classification developed and maintained by the WHO.
Context
Health is an important priority for Europeans; they expect to be protected against illness and disease — at home, in the workplace and when travelling. Health is a cross-cutting issue involving a range of topics including consumer protection (food safety), safety in the workplace, and environmental and social policies.
The establishment of EU-wide comparable data on public health and its determinants is closely linked to one of the priorities of the community action programme in the field of public health 2008–13, namely the priority to generate and disseminate health information and knowledge.
It is within this priority area that Eurostat contributes to achieving other objectives of the action programme, by collecting and disseminating statistical data and health indicators, which will help policymakers to identify health risks and improve citizens’ health security and to promote health, including by the reduction of health inequalities.
The provision of information about healthcare systems and, ultimately, about the health of a population is a prerequisite for monitoring the effective performance of public health policy. The currently available regional indicators for health provide an insight into similarities and specificities, as well as into the contrasts that exist throughout the European regions. As shown above, there can be large differences between the regions of a particular country, while regions of other countries may be very similar. Thorough analysis of the trends in, and the variation between, health indicators at regional level is therefore essential. Such analysis is needed for planning and monitoring actions and programmes, formulating new policies and developing new strategies, which together contribute to ‘evidence-based health policy’.
Further Eurostat information
Publications
- Eurostat regional yearbook 2010, chapter 12 (available in English, French and German)
Main tables
- Public health
- Main tables
- Public health (t_hlth)
- Causes of death (t_hlth_cdeath)
- Public health (t_hlth)
- Main tables
Database
- Health, see:
- Public health
- Database
- Public health (hlth)
- Causes of death (hlth_cdeath)
- Public health (hlth)
- Database
Dedicated section
- Health, see:
- Public health


