Archive:Enlargement countries - health statistics
Data extracted in February 2020.
Planned article update: April 2021.
Highlights
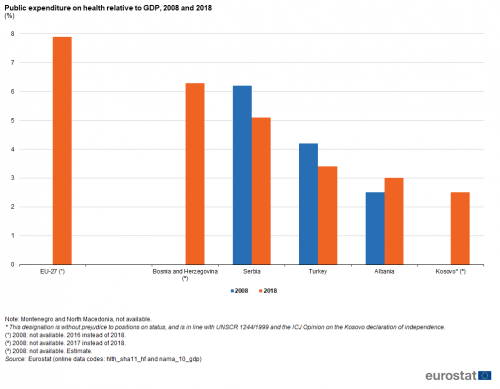
Public expenditure on health relative to GDP was lower in the five candidate countries and potential candidates (for which recent data are available) than it was in the EU-27 (2016 data).
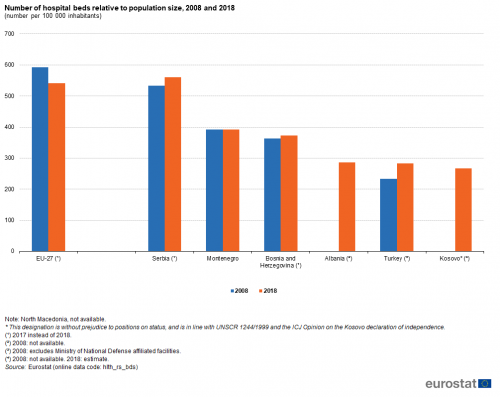
Serbia was the only candidate country or potential candidate among the six for which recent data are available to record a higher number of hospital beds relative to population size than the EU-27 average.
(number per 100 000 inhabitants)
Source: Eurostat (hlth_rs_bds)
This article is part of an online publication and provides information on a range of health statistics for the European Union (EU) enlargement countries, in other words the candidate countries and potential candidates. Montenegro, North Macedonia, Albania, Serbia and Turkey currently have candidate status, while Bosnia and Herzegovina and Kosovo* are potential candidates.
Statistics on healthcare expenditure and financing may be used to evaluate how a healthcare system responds to the challenge of universal access to quality healthcare, through measuring financial resources within the healthcare sector and the allocation of these resources between healthcare activities (for example, preventive and curative care) or groups of healthcare providers (for example, hospitals and ambulatory centres). This article gives an overview of health developments in the EU and the seven candidate countries and potential candidates, presenting an analysis of health expenditure, health resources, hospital discharges, death rates and infection rates.
Full article
Public expenditure on health
In 2016, public expenditure on health in the EU-27 was 7.9 % of gross domestic product (GDP). The relative weight of health expenditure was lower in each of the five candidate countries and potential candidates for which data are available (see Figure 1), peaking at 6.3 % of GDP in Bosnia and Herzegovina (2017 data), with lower ratios in 2018 in Serbia (5.1 %), Turkey (3.4 %), Albania (3.0 %) and Kosovo (2.5 %).
(%)
Source: Eurostat (hlth_sha11_hf) and (nama_10_gdp)
Public expenditure on health relative to GDP rose by 0.5 percentage points in Albania between 2008 and 2018, whereas its relative weight contracted in Turkey (down 0.8 points) and Serbia (down 1.1 points). Note these developments reflect changes in both health expenditure and GDP and that falling health expenditure relative to GDP does not necessarily imply a lower absolute level of health expenditure.
Healthcare resources
Table 1 provides information on specialist healthcare personnel. Physicians need to possess a degree in medicine and are licensed to provide services to patients as consumers of healthcare, including: giving advice, conducting medical examinations and making diagnoses; applying preventive medical methods; prescribing medication and treating diagnosed illnesses; giving specialised medical or surgical treatment.
In 2017, there were an estimated 372 physicians per 100 000 inhabitants in the EU-27. Among the five candidate countries and potential candidates for which data are available (see Table 1), the number of physicians relative to population size was consistently lower than in the EU-27. The highest ratios were recorded in Serbia (296 physicians per 100 000 inhabitants; 2017 data) and in Montenegro (276 physicians per 100 000 inhabitants; 2018 data).
A similar analysis for dentists reveals that the EU-27 had, on average, 74 dentists per 100 000 inhabitants in 2017. This was also higher than the latest ratios recorded in any of the candidate countries and potential candidates for which data are available, with Turkey recording the highest number of dentists per 100 000 inhabitants, at 37 in 2018, half the level recorded for the EU-27.
Nursing professionals typically provide services to patients in hospitals, ambulatory care and patients’ homes: nurses assume responsibility for the planning and management of patient care, including the supervision of other healthcare workers, working autonomously or in teams with medical doctors and others in the application of preventive and curative care.
In 2017, there was an average of 577 nursing professionals per 100 000 inhabitants in the EU-27. This figure was slightly higher than the ratios recorded in Bosnia and Herzegovina (567 per 100 000 inhabitants) and Kosovo (553 per 100 000 inhabitants; 2018 data), which were the highest among the candidate countries and potential candidates. Much lower ratios were recorded in Turkey (232 per 100 000 inhabitants; 2018 data) and Serbia (83 per 100 000 inhabitants).
As with professional nurses, practising midwifery professionals plan, manage, provide and evaluate care services. Midwives do so before, during and after pregnancy and childbirth, providing delivery care for reducing health risks to women and new-born children; they may work autonomously or in teams with other healthcare providers. In 2017, there was an average of 38 midwives per 100 000 inhabitants in the EU-27. This figure was similar to the ratios recorded in Bosnia and Herzegovina, Serbia (both 2017 data) and Montenegro (2018 data) which all recorded ratios within the range of 30-39 midwives per 100 000 inhabitants, while it was considerably lower than the ratio in Turkey (69 per 100 000 inhabitants; 2018 data) and many times higher than the ratio in Kosovo (5 per 100 000 inhabitant; 2018 data).
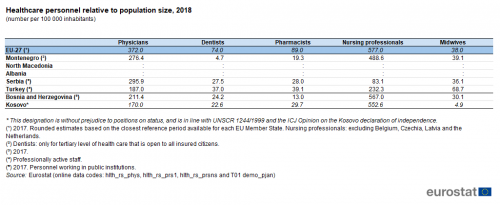
(number per 100 000 inhabitants)
Source: Eurostat (hlth_rs_phys), (hlth_rs_prs1), (hlth_rs_prsns) and (demo_pjan)
Hospital beds include beds for curative care, long-term care and rehabilitative care. In 2017, there were 2.4 million hospital beds available for use across the EU-27, which equated to 541 beds per 100 000 inhabitants (see Figure 2); approximately three quarters (73 %) of these were for curative care, while the largest share of the remainder were beds for rehabilitative care.
Among the candidate countries and potential candidates, the highest ratio of hospital beds relative to population was recorded in Serbia (561 per 100 000 inhabitants; 2017 data) and this ratio was higher than in the EU-27. However, the number of hospital beds relative to population size was lower than the EU-27 average in each of the remaining candidate countries and potential candidates for which data are available: in 2018, ratios of 391 and 373 hospital beds per 100 000 inhabitants were recorded in Montenegro and Bosnia and Herzegovina (2017 data), while Albania, Turkey and Kosovo had ratios in the range of 267-286 hospital beds per 100 000 inhabitants.

(number per 100 000 inhabitants)
Source: Eurostat (hlth_rs_bds)
Hospital discharges
Figure 3 provides information relating to hospital discharges of in-patients; this may be used as an indicator of the level of healthcare activity in hospitals. A hospital discharge occurs when a patient is formally released after an episode of care: discharge may result from the end of their treatment, a decision by the patient to sign-out against medical advice, the patient’s transfer to another healthcare institution, or because of death. In 2017, there were estimated to be just under 18 000 hospital discharges per 100 000 inhabitants across the EU-27. Turkey had a similar ratio to that recorded for the EU, with 16 647 hospital discharges per 100 000 inhabitants in 2018. At the other end of the range, Kosovo had the lowest ratio of in-patient discharges relative to population size (less than 9 000 hospital discharges per 100 000 inhabitants).
Between 2008 and 2017, the number of in-patient hospital discharges relative to population size in the EU-27 rose overall by approximately 5 %; this may be linked, among other factors, to increased longevity and a broader range of medical treatments being made available. There was also an increase in the number of hospital discharges relative to population size in two of the three candidate countries and potential candidates for which data are available: larger increases than in the EU were recorded between 2008 and 2018 in Turkey (up overall by 22.9 %; note however that there is a break in series) and Montenegro (up overall by 7.3 %), while there was a modest decrease in the number of hospital discharges per 100 000 inhabitants between 2008 and 2017 in Serbia (down 3.7 %; break in series).
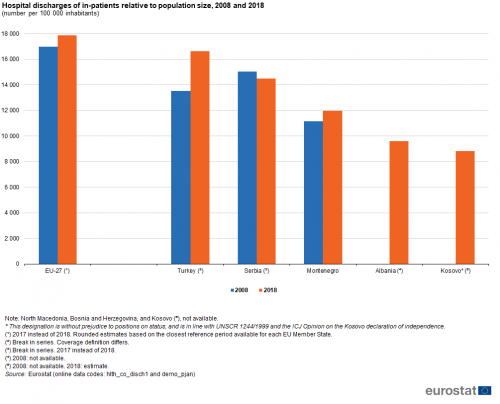
(number per 100 000 inhabitants)
Source: Eurostat (hlth_co_disch1) and (demo_pjan)
Death rates
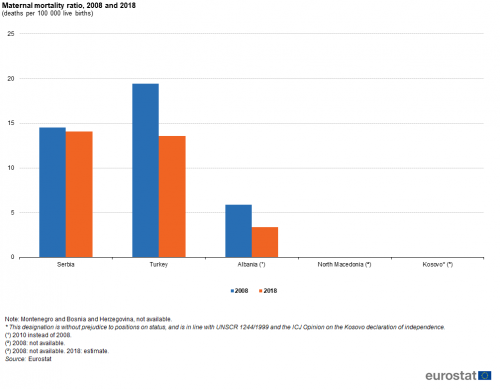
Some of the key performance indicators for improving the health and safety of populations concern analyses of mortality due to underlying causes of death. The maternal mortality rate is defined by the United Nations as the annual number of female deaths (expressed as a ratio per 100 000 live births) from any cause related to or aggravated by pregnancy or its management (excluding accidental or incidental causes) during pregnancy and childbirth or within 42 days of the termination of pregnancy, irrespective of the duration/place of pregnancy.
In developed economies, most women face relatively few complications during pregnancy and childbirth, as many risks have been gradually reduced over time. In 2018, the maternal mortality ratio among five candidate countries and potential candidates (see Figure 4) ranged from a high of 14.1 deaths per 100 000 live births in Serbia down to no deaths in North Macedonia or Kosovo. The maternal mortality ratio fell by more than two fifths in Albania between 2010 and 2018, from 5.9 to 3.4 deaths per 100 000 live births. The rate in Turkey also fell sharply, from 19.4 to 13.6 deaths per 100 000 live births, a fall of 29.9 %. Serbia also recorded a fall in its rate, down 2.8 % from 14.5 to 14.1 deaths per 100 000 live births. It should be noted that deaths related to pregnancy and childbirth are very rare and so, particularly within smaller populations, even a difference of two or three deaths between years can result in relatively large percentage changes.
Crude death rates are defined as the ratio of the number of deaths relative to the average size of the population during one year; as with many other health indicators, these ratios are expressed per 100 000 inhabitants. In 2016, the EU-27 crude death rate from suicide and intentional self-harm was 14.7 per 100 000 male inhabitants aged less than 65 years, which was approximately 3.6 times as high as the corresponding rate for women aged less than 65 years (4.1 deaths per 100 000 female inhabitants). EU-27 crude death rates from suicide and intentional self-harm were considerably higher for men aged 65 years and over, 30.2 deaths per 100 000 male inhabitants and 7.7 deaths per 100 000 female inhabitants.
Information is available for five of the candidate countries and potential candidates for 2018: this reveals that crude death rates from suicide and intentional self-harm were consistently higher in Serbia than in the EU-27 for both sexes and both age groups identified in Figure 5; the difference was most notable for people aged 65 years and over. Elsewhere, crude death rates from suicide and intentional self-harm were generally lower than those recorded for the EU-27, the only exception being a slightly higher rate in Albania among women aged less than 65 years. The lowest crude death rates from suicide and intentional self-harm were recorded in Turkey. For Kosovo there is no information available in relation to people aged less than 65 years while no deaths from suicide or intentional self-harm were recorded among people aged 65 years and over.
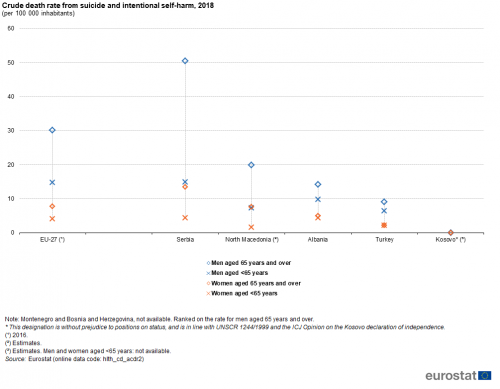
(per 100 000 inhabitants)
Source: Eurostat (hlth_cd_acdr2)
Infection rates
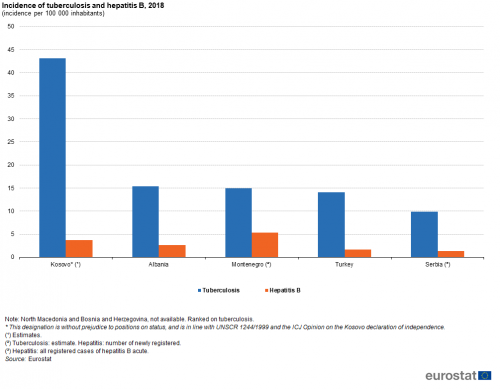
This final section analyses the incidence of two specific diseases, tuberculosis and hepatitis B.
In 2018, the incidence of tuberculosis was highest among candidate countries and potential candidates in Kosovo (43 cases per 100 000 inhabitants). This was a far greater incidence than elsewhere, as the next highest incidence rates were recorded in Albania and in Montenegro (both 15 cases per 100 000 inhabitants).
Among the candidate countries and potential candidates, Kosovo recorded the second highest incidence of hepatitis B (3.7 cases per 100 000 inhabitants in 2018), behind Montenegro (5.3 newly registered cases per 100 000).
Source data for tables and graphs
Data sources
Data for the enlargement countries are collected for a wide range of indicators each year through a questionnaire that is sent by Eurostat to candidate countries or potential candidates. A network of contacts has been established for updating these questionnaires, generally within the national statistical offices, but potentially including representatives of other data-producing organisations (for example, central banks or government ministries). The statistics shown in this article are made available free-of-charge on Eurostat’s website, together with a wide range of other socio-economic indicators collected as part of this initiative.
Health statistics measure both objective and subjective aspects of people's health. They cover different kinds of health-related aspects, including key indicators on the functioning of the health care systems and health and safety at work. These statistics cover a range of subjects, including: health expenditure, health resources, hospital discharges, death rates and infection rates.
In December 2008, the European Parliament and the Council adopted Regulation 1338/2008 on Community statistics on public health and health and safety at work. It was designed to ensure that health statistics provide adequate information for all EU Member States to monitor Community actions in the field of public health and health and safety at work. It lists five domains for which implementing regulations specifying (in detail) the list of variables and methodological aspects were to be developed, including:
- health status and health determinants: Regulation (EU) No 141/2013 on European Health Interview Survey;
- health care: as covered by Regulation (EU) No 141/2013 and Regulation (EU) 2015/359 on statistics on health care expenditure and financing;
- causes of death: Regulation (EU) No 328/2011 on statistics on causes of death;
- accidents at work: Regulation (EU) No 349/2011 on statistics on accidents at work;
- occupational diseases and other work-related health problems and illnesses.
Tables in this article use the following notation:
| Value in italics | data value is forecasted, provisional or estimated and is therefore likely to change; |
| : | not available, confidential or unreliable value. |
Context
Each EU Member State is responsible for its own health system. As such, EU policy in this area is designed to support and complement national actions and address common challenges, by providing a forum for exchanging best practices. EU policies seek to protect and improve the health of EU citizens, support the modernisation of health infrastructure, and improve the efficiency of Europe’s health systems (for more information see the European Commission’s strategic vision for promoting health and food safety during the period 2016-2020).
Health statistics are used to monitor the EU’s health strategy — Investing in health — and the EU’s health programme (as established by Regulation (EU) 282/2014), as well as their contribution to the sustainable development goals (SDGs). These statistics have a key role to support the development of evidence-based policies both nationally and within the EU. They also serve as a basis for calculating indicators to monitor some aspects of social protection and social inclusion and a set of indicators known as the European core health indicators (ECHI).
While basic principles and institutional frameworks for producing statistics are already in place, the enlargement countries are expected to increase progressively the volume and quality of their data and to transmit these data to Eurostat in the context of the EU enlargement process. EU standards in the field of statistics require the existence of a statistical infrastructure based on principles such as professional independence, impartiality, relevance, confidentiality of individual data and easy access to official statistics; they cover methodology, classifications and standards for production.
Eurostat has the responsibility to ensure that statistical production of the enlargement countries complies with the EU acquis in the field of statistics. To do so, Eurostat supports the national statistical offices and other producers of official statistics through a range of initiatives, such as pilot surveys, training courses, traineeships, study visits, workshops and seminars, and participation in meetings within the European Statistical System (ESS). The ultimate goal is the provision of harmonised, high-quality data that conforms to European and international standards.
Additional information on statistical cooperation with the enlargement countries is provided here.
Notes
* This designation is without prejudice to positions on status, and is in line with UNSCR 1244/1999 and the ICJ Opinion on the Kosovo declaration of independence.
Direct access to
Other articles
- Enlargement countries — statistical overview — online publication
- Statistical cooperation — online publication
Publications
- Statistical books/pocketbooks
- Key figures on enlargement countries — 2019 edition
- Key figures on enlargement countries — 2017 edition
- Key figures on the enlargement countries — 2014 edition
- Leaflets
- Basic figures on enlargement countries — 2019 edition
- Basic figures on enlargement countries — 2018 edition
- Basic figures on enlargement countries — 2016 edition
Database
- Health status (hlth_state)
- Health determinants (hlth_det)
- Health care (hlth_care)
- Health care expenditure (SHA 2011) (hlth_sha11)
- Health care resources (hlth_res)
- Health care activities (hlth_act)
- Disability (hlth_dsb)
- Causes of death (hlth_cdeath)
- Health and safety at work (hsw)
Dedicated section
Methodology
- Candidate countries and potential candidates (ESMS metadata file — cpc_esms)
