Government expenditure on general public services
Data extracted in February 2024
Planned article update: February 2025
Highlights
General government expenditure in the EU on 'general public services' amounted to €956 billion or 6.0 % of GDP in 2022.

Source: Eurostat (gov_10a_exp)
This article analyses data on general government expenditure on 'general public services' (according to the Classification of the Functions of Government - COFOG). It is part of a set of statistical articles based on general government expenditure by function.
Eurostat collects data on general government expenditure by economic function according to the international Classification of the Functions of Government (COFOG) in the framework of the European System of National Accounts (ESA 2010).
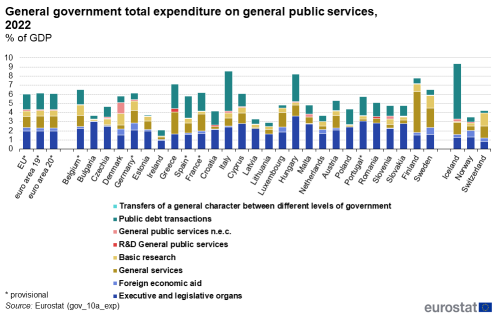
At the level of the EU and euro area (EA-19) expenditure on general public services made up 6.0 % and 6.1 % of GDP in 2022 respectively.
Full article
Expenditure on 'general public services'
At the level of the EU and euro area (EA-19) expenditure on general public services made up 6.0 % and 6.1 % of GDP in 2022 respectively.
Among the more detailed functions (COFOG groups), in 2022, at the level of the EU, 'executive and legislative organs made up 2.0 % of GDP, 'foreign economic aid' made up 0.3 % of GDP, 'general services' made up 1.2 % of GDP, 'basic research' made up 0.6 % of GDP, 'general public services not elsewhere classified' made up 0.1 % of GDP and 'public debt transactions' made up 1.7 % of GDP. The functions 'R&D general public services' and 'transfers of a general nature between different levels of government' made up a very small part of expenditure. For the latter group, no amounts are expected to be reported at general government level.

Source: Eurostat (gov_10a_exp)
In Italy (8.6 % of GDP), Hungary (8.2 % of GDP), followed by Finland (7.8 % of GDP) and Greece (7.1 % of GDP) as well as Iceland (9.4 % of GDP) expenditure related to 'general public services' was higher than in the other reporting countries. Ireland (2.1 % of GDP), Lithuania (2.8 % of GDP), Latvia (3.3 % of GDP) and the Netherlands (3.7 % of GDP) as well as Norway (3.5 % of GDP) were the countries reporting the lowest levels for 2022. This was partially due to the relatively low level of general government gross debt in Latvia and Lithuania as well as Norway as well as generally low levels of total expenditure in these countries.
Within the division 'general public services', expenditure related to the COFOG group 'public debt transactions' amounted to 1.7 % of GDP for the EU and 1.8 % of GDP for the euro area in 2022. At the level of the reporting countries in 2022, expenditure in this COFOG group amounted to 4.4 % in Italy, Hungary 3.0 %, 2.7 % in Greece, followed by Spain at 2.4 % of GDP. Among all the reporting EU and EFTA countries, Iceland reported the highest ratio (6.1 % of GDP). The relatively high amount for Iceland is partly explained by the inclusion in government accounts of units engaged in providing loans. At the other end of the scale, total expenditure in 'public debt transactions' amounted to 0.1 % of GDP in Estonia and 0.3 % of GDP in Luxembourg and Switzerland as well as 0.4 % of GDP in Bulgaria and Lithuania in 2022. This COFOG group contains almost exclusively interest payments to service government gross debt as well as indirectly measured financial intermediation service charges (FISIM). After the group 'executive and legislative organs', the group 'public debt transactions' represents the largest share of expenditure within the COFOG division 'general public services' at EU and euro area level.
In 2022, at the level of the EU and euro area, expenditure on 'foreign economic aid' made up 0.3 % and 0.4 % of GDP, respectively. Sweden and Germany reported the highest 'foreign economic aid' as a ratio to GDP (both 0.7 %), followed by Denmark and Luxembourg (both 0.6 % of GDP) and the Netherlands (0.5 % of GDP). Norway reported 0.7 % of GDP.
The group 'executive and legislative organs' contains among other expenditure items some of the so-called EU own resource payments (notably VAT- and GNI-based contributions as well as the new own resource based on plastic waste). This partially explains the higher level of expenditure of EU countries in this group compared to other countries. At the level of the EU and the euro area, total expenditure on 'executive and legislative organs' amounted to 2.0 % of GDP in 2022. The highest level of expenditure in 'executive and legislative organs' in 2022 was reported by Hungary (3.6 % of GDP), Portugal (3.1 % of GDP), while the lowest value in the EU was reported by Ireland (1.0 % of GDP), and among EFTA countries, Switzerland reported 0.8 % of GDP.
Expenditure on general public services by transaction
In 2022, at the level of the EU, around 27 % of the expenditure on general public services was in the form of 'property income, payable'. Almost entirely, this concerned interest on general government debt instruments. Around 23 % of expenditure in this function was in the form of 'compensation of employees', around 20 % on other current transfers (e.g. for EU own resources allocated to group 'executive and legislative organs', grants in the context of foreign economic aid) and around 16 % on 'intermediate consumption'. Capital investments accounts for around 9 % of total expenditure in this function.
Evolution of expenditure on general public services over 1995-2022
At the level of the EU, expenditure on general public services decreased from 9.5 % of GDP in 1995 to 6.0 % of GDP in 2022, although since 2017, a relatively stable ratio is observed. Total expenditure of general government in the EU, expressed as a ratio to GDP was 53.2 % of GDP in 1995 compared to 49.6 % of GDP in 2022. Among the major functions of government, general public services decreased the most between 1995 and 2022.
The share of general public services at EU level decreased from 17.9 % of total expenditure in 1995 to 12.4 % of total expenditure in 2019, 11.5 % of total expenditure in 2020, 11.6 % of total expenditure in 2021 and 12.1 % of total expenditure in 2022. This more profound decrease in expenditure on general public services since 1995 was therefore not in line with the general decrease in total expenditure of general government in the EU. The share in total expenditure between 2020 and 2022 was affected by the impact of the COVID-19 pandemic, which mainly led to increases in expenditure on economic affairs and health.
Source data for tables and graphs
The detailed tables ![]() are available here.
are available here.
Data sources and availability
Reporting of data to Eurostat
Annual government finance statistics (GFS) data are collected by Eurostat on the basis of the European System of Accounts (ESA 2010) transmission programme. Member States are requested to transmit, among other tables, table 1100, 'Expenditure of general government by function' twelve months after the end of the reference period. Table 1100 provides information about expenditure of the general government sector divided into main COFOG functions and ESA 2010 categories. The transmission of the COFOG I level breakdown (divisions) is compulsory for the years 1995 onwards, whereas information on the COFOG II level (COFOG groups) is provided on a compulsory basis for the general government sector for the reference years 2001 onwards. The main reference year used in this publication is 2022 as the latest year available at EU level.
Data was extracted on 29 February 2024.
Provisional data
While a significant effort was undertaken to harmonise the recording of government measures to alleviate the impact of increasing energy prices, a full harmonisation of data for the reference year 2022 was not yet achieved.
Data for the EU and euro area aggregates (2022), Belgium (2022), Germany (2020-2022), Spain (2022), France (2021-2022) and Portugal (2022) is provisional.
Definition of general government and its subsectors
The data relate to the general government sector of the economy, as defined in ESA 2010, paragraph 2.111: 'The general government sector (S.13) consists of institutional units which are non-market producers whose output is intended for individual and collective consumption, and are financed by compulsory payments made by units belonging to other sectors, and institutional units principally engaged in the redistribution of national income and wealth’.
Classification of functional expenditure of government
The Classification of the Functions of Government (COFOG) classifies government expenditure into ten main categories (divisions known as the 'COFOG I level' breakdown): general public services; defence; public order and safety; economic affairs; environmental protection; housing and community affairs; health; recreation, culture and religion; education; social protection. These divisions are further broken down into 'groups' (COFOG II level).
For 'general public services', the groups are
- 'executive and legislative organs, financial and fiscal affairs, external affairs',
- 'foreign economic aid',
- 'general services',
- 'basic research',
- 'R&D General public services',
- 'general public services n.e.c.',
- 'public debt transactions',
- 'transfers of a general character between different levels of government'.
Further information is available in the Eurostat Manual on sources and methods for the compilation of COFOG Statistics.
Satellite accounts
Administrative expenditure data is additionally collected in so-called satellite accounts. In general, the amount of expenditure recorded in satellite accounts is expected to exceed the expenditure recorded under the respective COFOG division. More details on the comparability of COFOG data with satellite accounts data can be found in the COFOG manual.
Definition of general government total expenditure
Government total expenditure is defined in ESA 2010, paragraph 8.100 by using as reference a list of ESA 2010 categories. More detail is provided in the overview article on Government expenditure by function – COFOG.
Gross Domestic Product
Throughout this publication, the nominal GDP, i.e. GDP at current prices is used. The latest GDP available at time of publication is used.
Time of recording & symbols used
In the ESA 2010 system, recording is on an accrual basis, that is, when ‘economic value is created, transformed or extinguished, or when claims and obligations arise, are transformed or are cancelled.'
":" not available
"pp" percentage points
More data and information
For more country-specific notes, e.g. on missing data, please refer to the metadata published on Eurobase. The authors can be contacted at ESTAT-GFS@ec.europa.eu
Context
In the framework of the European System of National Accounts (ESA 2010), Eurostat collects data on general government expenditure by economic function according to the international Classification of the Functions of Government (COFOG) – see methodological note.
Direct access to
- Government expenditure by function - online publication
- Government expenditure by function – COFOG - overview article
- Government statistics (t_gov)
- Annual government finance statistics (t_gov_10a)
- Government statistics (gov)
- Government finance statistics (EDP and ESA2010) (gov_gfs10)
- Annual government finance statistics (gov_10a)
- Government revenue, expenditure and main aggregates (gov_10a_main)
- General government expenditure by function (COFOG) (gov_10a_exp)
- Main national accounts tax aggregates (gov_10a_tax_ag)
- Annual government finance statistics (gov_10a)
- Government finance statistics (EDP and ESA2010) (gov_gfs10)
- Government revenue, expenditure and main aggregates (ESMS metadata file — gov_10a_main_esms)
- General government expenditure by function (COFOG) (ESMS metadata file — gov_10a_exp_esms)
- Manual on sources and methods for the compilation of COFOG statistics - Classifications of the Functions of Government - 2019 edition
- Manual on government deficit and debt — implementation of ESA 2010 — 2022 edition
