The EU potato sector - statistics on production, prices and trade
Data extracted in July 2024
Planned update: August 2028.
Highlights
The 48.3 million tonnes of potatoes harvested across the EU in 2023 was just over one third less (-36.7 %) less than in 2000.
Share of EU potato production, 2023
This article describes the potato sector in the European Union. A range of agricultural data from a number of Eurostat agricultural statistics (farm structure survey, annual crop production statistics, agricultural prices and economic accounts for agriculture) are used, as well as trade and industrial production statistics, to depict the various stages in the process of bringing potatoes from the field to the market.
Full article
The EU's potato farms, many but, typically, small
In 2020 1.0 million farms in the EU produced potatoes but two-thirds of these farms produced output valued at less than €8 000 per year on average
There were 9.1 million farms in the EU in 2020, of which 1.0 million farms produced potatoes.
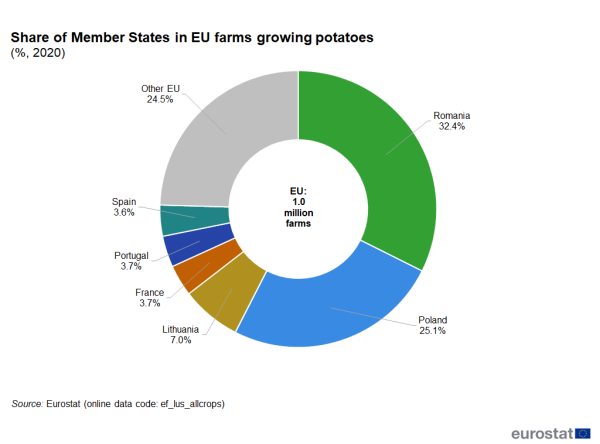
A little less than two-thirds of these holdings were located in three EU countries: Romania (32.4 % of the EU total), Poland (25.1 %) and Lithuania (7.0 %) – see Figure 1.
However, the holdings growing potatoes were generally small in economic size. A little more than one quarter (27.1 %) of the holdings growing potatoes generated total economic output of less than €2 000 per year on average in 2020, farming 1.9 % of the potato area. Indeed, almost two-thirds (63.4 %) of the holdings producing potatoes generated less than a total €8 000 per year on average, farming on 7.7 % of the potato area (see Figure 2).
By contrast, a small number of large holdings farmed the majority of the potato area. Holdings that produced potatoes and generated total economic output over €50 000 per year, farmed 80 % of the potato area in the EU in 2020.
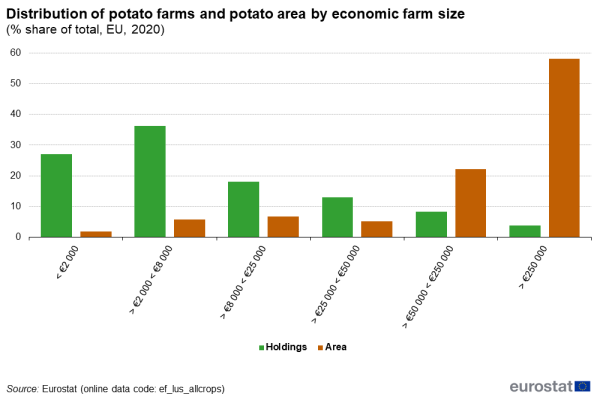
(% share of EU total, 2020)
Source: Eurostat (ef_lus_allcrops)
Few farms produced potatoes organically
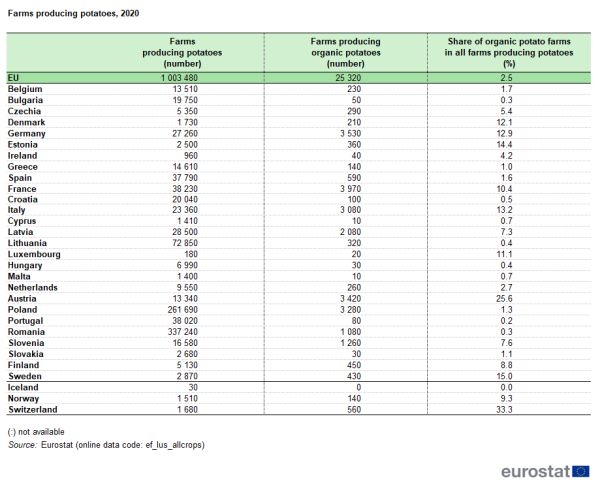
Only 25 000 farms in the EU produced potatoes according to organic production methods in 2020 (see Table 1). This represented only 2.5 % of all farms producing potatoes. In the 3 EU countries (Romania, Poland and Lithuania) with the highest number of holdings producing potatoes, this relative share was well below the EU average. Austria had the highest share of farms producing potatoes organically (25.6 %).
Potato production in the EU is concentrated in a few countries and has been in long-term decline
Almost 70 % EU’s harvested potato area in just five EU countries in 2023
Potatoes were grown on 1.3 million hectares in the EU in 2023.
Although Romania accounted for almost one third of all holdings that produced potatoes in 2020 (see above), they only farmed 5.8 % of the EU’s potato area in 2023. In large part, this reflects the fact that there are many small or very small farms producing potatoes in Romania. Similarly, although farms that produced potatoes in Lithuania accounted for a 7.0 % of the EU’s farms that produced potatoes in 2020, they only accounted for 1.2 % of the EU’s potato area in 2023.
So where was the majority of the EU’s harvested area of potatoes?
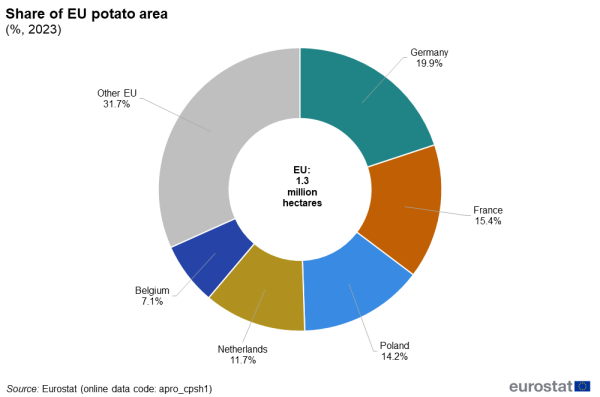
Germany (19.9 % of the EU total), France (15.4 %), Poland (an estimated 14.2 %), the Netherlands (11.7 %), and Belgium (7.1 %) together accounted for just over two-thirds of the EU’s 1.3 million hectares of harvested potatoes in 2023 (see Figure 3).
The harvested area of potatoes was equivalent to a relatively small share of the EU’s arable land; it represented 1.4 % in 2022. However, in individual EU countries it was much more significant; the harvested area of potatoes represented 16.2 % of the arable land in the Netherlands and 10.6 % in Belgium.
There has been a strong downward trend in the harvested area of potatoes in the EU
Between 2000 and 2023, the harvested area of potatoes in the EU more than halved from 3.0 million hectares to 1.3 million hectares. Most of this decline reflected changes in Poland, where the harvested area of potatoes in 2023 was 1.1 million hectares less than in 2000 (equivalent to a decline of 84.9 %). There were double-digit percentage falls in harvested areas of potatoes in all but three EU countries. The exceptions to the general trend were in Belgium and France (see Figure 4), as well as Denmark, but even here their combined harvested areas in 2023 were only 93 000 hectares higher than in 2000.
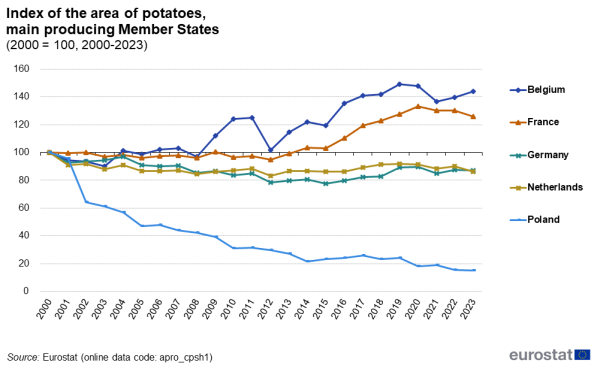
(2000 = 100, 2000-2023)
Source: Eurostat (apro_cpsh1)
In 2023, 48.3 million tonnes of potatoes were harvested in the EU, one third less than in 2000
The harvested production of potatoes in the EU was 48.3 million tonnes in 2023.
Germany was the largest producer of potatoes in the EU in 2023 (at 11.6 million tonnes, 24.0 % of the EU total), ahead of France (17.9 %) and the Netherlands (13.4 %) - see Figure 5. These three EU countries together accounted for a majority (55.4 %) of the harvested production of potatoes in the EU in 2023.

(%, 2023)
Source: Eurostat (apro_cpsh1) and (aact_eaa01)
Potatoes contributed 3.8 % to the value of the EU’s agricultural output in 2023
The EU produced potatoes (including seed potatoes) that were valued at €19.4 billion in 2023. As such, potatoes represented a 3.8 % share of the value of the EU’s agricultural output in 2023. Among EU countries, this share reached 7.9 % in Belgium, 7.0 % in the Netherlands and 6.8 % in Germany.
France, Germany and the Netherlands together accounted for an even higher majority of the value of potato production in 2023 (65.0 %) than they did the harvested production (55.4 %). Although Germany produced about 3.0 million more tonnes of potatoes than France in 2023, the value of the potatoes that France produced was €104.9 million higher than those produced in Germany.
There has also been a strong downward trend in the production of potatoes in the EU
The harvested production of potatoes also followed a downward trend, albeit with annual fluctuations that were also influenced by weather conditions. Between 2000 and 2023, the harvested production of potatoes in the EU declined by 27.9 million tonnes, equivalent to a fall of 36.7 %. Again, there was a particularly strong decline in the harvested production of potatoes in Poland over this period (see Figure 6)
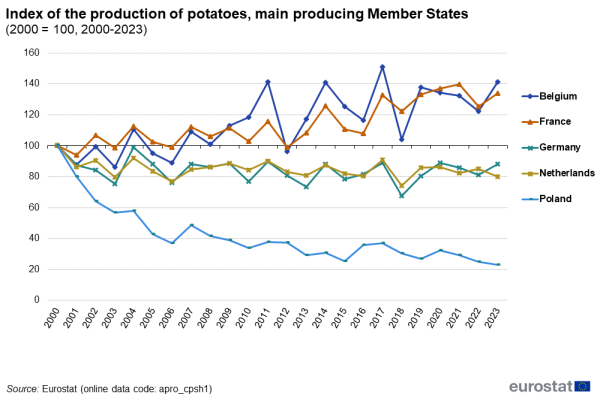
(2000 = 100, 2000-2023)
Source: Eurostat (apro_cpsh1)
Volatile prices, both on producer and consumer markets
Selling prices for potatoes fluctuated significantly over time, on both producer and consumer markets (see Figure 7), in part reflecting strong annual fluctuations in production (see Figure 5). Whilst developments in consumer prices at the level of the EU broadly tracked those of producer prices for potatoes, annual fluctuations were generally more restrained.
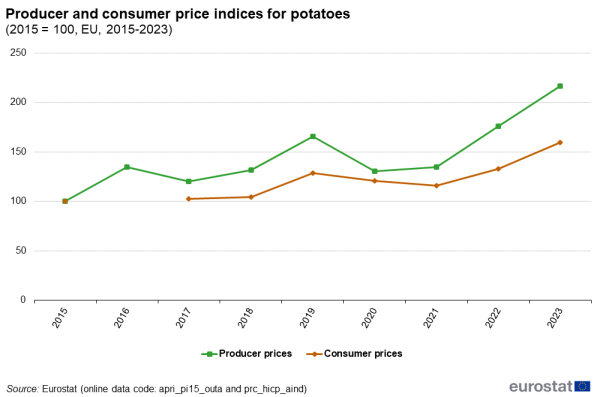
(2015 = 100, EU, 2015-2023)
Source: Eurostat (apri_pi15_outa) and (prc_hicp_aind)
It should be noted, however, that annual price changes for potatoes were often very different between EU countries. Furthermore, developments on producer and consumer markets for a single year sometimes contrasted within an EU country. For example, the producer prices of potatoes in Belgium and Austria in 2023 were lower than in 2022, whereas consumer prices were considerably higher.
Potatoes are traded mainly on the EU’s internal market
France, the Netherlands and Germany are the leading traders
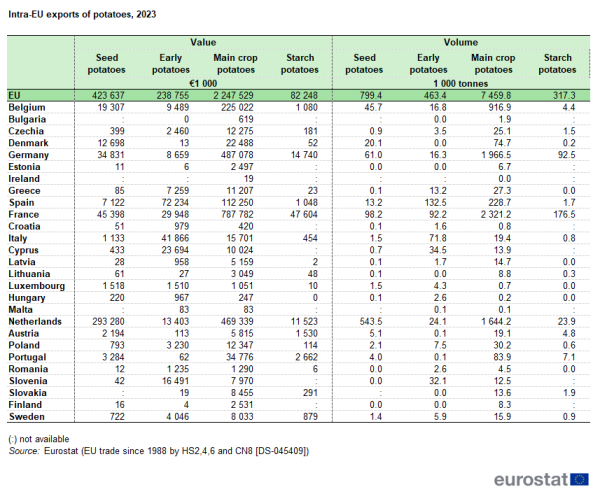
EU countries traded about 9.0 million tonnes of potatoes between themselves (intra-EU trade) in 2023, the market value of which was €3.0 billion - see Table 2. Main crop potatoes accounted for three-quarters (75.1 %) of total intra-EU potato exports in value terms; seed potatoes accounted for about one-seventh (14.2 %) of the total; early potatoes accounted for 8.0 %, with starch potatoes accounting for the remaining 2.7 %.
Three EU countries accounted for three-quarters of intra-EU exports of potatoes in value terms: France (30.4 %), the Netherlands (26.3 %) and Germany (18.2 %). Whereas France and Germany were the main intra-EU export traders in main crop potatoes (35.1 % and 21.7 %, respectively, of the intra-EU total in value terms), the Netherlands alone was responsible for just over two-thirds (69.2 %) of the value of all seed potatoes traded within the EU.
The EU had a trade surplus of €307.3 million in potatoes in 2023
Seed potatoes and main crop potatoes were the EU’s main potato exports, with the Netherlands the leading trader
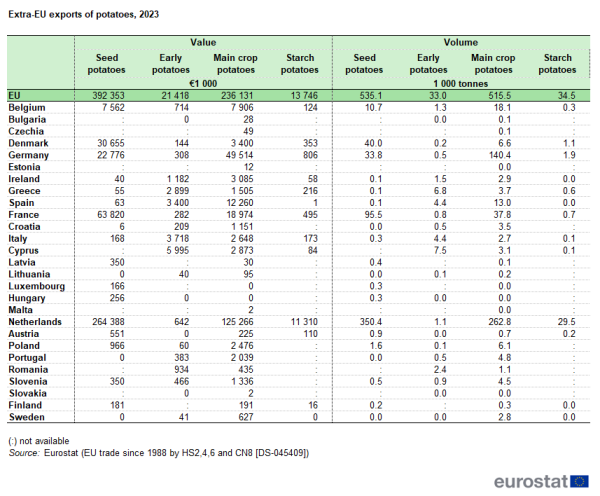
In 2023, the EU exported 1.1 million tonnes of potatoes with a value of €663.6 million - see Table 3. These exports were mainly seed potatoes (59.1 % in terms of the total value of potato exports and 47.9 % in terms of volume) and main crop potatoes (35.6 % in value and 46.1 % in volume). Exports of early potatoes and starch potatoes were much smaller.
The EU’s largest export markets for potatoes in value terms in 2023 were Algeria (10.0 % of all exports outside the EU), Egypt (7.2 %), Switzerland (7.1 %), the United Kingdom (5.7 %), Senegal (5.7 %) and Morocco (5.5 %). These were also the main export markets for potatoes in volume terms, albeit with Switzerland being the largest (accounting for 7.7 % of the volume of all exports). Algeria only imported seed potatoes from the EU in 2023. This was also the main export to Egypt and Morocco. In contrast, main crop potatoes were the key import by Switzerland and Senegal. The United Kingdom imported a broader selection: early potatoes, seed potatoes and main crop potatoes. With many of the principal export markets lying outside continental Europe, the vast majority of potato exports were transported by sea.
Among EU countries, the Netherlands was the leading exporter[1] to countries outside the EU, accounting for more than half of all extra-EU exports of potatoes, both in terms of value (60.5 %) and volume (57.6 %). To put this in some context, the next two largest exporters were France (12.6 % of value and 12.1 % of volume) and Germany (11.1 % of value and 15.8 % of volume).
EU imports of potatoes tended to be ‘early potatoes’
Compared to the volume and value of intra-EU trade, the EU imported few potatoes from non-EU countries: the EU imported potatoes to the value of €356.3 million in 2023. Early potatoes were the main crop imported, the equivalent of 58.8 % of the value of all potatoes imported by the EU in 2023. Almost four-fifths (79.7 %) of the volume of early potatoes imported by the EU came from Egypt (some 358 000 tonnes), with the next highest being from Israel (14.8 %).
The EU had a trade surplus of €307.3 million in potatoes in 2023
The EU is a net exporter of potatoes; it had a trade surplus of €307.3 million in 2023. Within this overall trade in potatoes, there were trade surpluses of €388.1 million in seed potatoes and €93.8 million in main crop potatoes but a trade deficit of €93.8 million in early potatoes.
Source data for tables and graphs
Data sources
The statistical information presented in this publication is drawn from the Eurostat database, available at the Eurostat website.
Statistics on crop production
Statistics on crop products are obtained by sample surveys, supplemented by administrative data and estimates based on expert observations. The sources vary from one EU Member State to another because of national conditions and statistical practices. National statistical institutes or Ministries of Agriculture are responsible for data collection in accordance with EU Regulations. The finalised data sent to Eurostat are as harmonised as possible. Eurostat is responsible for establishing EU aggregates. The statistics collected on agricultural products cover more than 100 individual crop products. Information is collected for the area under cultivation (expressed in 1 000 hectares), the quantity harvested (expressed in 1 000 tonnes) and the yield (expressed in 100 kg per hectare). For some products, data at a national level may be supplemented by regional statistics at NUTS level 1 or level 2.
Statistics on the structure of agricultural holdings
A comprehensive farm structure survey (FSS) is carried out by EU Member States every 10 years (the full scope being the agricultural census) and intermediate sample surveys are carried out twice between these basic surveys. The statistical unit is the agricultural holding; the EU Member States collect information from individual agricultural holdings, covering:
- land use;
- livestock numbers;
- rural development (for example, activities other than agriculture);
- management and farm labour input (including age, sex and relationship to the holder).
Survey data are aggregated to different geographic levels (countries, regions, and for basic surveys also districts) and arranged by size class, area status, legal status of holding, objective zone and farm type. In the FSS, organic data has been collected since the 2000 Census.
Economic accounts for agriculture
Data on the Economic accounts for agriculture (EAA) provide an insight into:
- the economic viability of agriculture;
- agriculture’s contribution to each EU Member State’s wealth;
- the structure and composition of agricultural production and inputs;
- the remuneration of factors of production;
- relationships between prices and quantities of both inputs and outputs.
The output of agricultural activity includes output sold (including trade in agricultural goods and services between agricultural units), changes in stocks, output for own final use (own final consumption and own-account gross fixed capital formation), output produced for further processing by agricultural producers, as well as intra-unit consumption of livestock feed products. The output of the agricultural sector is made up of the sum of the output of agricultural products and of the goods and services produced in inseparable non-agricultural secondary activities; animal and crop output are the main product categories of agricultural output.
Eurostat also collects annual agricultural prices (in principle net of VAT) to compare agricultural price levels between EU Member States and to study sales channels. Quarterly and annual price indices for agricultural products and the means of agricultural production, on the other hand, are used principally to analyse price developments and their effect on agricultural income. Selling prices are recorded at the first marketing stage (excluding transport). Agricultural price indices are obtained by a base-weighted Laspeyres calculation (2010 = 100), and are expressed in nominal terms or as deflated indices based on the use of an implicit consumer prices (HICP) deflator.
COMEXT database on EU trade
COMEXT is the Eurostat reference database for international trade. It provides access not only to both recent and historical data from the EU Member States but also to statistics of a significant number of third countries. International trade aggregated and detailed statistics disseminated from Eurostat website are compiled from COMEXT data according to a monthly process. Because COMEXT is updated on a daily basis, data published on the website may differ from data stored in COMEXT in case of recent revisions. EU data are compiled according to community guidelines and may, therefore, differ from national data published by Member States. Statistics on extra-EU trade are calculated as the sum of trade of each of the 27 Member States with countries outside the EU. In other words, the EU is considered as a single trading entity and trade flows are measured into and out of the area, but not within it. The importance of the EU’s internal market is underlined by the fact that the proportion of intra-EU trade in goods is higher than extra-EU trade in goods in most EU Member States with few exceptions. The variation in the proportion of total trade in goods accounted for by intra-EU trade reflects to some degree historical ties and geographical location.
Context
This article describes the potato sector in the European Union. The overall aim is to offer readers a statistical overview on a single commodity, vertically linking primary agricultural production and trade. The food chain approach is indeed one of the key issues within the EU Commission both for its socio-economic importance and for the extensive legislative EU framework, which is one of the most EU-level harmonised (e.g. General Food law Regulation (EC) No 178/2002). In addition, it is of great relevance also within international organisations, such as, among others, OECD - see the OECD Meeting of Agricultural Ministers held in Paris on 7-8 April 2016 and FAO.
Direct access to
- Agriculture (agr), see:
- Farm structure (ef)
- Agricultural production (t_apro)
- Economic Accounts for Agriculture (t_aact)
- International trade in goods - detailed data (ds-045409)
- Crop production (ESMS metadata file — apro_cp_esms)
- Farm structure survey (FSS) (background article)
- Absolute agricultural prices (ESMS metadata file — apri_ap_esms)
- Economic Accounts for Agriculture (ESMS metadata file — aact_esms)
- Price indices of agricultural products (ESMS metadata file — apri_pi_esms)
- International trade data (ESMS metadata file — ext_go_agg_esms)
- Statistics on the production of manufactured goods (ESMS metadata file — prom_esms)
Notes
- ↑ The relatively high share for the Netherlands might, at least in part, be explained by the considerable amount of goods that flow into and out of the EU through Rotterdam, which is the EU’s leading sea port (the so–called Rotterdam-effect), see also:
International trade statistics - background
