Archive:Statistics on employment characteristics of households
Data extracted in January 2019.
Planned article update: January 2020.
Highlights
This article presents some of the main results for 2018 of the EU Labour force survey (LFS) for the European Union (EU) as a whole, for all EU Member States individually, as well as for three EFTA countries and three candidate countries.
This article mainly complements the articles Employment Statistics , Employment rates and Europe 2020 national targets, Underemployment and potential additional labour force statistics and Unemployment statistics and beyond.
It consists out of two sections: in the first part the focus is on the labour market using household information, while the second part is dedicated to the labour market analysis at individual level.
Full article
1. Main household types involved in the labour market
1.1. Main composition of households
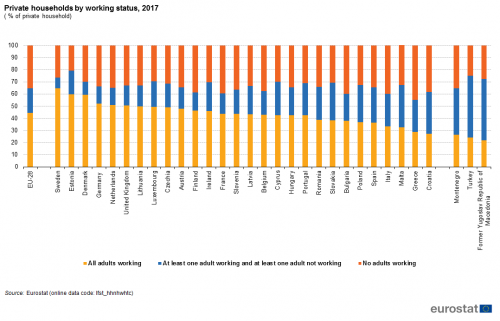
The most common household type in the EU-28 in 2018, seen from a labour market perspective, was the household where all adults were working (44 percent of all private households) (Figure 1). This was followed by the household where none of the adults were working (35 percent). In the remaining 20 percent of the households, at least one adult was working
Among the EU Member States, Sweden had the highest percentage of households where all adults were working (65 percent), Greece had the highest percentage of households where no adults were working (45 percent) and Malta the highest percentage of households where at least one adult was working (35 percent).
For further information about household composition see: Statistics Explained article Household composition statistics .

1.2. The effect of having children
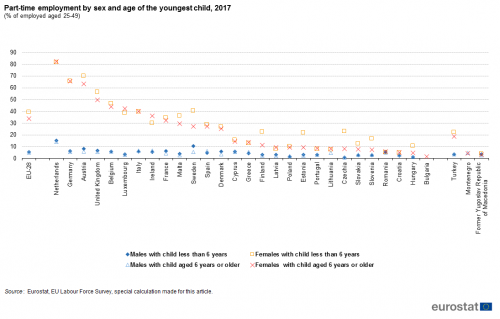
Whether or not a person has children in the household does effect the way of how he or she participates in the labour market. For this reason, Figures 2 and 3 are limited to persons aged 25-49 years, so that different national situations for being a pupil, student and/or retired persons do not influence the results and do not compromise the comparability between countries. In 2018 in the EU-28, more than 1 women in 3 with children, within this age range, worked on a part-time basis (36.1 percent). Being a part-timer differs significantly between men and women (Figure 2). This difference by sex becomes even bigger when persons have children. In all countries, the proportion of women with children, in the age of 25-49 years , that were employed on a part-time basis is higher compared to men. The gap between men and women with children for the part-time work rate was 30.8 point-percentage in EU-28 in 2018. Concerning men and women without children, the gap is lower (10.6 percentage point).
In Romania, Bulgaria, Montenegro and the Former Yugoslav Republic of Macedonia, difference between men and women and and whether or not they have children, is visible less. In these countries, part-time employment rates are low. On the other hand, the having children does influence the female part-time work rate in Germany (24.5 percent of women without children vs. 65.6 percent of women with children), Austria (29.3 percent vs. 66.0 percent) and the United Kingdom (16.2 percent vs. 52.7 percent) . This suggests that women in these countries tend to shift to part-time work from the moment on they have children.
When both men and woman have young children (younger than 6 years old) the part-time rate increases, as shown in Figure 3 . In the EU-28, 39.3 percent of women who are employed and have young children, worked part-time in 2018. The corresponding figure for women who have children aged 6 years or older is 34.0 percent. On the opposite, the part-time work rate of men is not affected by the age of the children: in nearly all countries it stays below 10 percent. In 26 of the 28 EU Member States, the part-time work rate of men with young children is less than 10 percent. The only exceptions were in the Netherlands and Sweden, where 15.2 percent and 10.3 percent of men with young children worked on a part-time basis.
2. Labour market analysis at individual level
2.1. Sub-populations in the Labour Force
The main sub-populations and their relative and absolute size, as defined in the Labour Force Survey (LFS) are shown in Infographic 1. Among the total EU population in 2018, the Labour Force consisted out of 380.2 million, aged 15-74 years (employment and unemployment); 245.8 million of them were economically active ; 134.4 million were consequently economically inactive. Furthermore, 227.0 million persons were in employment , while 18.8 million were unemployed. Among people in employment, employees (192.0 million) outnumbered self-employed persons (32.7 million) by far, and full-time work (181.3 million) was much more common than part-time work (45.7 million).
<thumb src="Labour market in the EU, 2018.PNG">
Infographic 1: Labour market in the EU, 2018
Click on the image for an interactive view of the data. Click on the arrow icons to expand the bars.
2.2. Employees versus self-employed persons
Of the working population, the vast majority of persons are employees, namely 85.0 percent of the EU-28 population aged 15-74 in 2018 (Figure 4). In general, employees outnumber self-employed persons by a wide margin an all EU-28 countries. In only four countries, the proportion of employees, is below 75 percent (in Romania, Greece as well as in the candidate countries Serbia and Turkey). Seven countries have more than nine out of ten working persons as employees (Denmark, Luxembourg, Sweden, Germany, Estonia, Hungary as well as the EFTA country Norway).

One in ten persons in employment was self-employed without employees (own-account workers) (10.3 percent) and 4.1 percent was an employer (self-employed with employees) in the EU-28 in 2018. However, the levels differ substantially between countries; in Greece own-account workers make up close to a quarter of persons in employment (22.8 percent) while in Denmark the same group accounts for 4.7 percent. Self-employed persons with employees are less common, ranging from 1.1 percent in Romania to 7.3 percent in Greece.
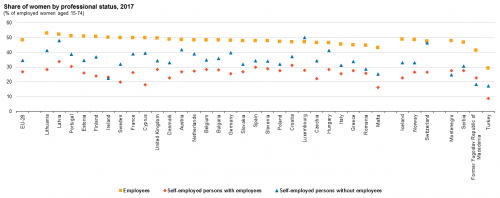
In the EU-28, in 2018, 48.1 percent of the employees are of the females sex, 51.9 percent is male (Figure 5). Consequently, the 28 Member States are close to the gender balance for the rate of employees. However, we are not there yet; shares differ between Member States while the percentage of women among employees ranges from 52.8 percent in Lithuania to 43.0% in Malta.
When it comes to self-employed people, the picture changes markedly, especially for the self-employed with employees. At EU level, there were about two self-employed men without employees for each self-employed woman without employees in 2018 (34.5 percent of self-employed without employees were women) and about three self-employed men with employees for each self-employed woman with employees in 2017 (26.7 percent of self-employed with employees were women). In Malta less than one self-employed with employees in six was female (16.2 percent) and in Turkey this was less than 9 percent in 2018.
For further information about the self-employed persons, see:Self-employment statistics.
2.3. Working hours in the main job
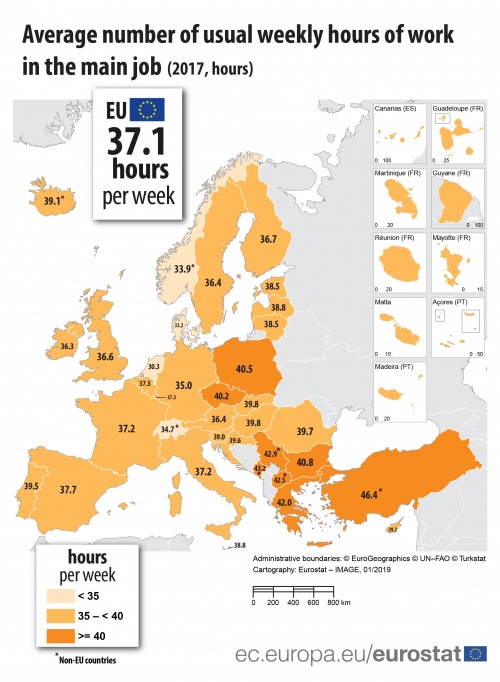
Considering the main job, the average working week of employed people in the EU in 2018, consisted out of 37.1 hours. Among EU Member States, the longest working week can be found in Greece (42.0 hours per week) and the shortest is in the Netherlands (30.3 hours per week). If all EU-LFS participating countries are taken into account, the longest working weeks are recorded in Turkey (46.4 hours per week) (Map 1). It is important to note that these numbers are influenced by several components part-time (more part-time means lower average hours), the composition of the economic activities (working weeks are longer for farmers, construction workers, manufacturing workers), the proportion of self-employed (self-employed work longer hours) and the activity rate of women (women have a higher rate of part-time work).

When only full-time employees are considered, the EU average working week in the main job in 2017 corresponds to 40.2 hours (Map 2). Men had a longer working week than women, working on average 40.9 hours compared with 39.3 hours for women. Those in the mining and quarrying industry worked the longest hours (42.0 hours), while the shortest working week is to be found in the education sector (38.0 hours). Looking at countries' situation, only one EU Member State (the United Kingdom, 42.1 hours) had an average working week (full-time employees) superior to 42 hours. Outside the EU, full-time employees had an average working week larger than 42 hours in five countries: the Former Yugoslav Republic of Macedonia (42.3 hours), Serbia (42.9 hours), Montenegro (43.6 hours), Iceland (44.0 hours) and Turkey where 49.1 hours per week were recorded. Most of the countries (18 countries) had full-time employees working between 40 and less than 42 hours per week; this group mainly contains Eastern countries.
2.4. Economically inactive persons
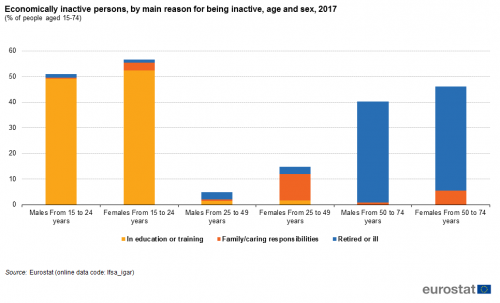
In order to complement the analysis of the employment and unemployment rates, this section looks at the inactivity rate, which informs on the percentage of economically inactive persons out of the total adult population in the country. These people can stay outside the labour market for many different reasons: they can be for instance in education, retired, staying at home to look after children, ill or incapacitated dependants.
Figure 6 shows that the situation of men and women in 2017 in the EU-28 was very similar to each other for inactivity due to education and inactivity due to retirement. In the age group 15-24, 49.1 percent of men were economically inactive due to education, and 52.3 percent of women. In the older age group (50-74 years), the share of inactivity because of retirement or illness was 39.4 percent for men and 40.4 percent for women. However, when it comes to staying outside the labour market because of family obligations, the shares for men and women differ widely. For persons aged 25-49, only 0.6 percent of men were economically inactive for this reason in 2017 whereas the corresponding percentage for women was more than 17 times higher, i.e. 10.3 percent.
Discouraged job seekers can be found among economically inactive people (Figure 7). They are those who would have liked to work, but have given up looking for a job because they believe that it is not possible to find one. It is a key point to understand that a high inactivity rate will push the unemployment rate down, as it takes these persons out of the equation for the unemployment rate. At the EU level the discouraged job seekers made up 0.9 percent of men and 1.3 percent of women aged 15-74 in 2017.
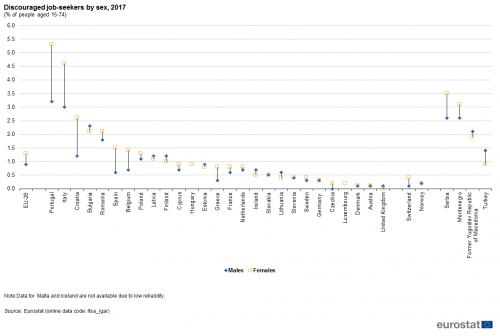
There are notable differences between countries: Portugal, Italy and Croatia as well as the candidate country Serbia and Montenegro have relatively many discouraged job seekers,. This group of persons, however, is quasi non-existent in Austria and in the United Kingdom. In 20 EU Member States, women are more frequently discouraged job-seekers than men. This gap is the largest in Portugal (2.1 percentage points) followed by Italy (1.6 percentage points) and Croatia (1.4 percentage points). However, in seven EU Member States (Bulgaria, Latvia, Finland, Estonia, Ireland, Lithuania and the United Kingdom) men tend to be more often discouraged job-seekers than women.
A more comprehensive analysis of all the aspects of underemployment is published at Underemployment and potential additional labour force statistics.
2.5. Foreign workers in the EU
Another interesting analysis of the labour market concerns the influence of the country of birth on the employment rate. Figure 8 shows that during the period 2006-2018 the EU-born migrants (those born in a different EU Member State than the one they live in) recorded systematically higher employment rates than the non-EU-born migrants (migrants born outside the EU) and the native-born population (persons born in the same country as the one they living in). Until 2008, the non-EU-born migrants have slightly higher employment rates than the native-born population. Starting from 2009 onwards, the employment rate of non-EU-born migrants falls under the one of the native-born population.
In 2018, the EU-28 employment rate for the EU-born migrants aged 15-74 years, was 65.4 %; this is 5.7 percentage points and 8.5 percentage points higher than the rate recorded for native-born population (59.7 percent) and non-EU-born migrants (56.9 percent).
The employment rate of EU-born migrants aged 15-74 years crossed by sex is shown Figure 9. In EU-28, the employment rate of men, born in an EU Member State other than the country of residence, was 72.1 percent in 2018. For women this was 59.3 percent (gender gap of 12.8 percentage points). In all countries the employment rate of male EU-born migrants was higher than the employment rate of female EU-born migrants. This gap is the largest in Greece (20.9 percentage points) and the smallest in Slovenia (2.5 percentage points). Portugal and Iceland are the only countries where both male and female rates are higher than 75 percent.
The gender gap in the employment rate for the non-EU born migrants is illustrated by Figure 10. The employment rate of female non-EU-born migrants is lower than the employment rate of male non-EU-born migrants in all countries except Cyprus. In 7 out of the 27 EU Member States for which data are available in 2018 (no data available for Romania), the employment gap is larger than 20 percentage points (namely Czechia, Malta, Slovakia, the United Kingdom, Italy, Greece and Belgium). In Turkey the gap even reaches 45.3 percentage points with only 18.0 percent of female non-EU-born migrants in employment. In three EU Member States, the employment rate for female non-EU-born migrants was less than 40 percent: Greece (39.3 percent), France (39.1 percent) and Belgium (36.8 percent).
A more in-depth analysis of migrant statistics is published: Migrant integration statistics.
Data sources
Source: the European Union Labour Force Survey (EU-LFS) is a large sample, quarterly survey providing results for the population in private households in the EU, EFTA and the candidate countries. Conscripts in military or community service are not included in the results.
Reference period: Yearly results are obtained as averages of the four quarters in the year.
Coverage: The data for France cover the metropolitan territory (excluding overseas regions). Country codes: Belgium (BE), Bulgaria (BG), Czechia (CZ), Denmark (DK), Germany (DE), Estonia (EE), Ireland (IE), Greece (EL), Spain (ES), France (FR), Croatia (HR), Italy (IT), Cyprus (CY), Latvia (LV), Lithuania (LT), Luxembourg (LU), Hungary (HU), Malta (MT), the Netherlands (NL), Austria (AT), Poland (PL), Portugal (PT), Romania (RO), Slovenia (SI), Slovakia (SK), Finland (FI), Sweden (SE), the United Kingdom (UK), Iceland (IS), Norway (NO), Switzerland (CH), the former Yugoslav Republic of Macedonia (MK), Turkey (TR). The abbreviation MK used for the former Yugoslav Republic of Macedonia is a provisional code which does not prejudice in any way the definitive nomenclature for this country, which will be agreed following the conclusion of negotiations currently taking place on this subject at the United Nations.
European aggregates: EU refers to the sum of EU-28 Member States and EA to the sum of the 19 euro area Member States. If data are unavailable for a country, the calculation of the corresponding aggregates takes into account the data for the same country for the most recent period available. Such cases are indicated.
Definitions: The concepts and definitions used in the survey follow the guidelines of the International Labour Organisation.
Employment covers persons aged 15 years and over (16 and over in Spain, Italy and the United Kingdom, 15-74 years in Estonia, Latvia, Hungary, Finland, Sweden, Norway and Denmark, and 16-74 years in Iceland), living in private households, who during the reference week performed work, even for just one hour, for pay, profit or family gain, or were not at work but had a job or business from which they were temporarily absent, for example because of illness, holidays, industrial dispute or education and training. The LFS employment concept differs from national accounts domestic employment, as the latter sets no limit on age or type of household, and also includes the non-resident population contributing to GDP and conscripts in military or community service.
•Self-employed persons with employees are defined as persons who work in their own business, professional practice or farm for the purpose of earning a profit, and who employ at least one other person.
•Self-employed persons without employees are defined as persons who work in their own business, professional practice or farm for the purpose of earning a profit, and who do not employ any other person.
•Employees are defined as persons who work for a public or private employer and who receive compensation in the form of wages, salaries, fees, gratuities, payment by results or payment in kind; non-conscripted members of the armed forces are also included.
•The distinction between full-time and part-time work is generally based on a spontaneous response by the respondent. The main exceptions are the Netherlands and Iceland where a 35 hours threshold is applied, Sweden where a threshold is applied to the self-employed, and Norway where persons working between 32 and 36 hours are asked whether this is a full- or part-time position;
•Unemployment covers persons aged 15-74 (16-74 in Italy, Spain, the United Kingdom and Iceland) who were not employed during the reference week, were currently available for work and had either been actively seeking work in the past four weeks or had already found a job starting within the next three months.
•Reason for inactivity is the main reason why somebody is not seeking employment. The main reason may or may not be the only reason. Only the main one is retained for analysis in this article.
Definitions of indicators reported in this publication are available on the EU-LFS Statistics Explained website: EU Labour Force Survey (Statistics Explained)
Context
The EU-LFS is the largest European household sample survey providing quarterly and annual results on labour participation of people aged 15 and over as well as on persons outside the labour force. It covers residents in private households. The EU-LFS is an important source of information about the situation and trends in the EU labour market.
Each quarter around 1.8 million interviews are conducted throughout the participating countries to obtain statistical information for some 100 variables. Due to the diversity of information and the large sample size the EU-LFS is also an important source for other European statistics like Education statistics or Regional statistics.
Direct access to
<maintables>
<maintables>
