Labour cost structural statistics - changes
Data from 10 November 2023
Next article update: September 2026
Highlights
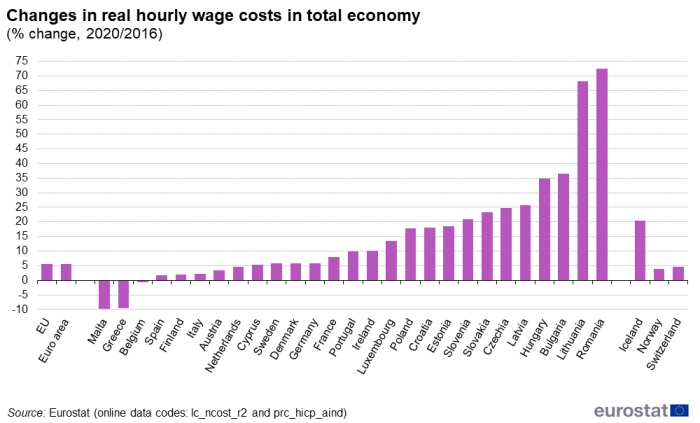
In 2020, the hourly wage costs in the whole economy stood at €21.7 in the EU and €24.4 in the euro area; compared with 2016, they increased in real terms by 5.6 % in the EU and 5.5 % in the euro area.
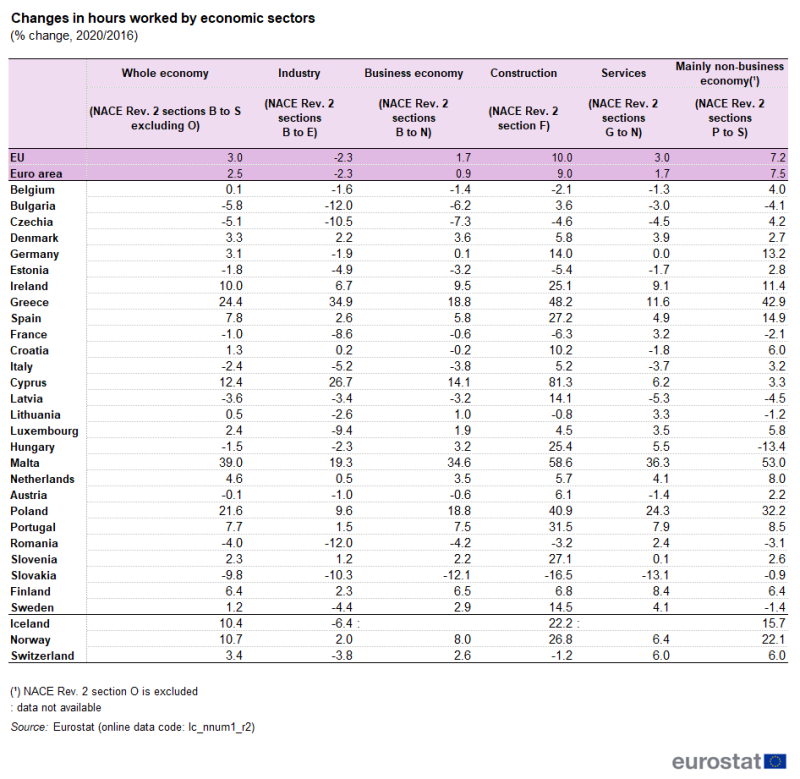
In 2020 compared with 2016, hours worked in the whole economy increased by 3.0 % in the EU and 2.5 % in the euro area.
In 2020 compared with 2016, hours worked increased most in the construction (10.0 % in the EU, 9.0 % in the euro area) while the largest decreases were in industry (-2.3 % both in both the EU and the euro area).
Changes in real hourly wage costs in total economy, 2020/2016
This article is based on the comparison of two vintages of the 4-yearly Labour cost survey (LCS), with reference years 2008 and 2016, highlighting changes in hours worked, hourly labour costs and hourly wage costs between the two reference years. For 2016 labour cost levels see: Labour cost structural statistics - levels.
Full article
Changes in hourly labour costs and total hours worked
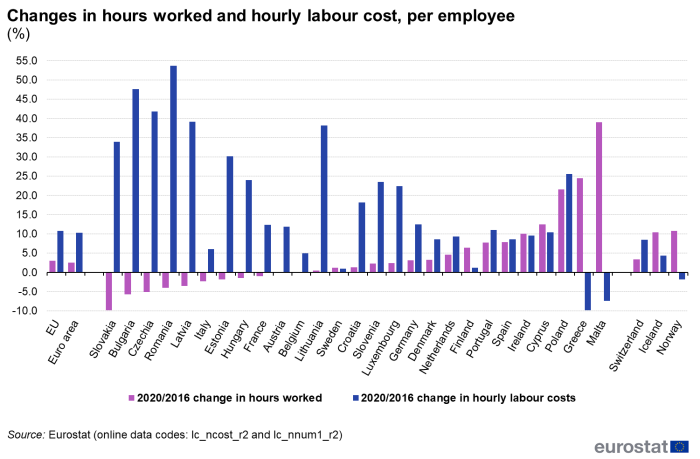
Changes in labour cost can be split into changes in the volume of labour input (total number of hours worked, number of employees) and prices (hourly labour costs) (Figure 1).
Source: Eurostat (lc_ncost_r2), (lc_nnum1_r2)
Over the period 2016-2020, the mean hourly labour cost in the European Union (EU) has increased by 10.8 % in the EU and 10.3 % in the euro area. The countries with the highest increases in labour cost between 2016 and 2020 were Romania (+53.6 %) and Bulgaria (+47.6 %).
In terms of labour input, the total number of hours worked increased by 3.0 % in the EU and 2.5 % in the euro area, with large differences across countries. An increase in the total number of hours worked was recorded in 17 EU Member States, ranging between 0.1 % in Belgium and 39.0 % in Malta. At the same time, a decrease was recorded in the remaining ten EU Member States, ranging between -0.1 % in Austria and -9.8 % in Slovakia.
Changes in number of employees and hours worked per employee
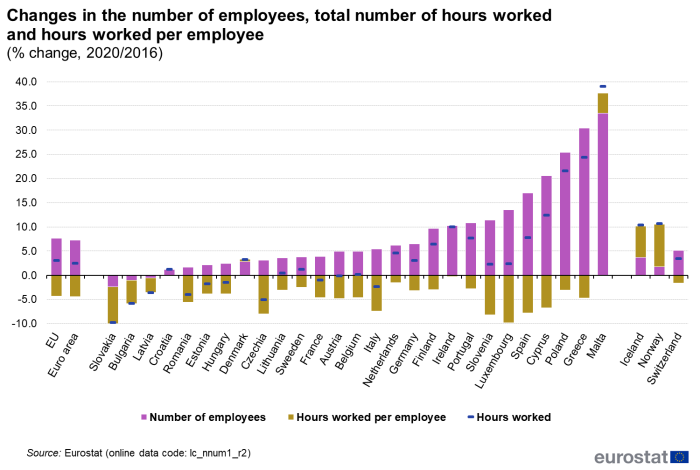
Changes in total hours worked are the combined effect of changes in the number of employees and in the average number of hours worked per employee (Figure 2).
Source: Eurostat (lc_nnum1_r2)
Between 2016 and 2020, the number of employees increased by 7.7 % in the EU and by 7.3 % in the euro area. Over the same period, the average number of hours worked per employee decreased by 4.3 % in the EU and by 4.4 % in the euro area.
Changes in hours worked by economic sectors
In the EU, the total number of hours worked increased most in construction (+10.0 %) while a decrease was recorded in industry (-2.3 %). Likewise, in the euro area, the highest increase in the total number of hours worked was recorded in construction (+9.0 %), while industry showed a decrease of (-2.3 %) (Table 1).
Changes in real hourly wage costs
In 2020, average hourly wage costs in the whole economy stood at EUR 21.7 in the European Union (EU) and EUR 24.4 in the euro area. However, this average masks significant differences between EU Member States, ranging from EUR 5.7 in Bulgaria to EUR 41.6 in Luxembourg. Over the 2016-2020 period, hourly wage costs for the whole economy have increased in real terms by 5.6 % in the EU and by 5.5 % in the euro area (Figure 3). The highest rises were recorded in Romania (+72.5 %), Lithuania (+68.1 %), Bulgaria (+36.6 %) and Hungary (+34.9 %) while three Member-States recorded a decrease, namely: Malta (-9.8 %), Greece (-9.5 %) and Belgium (-0.7 %).
Source: Eurostat (lc_ncost_r2), (prc_hicp_aind)
Wage and salary costs ('wage costs') include direct remunerations, bonuses, and allowances paid by an employer in cash or in kind to an employee in return for work done, payments to employees saving schemes, payments for days not worked and remunerations in kind such as food, drink, fuel, company cars, etc. They include social contributions, income taxes, and other payments payable by the employee, including those withheld by the employer and paid directly to social insurance schemes, tax authorities, etc. on behalf of the employee. They exclude social contributions payable by the employer. Changes in hourly wage costs are calculated as a Laspeyres index - the average of 2020/2016 changes, in national currency, across all NACE sections (except agriculture and public administration) weighted by the number of hours worked recorded in 2016 for the corresponding NACE section. To express changes in real terms, the Laspeyres index in nominal terms is divided by the 2020/2016 changes in the harmonized index of consumer prices published in Eurostat table (prc_hicp_aind).
Changes in real hourly wage costs by economic sectors
In the EU, all economic sectors recorded an increase in real hourly wage costs, over the observed period, ranging between 5.0 % in services and 6.7 % in the mainly non business economy. In the euro area as well, they increased most in the mainly non business economy (+6.3 %).
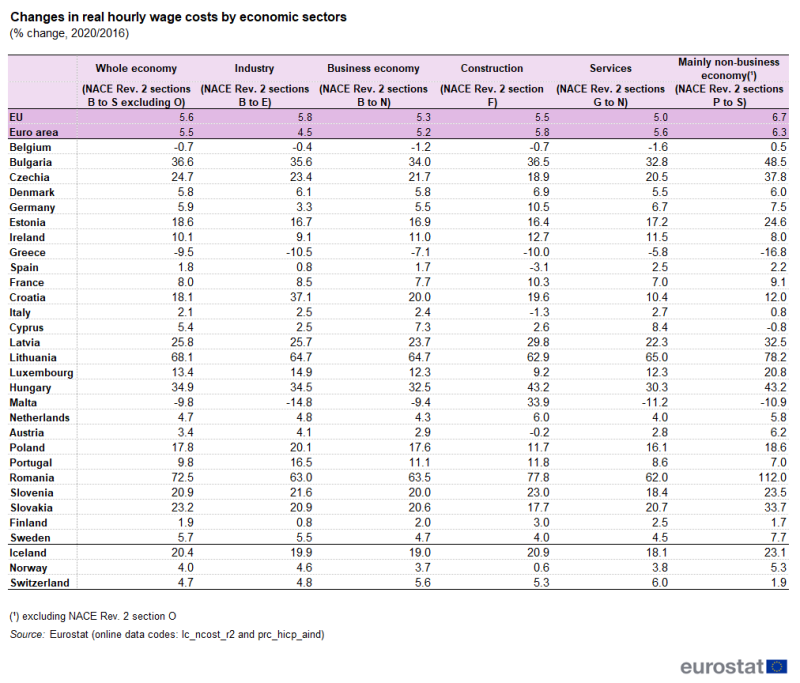
Source: Eurostat (lc_ncost_r2), (prc_hicp_aind)
Changes in hourly labour costs, in euro and national currency
Compared with 2016, the hourly labour costs in euro recorded in 2020 was 10.8 % higher in the EU and 10.3 % higher in the euro area. It increased in all EU Countries except Greece (-9.8 %) and Malta (-7.4 %) with the largest rises recorded in Romania (+53.6 %) and Bulgaria (+47.6 %) (Figure 4).
For non-euro area countries, exchange rate movements impacted hourly labour costs in euro downwards for Hungary (-11 %), Sweden (-10 %), Romania (-7 %) and Poland (-2 %). They impacted them upwards only for Czechia (+2 %).
The largest positive contributions of wages to changes in the hourly labour costs expressed in national currency were observed in Romania (+76 %), Lithuania (+62 %), Bulgaria (+43 %) and Hungary (+40 %). At the same time, the largest negative contributions were recorded in Malta (-3 %) and Greece (-8 %). In Romania and Lithuania, social contributions payable by employers were partly shifted to employees, which explains the negative contribution of the non-wage component to changes in the hourly labour costs (-11 % and -24 %, respectively).
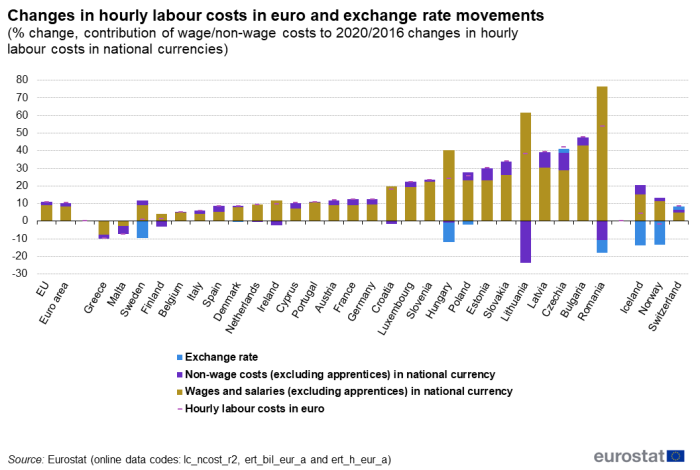
Source: Eurostat (lc_ncost_r2), (ert_bil_eur_a), (ert_h_eur_a)
Data sources
The Labour cost survey (LCS) provides details on the level and structure of labour cost data, hours worked and hours paid for employees in the European Union (EU).
Employees include all persons employed at the observation unit and with an employment contract (permanent or not), except family workers; home workers; occasional workers; persons wholly remunerated by way of fees or commission; board of Director Members; directors/managers paid by way of profit share or by fee; self-employed persons. Data do not cover apprentices except in the case where they represent a low share of the total labour force (less than 1 %).
If not otherwise stated, data refer to full-time and part-time employees working in enterprises employing 10 employees or more, in all economic sectors except: agriculture, forestry and fisheries (NACE Rev. 2 Section A) and public administration and defence; compulsory social security (NACE Rev. 2 Section O). The LCS data for NACE section O are transmitted by countries on voluntary basis.
Hours worked are defined as the periods of time employees spent on direct and ancillary activities to produce goods and services, including normal periods of work, paid and unpaid overtime and time spent on preparation, maintaining, repairing, cleaning and writing reports associated to main work. They exclude periods of vacation and other public holidays, sick leave and other type of absence which employees are paid for.
Context
Labour costs refer to the total expenditure borne by employers in order to employ staff. They cover wage and non-wage costs less subsidies. They do include vocational training costs or other expenditures such as recruitment costs, spending on working clothes, etc.
Direct access to
- Eurostat regional yearbook 2008, Chapter 8: Labour costs
- Eurostat Yearbook 2012, Chapter 5: Labour market
- Labour costs survey
- Labour market (including Labour Force Survey, see Methodology - Labour costs
- Regulation 530/1999 of 9 March 1999 concerning structural statistics on earnings and on labour costs (Summary)
- Regulation 1737/2005 of 21 October 2005 amending Regulation (EC) No 1726/1999 as regards the definition and transmission of information on labour costs (Text with EEA relevance)
- Regulation Regulation 698/2006 of 5 May 2006 implementing Council Regulation (EC) No 530/1999 as regards quality evaluation of structural statistics on labour costs and earnings (Text with EEA relevance)
- Regulation 1893/2006 of 20 December 2006 establishing the statistical classification of economic activities NACE Revision 2 and amending Council Regulation (EEC) No 3037/90 as well as certain EC Regulations on specific statistical domains (Text with EEA relevance)
- Summaries of EU Legislation: Comparable EU-wide statistics on economic activities
- Summaries of EU Legislation: Statistical classification of economic activities
- Regulation 973/2007 of 20 August 2007 amending certain EC Regulations on specific statistical domains implementing the statistical classification of economic activities NACE Revision 2
