Archive:European Neighbourhood Policy - East - agriculture statistics
Data extracted in November 2018.
Planned article update: January 2020.
Highlights
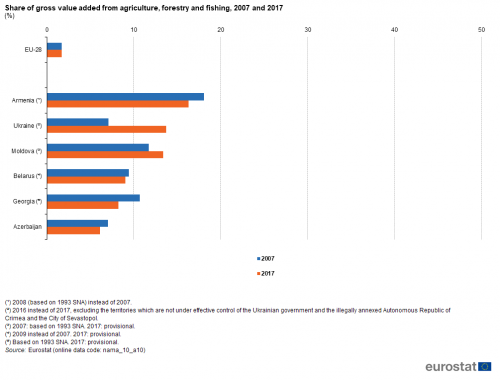
Agriculture, forestry and fishing account for a greater share of total economic activity in the ENP-East countries than in the EU.
Ukraine is a significant cereal producer: only France, among EU Member States, had a higher level of output in 2017.
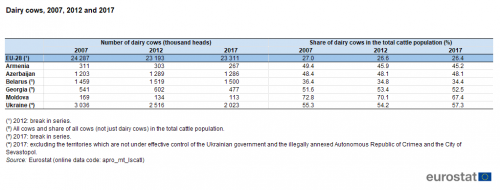
In the ENP-East countries, dairy cows represented a relatively high share of the total cattle population.
This article is part of an online publication and provides a description of the agriculture, forestry and fisheries sector in the European Union (EU) and in the six countries that together form the European Neighbourhood Policy-East (ENP-East) region, namely, Armenia, Azerbaijan, Belarus, Georgia, Moldova and Ukraine. Note that data shown in this article for Georgia exclude the regions of Abkhazia and South Ossetia over which the government of Georgia does not exercise effective control and data for Moldova exclude Transnistria unless otherwise stated. The latest data for Ukraine generally exclude the territories which are not under effective control of the Ukrainian government and the illegally annexed Autonomous Republic of Crimea and the City of Sevastopol (see specific footnotes for precise coverage).
The article focuses on several aspects: the contribution of agriculture, forestry and fisheries to the total economy (in terms of gross value added and employment), the utilised agriculture area (UAA), the production of cereals, livestock populations, meat production and international trade in food and live animals.
Full article
Gross value added and employment
Between 2007 and 2017, the gross value added and employment shares of the agriculture, forestry and fishing sector declined in all ENP-East countries (subject to data availability), except for increases in the value added shares in Moldova and Ukraine. Despite such reductions, these activities continued to account for a relatively high proportion of total economic activity in the ENP-East countries. While the output of agriculture, forestry and fisheries in the EU-28 accounted for 1.7 % of total gross value added in 2017, its share ranged from 6.1 % in Azerbaijan to 16.3 % in Armenia (see Figure 1).
(%)
Source: Eurostat (nama_10_a10)
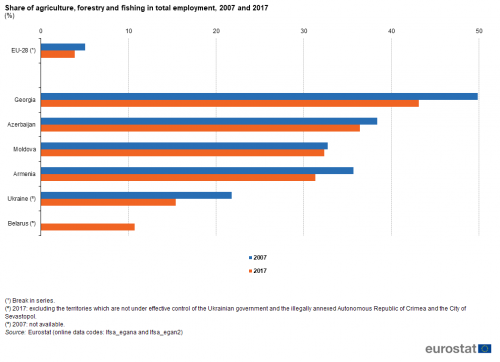
In 2017, the employment share of the agriculture, forestry and fishing sector in the total workforce was 10.7 % in Belarus — the lowest proportion among the ENP-East countries — while around 3 in 10 of those in work in Armenia, Moldova and Azerbaijan were employed in this sector, with the share peaking at 43.2 % in Georgia. As such, the proportion of people working in agriculture, forestry and fisheries in Georgia was 11.1 times as high as in the EU-28 where 3.9 % of the working population were employed in these activities (see Figure 2).
(%)
Source: Eurostat (lfsa_egana) and (lfsa_egan2)
Land use
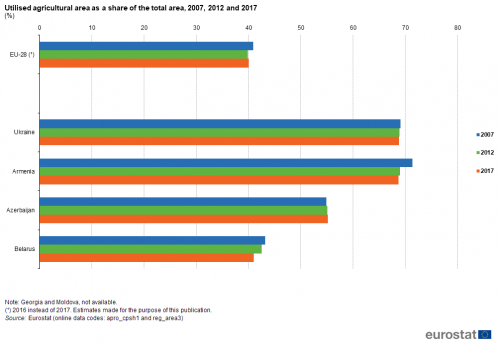
The area within each country that is used for farming varies according to climate, terrain and soil type, while the level of economic development and population density may also play a role in determining land use. Within the EU-28 roughly equal proportions of land (around 40 % of the total land area) are used for farming and for forest and woodland, with the remainder of the land being built-up areas (villages, towns and cities), infrastructure (such as roads or railways), scrub or waste land.
The proportion of land that is given over to agriculture in several ENP-East countries was substantially higher than the proportion observed in the EU-28 (see Figure 3). For example, nearly 70 % of the total area of Ukraine and Armenia was used for agriculture in 2017. This was particularly noteworthy in Ukraine which is a relatively large country in terms of its total area: indeed, some 42 million hectares of land were used for agricultural activities in Ukraine, equivalent to just under one quarter of the total utilised agricultural area of the EU-28.
(%)
Source: Eurostat (apro_cpsh1) and (reg_area3)
Crop production
Compared with the other ENP-East countries, Ukraine had by far the highest level of cereals production (see Table 1). Indeed, Ukraine produced more cereals (61 million tonnes) in 2017 than any of the EU Member States except for France. Georgia (excluding rice) and Armenia (wheat only) were the smallest producers of cereals among the ENP-East countries in 2017, each recording a level of output below 300 thousand tonnes. Apart from in these two small producers, cereals production in 2017 was higher than it had been in 2007 in the ENP-East countries. A particularly large increase was recorded for Moldova, as output (excluding rice) almost quadrupled.
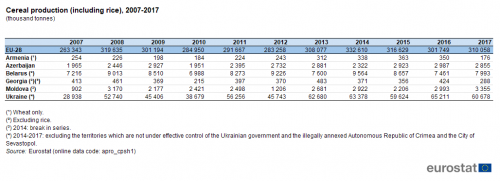
(thousand tonnes)
Source: Eurostat (apro_cpsh1)
Animal production
The structure of livestock populations in the ENP-East countries is presented in Table 2. Collectively, there were more cattle than pigs in the ENP-East countries in 2017, while in the EU-28 the opposite pattern was observed. Farmers in Belarus were specialised in raising cattle, while in Azerbaijan the most common form of livestock was sheep and goats; in Georgia and Armenia the number of cattle was similar to the number of sheep and goats. Moldova (no data for sheep and goats) and Ukraine reported a higher number of pigs. Some of these differences between countries may reflect religious practices.
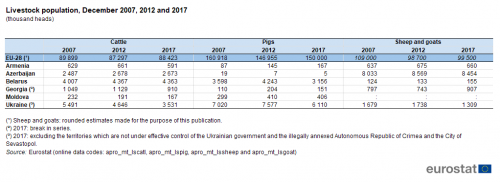
(thousand heads)
Source: Eurostat (apro_mt_lscatl), (apro_mt_lspig), (apro_mt_lssheep) and (apro_mt_lsgoat)
Contrary to the situation in the EU-28, where there was an overall reduction of 6.1 % in the livestock population when comparing results for 2017 with those for 2007, most of the ENP-East countries reported that their combined livestock population of cattle, pigs, sheep and goats was similar in size in 2017 to what it had been in 2007. The one exception was Ukraine, where the livestock population was 22.8 % lower in 2017, although it should be noted that the 2017 data has a narrower geographical coverage. Elsewhere, Belarus recorded a livestock population that was less than 1 % lower in 2017 than in 2007 and the other four ENP-East countries recoded increases ranging from 0.6 % in Georgia (note there is a break in series for 2017) to 8.1 % in Moldova (excluding sheep and goats).
The proportion of dairy cows among the cattle population was considerably higher in the ENP-East countries than in the EU-28 (see Table 3). Dairy cows accounted for just over one quarter of the EU-28’s total cattle population in 2017, while in the ENP-East countries this share ranged from 34 % in Belarus (the share of all cows in the total cattle population, not just dairy cows) to more than two thirds in Moldova. The total population of dairy cows in the ENP-East countries was 16 % lower in 2017 than it had been in 2007, with reductions in Ukraine, Moldova (both down 33 %), Armenia (down 14 %) and Georgia (down 12 %), far outweighing the increases recorded in Belarus (3 %) and Azerbaijan (7 %).
The structure of animal output — as measured by the quantity of slaughtered production — differs from the structure of the animal populations, in large part due to the fact that a proportion of cattle, sheep and goats are reared for milk rather than for meat. In Armenia and Azerbaijan, cattle accounted for the highest quantity of slaughtered production in 2017, while elsewhere the largest quantity of slaughtered production was from poultry (see Table 4).

(thousand tonnes)
Source: Eurostat (apro_mt_pann)
Trade in food and live animals
The value of international trade in food and live animals has grown at a rapid pace over the last decade in the ENP-East countries; note this may, in part, be due to increased prices as the values shown in Tables 5 and 6 are presented in current price terms. Fluctuating prices for raw and processed foodstuffs may have a considerable impact on the trade position of a country, while climatic conditions can affect yields and determine if there is a surplus of food for export.
The EU-28 consistently ran a trade deficit in food and live animal products over the period 2007-2017; note that the trade data presented for the EU-28 in Tables 5 and 6 concern extra-EU trade. Armenia, Azerbaijan and Georgia also recorded trade deficits during this 10-year period; whereas the EU-28’s trade deficit in these products was lower in 2017 than it had been in 2007, the reverse was true for these three ENP-East countries. By contrast, Ukraine recorded a trade surplus for food and live animals throughout the period shown, rising from a surplus of EUR 279 million in 2007 to a surplus of EUR 6.1 billion by 2016. Belarus moved from a position of recording a trade deficit for food and live animals in 2007 and 2008 to a surplus between 2009 and 2017, while Moldova moved from recording a deficit between 2007 and 2013 to a surplus between 2014 and 2017.
Collectively, the exports of food and live animals from ENP-East countries were valued at EUR 13.4 billion in 2016, equivalent to 15.9 % of the EU-28 total, while the value of imports of these goods into the ENP-East countries was EUR 8.4 billion, equivalent to 8.3 % of the EU-28 total.
The highest value of exports of food and live animals among the ENP-East countries was recorded in Ukraine (EUR 8.4 billion in 2016), which was more than double the level of exports from Belarus which recorded the second highest level. Armenia had the lowest level of exports of food and live animals among the ENP-East countries, some EUR 205 million in 2017.
Exports of food and live animals from Armenia were 7.6 times as high in 2017 as their level in 2007, whereas exports from Ukraine (despite the change in geographical coverage; note the time series ends in 2016) and Belarus were more than three times as high. For comparison, exports from the EU-28 more than doubled during the period 2007-2017, as was also the case in Moldova and Georgia.
Source data for tables and graphs
Data sources
The data for ENP-East countries are supplied by and under the responsibility of the national statistical authorities of each country on a voluntary basis. The data that are presented in this article result from an annual data collection cycle that has been established by Eurostat. These statistics are available free-of-charge on Eurostat’s website, together with a range of different indicators covering most socio-economic areas.
The utilised agricultural area describes the area used for farming. It includes arable land, permanent grassland, permanent crops (such as orchards and vineyards) and other agricultural land such as kitchen gardens.
Statistics on crop production relate to harvested production. Cereals include wheat (common wheat and spelt and durum wheat), rye, maslin, barley, oats, mixed grain other than maslin, grain maize, sorghum, triticale, and other cereal crops such as buckwheat, millet, canary seed and rice.
Meat production is based on the activity of slaughterhouses regarding meat fit for human consumption.
The data for the EU-28 presented in this article come from Eurostat‘s online database, including trade data from Comext.
Tables in this article use the following notation:
| Value in italics | data value is forecasted, provisional or estimated and is therefore likely to change; |
| : | not available, confidential or unreliable value; |
| – | not applicable. |
Context
Agriculture was one of the first sectors of the economy (following coal and steel) to receive the attention of EU policymakers, and statistics on agriculture were initially designed to monitor the main objectives of the Common agricultural policy (CAP). While the CAP remains one of the EU’s most important policies it has undergone a widespread evaluation, which has led to a range of new objectives designed to correct imbalances and overproduction.
In December 2013, the latest reform of the CAP was formally adopted by the European Parliament and the Council. The main elements of the CAP post-2013 concern: a fairer distribution of direct payments (with targeted support and convergence goals); strengthening the position of farmers within the food production chain (such as through: the promotion of professional and inter-professional organisations; changes to the organisation of the sugar and wine sectors; revisions to public intervention and private storage aid; and new crisis management tools); and continued support for rural development, safeguarding the environment and biodiversity.
In January 2015, the European Commission initiated a review of the legal basis related to agriculture in order to identify the potential for simplification. A broad range of interested bodies were invited to put forward simplification proposals and more than 1 500 proposals were submitted and examined based on the following three principles:
- simplification should be predominantly for the benefit of the CAP beneficiaries;
- the political decisions of the 2013 reform should not be questioned;
- simplification should not jeopardise the sound financial management of the CAP.
A number of actions have been taken, for example introducing more flexibility, providing greater guidance, or introducing preliminary cross checks of aid applications to reduce the risk of penalties.
On 18 November 2015, the High Representative for Foreign Affairs and Security Policy and the European Commission jointly presented a review of the European Neighbourhood Policy (SWD(2015) 500 final) which underlined a new approach for the EU in relation to its eastern and southern neighbours, based on stabilising the region in political, economic, and security-related terms.
In cooperation with its ENP partners, Eurostat has the responsibility ‘to promote and implement the use of European and internationally recognised standards and methodology for the production of statistics, necessary for developing and monitoring policy achievements in all policy areas’. Eurostat undertakes the task of coordinating EU efforts to increase the statistical capacity of the ENP countries. Additional information on the policy context of the ENP is provided here.
Direct access to
- All articles on non-EU countries
- European Neighbourhood Policy countries — statistical overview — online publication
- Statistical cooperation — online publication
Books
Leaflets
- Basic figures on the European Neighbourhood Policy — East countries — 2018 edition
- Basic figures on the European Neighbourhood Policy — East countries — 2016 edition
- Basic figures on the European Neighbourhood Policy — East countries — 2015 edition
- Basic figures on the European Neighbourhood Policy — East countries — 2014 edition
- International trade for the European Neighbourhood Policy — East countries — 2016 edition
- European Neighbourhood Policy-East countries — Statistics on living conditions — 2015 edition
- European Neighbourhood Policy — East countries — Key economic statistics — 2014 edition
- European Neighbourhood Policy — East countries — Labour market statistics — 2014 edition
- European Neighbourhood Policy — East countries — Youth statistics — 2014 edition
- Agriculture, forestry and fisheries (enpr_ag)
- Eastern European Neighbourhood Policy countries (ENP-East) (ESMS metadata file — enpr_esms)
