Archive:Intra-EU - most traded goods
- Data extracted in January 2018. Most recent data: Further Eurostat information, Main tables and Database. Planned update: January 2019.
This article focuses on the most significant goods by value (according to the CPA classification) exchanged in intra-EU trade. It presents statistics for the EU-28 (2013 and 2016), EU-27 (2012), EU-25 (2006), EU-15 (2004) and EU-12 (1994) aggregates. Statistics on goods traded between EU Member States — especially the size and evolution of imports and exports — enable the EU and national authorities to evaluate the growth of the Single Market and the integration of EU economies. These statistics also provide EU businesses with essential information for their sales and marketing policies.
This article is part of an online publication providing recent statistics on international trade in goods, covering information on the EU's main partners, main products traded, specific characteristics of trade as well as background information.
Main statistical findings
- Exports between EU Member States more than quadrupled between 1994 and 2016.
- In this period the most exported types of goods were ‘Motor vehicles, trailers and semi-trailers’, ‘Chemicals and chemical products’ , ‘Computer, electronic and optical products’, ‘Food products’ and ‘Machinery and equipment’.
- Although the composition of the EU remained unchanged between 2013 and 2016, both total trade and trade in the five most exported goods increased.
Evolution of intra-EU trade
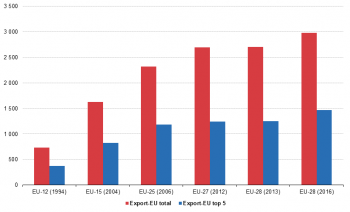
The value of exports between EU Member States has quadrupled from EUR 732 billion in 1994 to EUR 2 978 billion in 2016 (see Figure 1). However it must be noted that the composition of the EU over this period grew from 12 to 28 countries. Over the same time period, trade between the EU and the rest of the world tripled. Extra-EU exports grew from EUR 517 billion in 1994 to EUR 1685 billion in 2016 and extra-EU imports grew from EUR 527 billion in 1994 to EUR 1667 billion in 2016.
Considering that the intra-EU trade data are based on common and largely harmonised rules, one might expect the intra-EU trade balance to be zero or at least close to it, meaning that at the EU aggregate level, total imports should equal total exports.
In theory for the EU aggregate, as intra-EU exports are declared free-on-board-type (FOB-type) value and intra-EU imports Cost-insurance-and-freight-type (CIF-type) value, the value of intra-EU imports should be slightly higher than that of intra-EU exports. However, since the introduction of the Intrastat data collection system for intra-EU trade on 1 January 1993, the value of intra-EU exports at the EU aggregate level has been consistently higher than that of intra-EU imports, showing that total intra-EU exports have better coverage than total intra-EU imports. The analysis presented in this section at the EU aggregate level only considers intra-EU exports as it is the more reliable measure of total intra-EU trade.
Figure 1 shows that the value of exports of all goods within the EU increased from 1994 to 2016. In 1994, total intra-EU exports stood at EUR 732 billion, while 10 years later, in 2004, this value had more than doubled to EUR 1 628 billion. By 2006, intra-EU exports had more than tripled, reaching EUR 2 321 billion. There was a continued increase in the total value of intra-EU exports since 2006 however the percentage increase was much lower.
The evolution of the value of the top 5 products exported within the EU follows roughly the same pattern as the total exports. In 1994, the value of the top 5 goods exported to other EU Member States was EUR 369 billion or just over half the value of all goods exported within the EU. In 2004 (EUR 822 billion) and 2006 (EUR 1 179 billion), the top 5 intra-EU exported goods by value also accounted for over half of intra-EU goods exports. By 2013 the relative importance of the top 5 goods traded within the EU had decreased to 46 % but it rose to 49 % of the value of total intra-EU exports in 2016.
The 5 most significant products in intra-EU trade
There has been a degree of consistency in those goods that have been most significant in terms of value exported within the EU, although some variations in the evolution of the export figures for these goods can be seen.
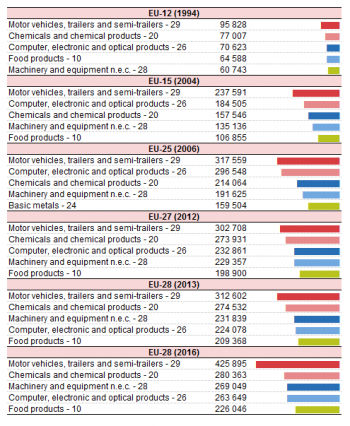
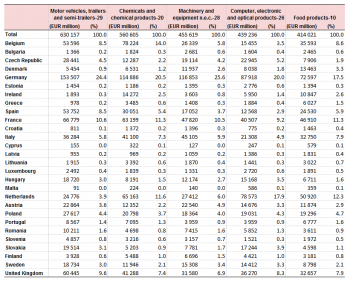
In 1994, the top 5 intra-EU exported products by value (see Table 1) were ‘Motor vehicles, trailers and semi-trailers’ (EUR 96 billion) followed by ‘Chemicals and chemical products’ (EUR 77 billion), ‘Computer, electronic and optical products’ (EUR 71 billion), ‘Food products’ (EUR 65 billion) and ‘Machinery and equipment’ (EUR 61 billion).
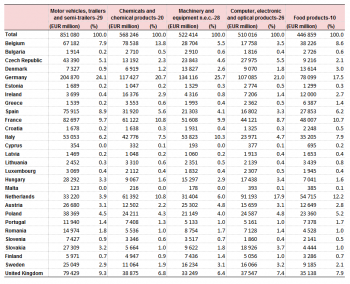
Ten years later, in 2004, the top 5 intra-EU exported goods were the same but in a different order (except for ‘Motor vehicles, trailers and semi-trailers’, which kept the top spot). In 2006, ‘Basic metals’ (EUR 160 billion) replaced ‘Food products’ as the fifth most exported product in intra-EU trade. However, in 2012, 2013 and 2016, the top 5 intra-EU exported goods by value were again the same as in 1994 with the same top three. Only positions four and five were reversed with ‘Computer, electronic and optical products’ overtaking ‘Food products’.
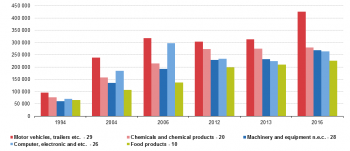
The evolution of the 5 most traded intra-EU products (Figure 2) shows that ‘Motor vehicles, trailers and semi-trailers’ had the highest value of exports. It also shows that the greatest increase for all of the top 5 products in the value of intra-EU exports took place during the period of greatest EU expansion (1994–2006) as one might expect. After 2006 the value of exports within the EU for both ‘Motor vehicles, trailers and semi-trailers’ and ‘Computer, electronic and optical products’ fell. In 2006 the export figures were EUR 318 billion and EUR 297 billion respectively, falling in 2012 to EUR 303 billion and EUR 233 billion respectively.
The fall in the value of exports of ‘Computer, electronic and optical products’ continued between 2012 and 2013. It recovered somewhat by 2016 although it was still 12 % less than in 2006. Exports of ‘Motor vehicles, trailers and semi-trailers’ exhibited a smaller decline, dropping by 5 % from 2006 to 2012, recovering slightly between 2012 and 2013 followed by strong growth of 36 % between 2013 and 2016. For the remaining three product types Figure 2 shows a continued increase until 2012 after which the trend levels out to 2013 but picks up again after that.
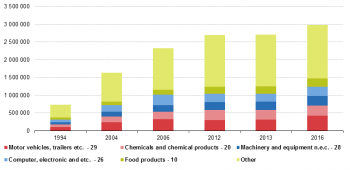
The evolution of the value of the top 5 products exported within the EU follows a similar trend as total exports (Figure 3). In 1994, the value of the top 5 goods exported to other EU Member States was EUR 369 billion or just over half the value of all goods exported within the EU. In 2004 (EUR 822 billion) and 2006 (EUR 1 179 billion), the top 5 intra-EU exported goods by value also accounted for over half of intra-EU goods exports. By 2012 and 2013, the relative importance of the top 5 goods traded within the EU had decreased to 46 % of the value of total intra-EU exports (EUR 1 238 billion in 2012, EUR 1 252 billion in 2013). In 2016 the share increased to 49 % and the absolute value grew to EUR 1 465 billion.
Intra-EU trade of the most traded goods by Member State
The analysis in this section looks at intra-EU trade by individual EU Member State. For this analysis we consider each EU Member State’s trade in goods with its EU partners by looking at the sum of its imports and exports. Since EU Member States’ trade with the rest of the EU is considered as an aggregate figure we are unable to examine any changes in the importance of individual bilateral trade relationships.
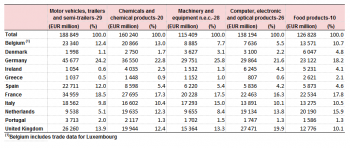
Table 2 shows that in 1994, Germany was the leading trading nation in the EU-12 with the highest total trade in all the 5 most significant products. France was ranked second in 4 of these 5 products (the United Kingdom was second for ‘Computer, electronic and optical products’). Greece, Portugal and Ireland had the lowest total trade in these 5 products.
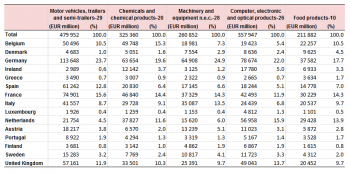
In 1995, three countries joined the EU, Austria, Finland and Sweden. In 2004 their share in intra-EU trade for the five most traded products varied from 5 % in Chemicals, 6 % in Food, 8 % in both Computers in and Motor vehicles to 11 % in Machinery (see Table 3). This off course meant the former EU-12 shares decreased by the same amount. However in absolute terms this period saw strong growth in intra-EU trade for the former EU-12, partly helped by the enlargement.
The ten countries that joined the EU in 2004 had combined shares in intra-EU trade between 7% in Chemicals to 12 % in both Motor vehicles' and 'Machinery' with Food (8 %) and Computers (11 %) in between. These shares came mainly from the former EU-12 as the shares for Austria, Finland and Sweden remained close to what they were in 2004.
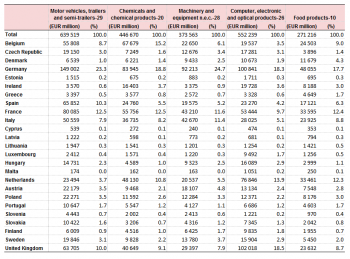
In 2012, Bulgaria and Romania, who joined the EU in 2007, had combined shares in the EU of between 1.2 % in Chemicals to 2.1 % in Machinery. The financial crisis of 2008/2009 meant that growth between 2006 and 2012 was fairly low. Slovakia had the highest average annual growth rates in four of the five product groups, 10 % in both Motor vehicles and Machinery, 13 % in Computers and 15 % in Food. In Chemicals, Lithuania had the highest growth rate (14 %). Denmark had the lowest growth rate in Food which was 2 % while trade declined most in Greece for Motor vehicles (- 20 %) and Machinery (-11 %) and in Ireland for Computers (-19 %) and Chemicals (- 1%)
In 2013, Croatia joined the EU. In that year its shares for the 5 product groups discussed were lower than 0.5 %. Between 2012 and 2013, trade declined most in Cyprus for Motor vehicles (-40 %), Machinery (- 22 %) and Chemicals (-8 %), in Luxembourg for Computers (- 19 %) and in Slovakia for Food (- 3%). The highest growth rates were found in Latvia for Computers (16 %) and Food (15 %), in Lithania for Machinery (18 %), in Hungary for Motor vehicles (18 %) and in Malta for Chemicals (23 %)
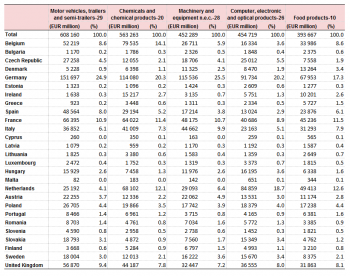
Between 2013 and 2016, the composition of the EU remained unchanged. In this period Motor vehicles had the highest average annual growth rate of 11 % for the EU-28 as a whole. It was highest in Cyprus (32 %), Croatia (27 %) and Ireland (25 %). Chemicals had the lowest growth rate for the EU as a whole, close to zero. Here only Bulgaria (14 %) had a growth rate of more than 10 % while in eight countries (Estonia, France, Lithuania, Malta, the Netherlands, Finland, Sweden and the United Kingdom) trade decreased.
Data sources and availability
EU data comes from Eurostat’s COMEXT database.
COMEXT is the Eurostat reference database for international trade in goods. It provides access not only to both recent and historical data from the EU Member States but also to statistics of a significant number of non-EU countries. International trade aggregated and detailed statistics disseminated from Eurostat website are compiled from COMEXT data according to a monthly process. Because COMEXT is updated on a daily basis, data published on the website may differ from data stored in COMEXT in case of recent revisions.
Information on intra-EU trade is collected by the EU Member States using the various media placed at the disposal of the information providers. These may be paper or electronic declarations provided for at national level. The declarations are addressed directly to the competent national administrations.
European statistics on international trade in goods are compiled according to the EU concepts and definitions and may, therefore, differ from national data published by Member States.
Product classification
Classification of products by activity (CPA) is a statistical classification of products and services obligatory for all EU Member States. CPA classifies products by activity in which they are produced. Products are transportable goods and services. The CPA is a product classification whose elements are related to activities as defined by NACE Rev. 2. Each product - whether it be a transportable or a non-transportable good or a service - is assigned to one single NACE Rev. 2 activity. The linkage to activities as defined by NACE Rev. 2 gives the CPA a structure parallel to that of NACE Rev. 2 at all levels distinguished by NACE Rev. 2.
Unit of measure
Trade values are expressed in billions (109) or millions (106) of euros. They correspond to the statistical value, i.e. to the amount which would be invoiced in case of sale or purchase at the national border of the reporting country. It is called a FOB value (free on board) for exports and a CIF value (cost, insurance, freight) for imports.
Comparability across countries
Intra-EU statistics of EU Member States are comparable across countries since:
- European statistics are drawn up on the basis of a broadly common methodology and common definitions;
- the problem of the FOB and CIF valuations generally plays a smaller role in view of the geographical context and the structure of intra-EU trade;
- given the rules for determining reference periods, time delays should not have such a large impact — at least on annual results;
- the trade partner for intra-EU imports is always the EU Member State of consignment, not the country of origin of the goods.
Context
The European internal market, also referred to as the Single Market, allows people and businesses to move and trade freely across the 28-nation group. The cornerstones of the single market are the free movement of people, goods, services and capital, known collectively as the ‘four freedoms’, which are included in the EU Treaty. Articles 34 to 36 of the Treaty of the functioning of the EU prohibit quantitative restrictions on imports, exports or goods in transit and all similar restrictive measures between EU Member States. All measures capable of hindering directly or indirectly such imports are considered to be quantitative restrictions. Additionally because the 28 EU Member States share a single market and a single external border, they also have a single trade policy. Both in the World Trade Organization (WTO), where the rules of international trade are agreed and enforced, and with individual trade partners, EU Member States speak and negotiate collectively.
See also
Further Eurostat information
Data visualisation
- Did you know? Some funny and curious facts about trade of the EU
- Top 5 partners in trade in goods
- My Country in a bubble
Main tables
- International trade in goods - aggregated data (ext_go_agg)
- International trade in goods - detailed data (detail)
Database
Dedicated section
Methodology / Metadata
- International trade in goods statistics - background
- International trade in goods (ESMS metadata file — ext_go_agg_esms)
- User guide on European statistics on international trade in goods
Source data for tables, figures and maps (MS Excel)
Other information — Legal background
- Regulation (EC) No 471/2009 of 6 May 2009 on Community statistics relating to external trade with non-member countries
- Regulation (EU) No 92/2010 of 2 February 2010 implementing Regulation (EC) No 471/2009, as regards data exchange between customs authorities and national statistical authorities, compilation of statistics and quality assessment
- Regulation (EU) No 113/2010 of 9 February 2010 implementing Regulation (EC) No 471/2009 , as regards trade coverage, definition of the data, compilation of statistics on trade by business characteristics and by invoicing currency, and specific goods or movements.
External links
- European Commission — Trade
- European Commission — Globalisation
- European Commission — Single market for goods
Notes
