Archive:Main goods in extra-EU imports
- Data extracted in Month YYYY. Most recent data: Further Eurostat information, Main tables and Database. Planned article update: (dd) Month YYYY(, hh:00).
This article focuses on the most significant goods by value (according to the CPA classification) in extra-EU imports. It presents statistics for the EU-28 (2013 and 2016), EU-27 (2012), EU-25 (2006), EU-15 (2004) and EU-12 (1994) aggregates. Many of the EU's imports consist of raw materials and intermediary products which are important inputs for EU industries to produce final goods both for the EU's internal market as for extra-EU exports.
Main statistical findings
Evolution of extra-EU imports
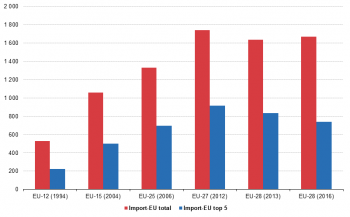
Between 1994 and 2006 extra-EU exports more than doubled from EUR 539 billion to EUR 1371, equivalent to an average annual growth of 8.1 %. Between 2006 and 2012 a the growth rate fell to 4.6 %) which brought exports to EUR 1798 billion. However since then, up to 2016 exports fell to EUR 1710 billion equivalent to an average annual growth of - 1.2 %. Between 1994 and 2012 growth rates for the top 5 imported products were fairly similar. However from 2012 to 2016 the imports of the top 5 products fell much more from EUR 916 billion to EUR 740 billion, a growth rate of -5.2 %.
The 5 most significant products in intra-EU trade
There has been a degree of consistency in those goods that have been most significant in terms of value imported within the EU, although some variations in the evolution of the import figures for these goods can be seen.
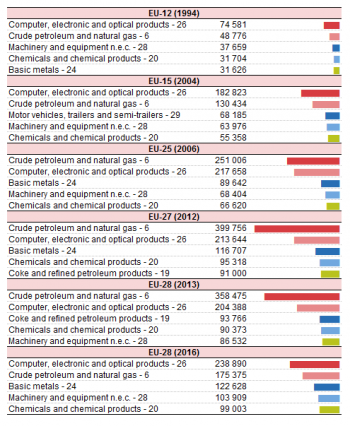
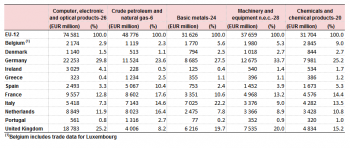
In 1994 the top 5 intra-EU imported products by value (see Table 1) were ‘Computer, electronic and optical products’ (EUR 74 billion), ‘Crude petroleum and natural gas‘ (EUR 48 billion), ‘Machinery and equipment’ (EUR 37 billion), ‘Chemicals and chemical products’ and ’Basic metals’ (both EUR 32 billion). At the end of the period in 2016, the top 5 extra-EU imported goods were the same and with roughly similar shares in total imports. In between ’Basic metals’ dropped out of the top 5 in 2004 when its place was taken by 'Motor vehicles' and in 2013 by 'Coke and refined petroleum products' which had also appeared in 2012 at the expense of 'Machinery and equipment'.
The evolution of the value of the top 5 products imported within the EU follows a similar trend. In 1994, the value of the top 5 goods imported to other EU Member States was EUR 369 billion or just over half the value of all goods imported within the EU. In 2004 (EUR 822 billion) and 2006 (EUR 1 179 billion), the top 5 intra-EU imported goods by value also accounted for over half of intra-EU goods imports. By 2012 and 2013, the relative importance of the top 5 goods traded within the EU had decreased to between 46 % and 47 % of the value of total intra-EU imports (EUR 1 238 billion in 2012, EUR 1 253 billion in 2013).
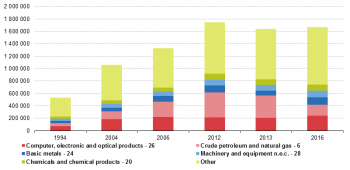
When we trace back the evolution of the 5 most imported extra-EU products in 2016 (see Figure 2) we that the top two places were shard by ‘Computer, electronic and optical products’ and ‘Crude petroleum and natural gas‘. The former was ahead in 1994, 2004 and 2016 while the latter led in 2006, 2012 and 2013 partly due to higher oil prices. The remaining three products frequently swapped positions but their shares in total extra-EU imports always stayed between 4 % and 6 %.
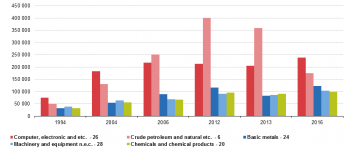
Between 1994 and 2004 and between 2004 and 2006 imports for all five products increased (see Figure 3). With the exception of ‘Computer, electronic and optical products’ this was also true between 2006 and 2012. However between 2012 and 2013 imports for all 5 products decreased. Finally, with the exception of ‘Crude petroleum and natural gas‘, imports increased again between 2013 an 2016. With 6.4 %, the highest average annual growth over the whole period was achieved by 'Basic metals'. Only ‘Machinery and equipment’ (4.7 %) grew less than 5 % annually.
Extra-EU imports of the most imported goods by Member State
In the following analysis the
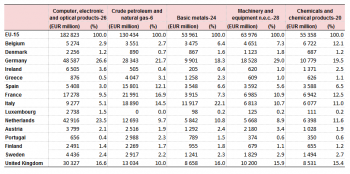
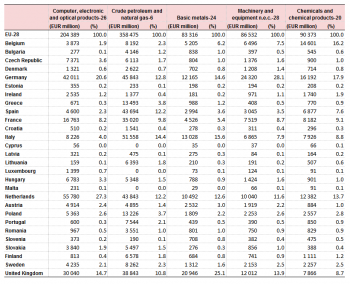
The analysis in this section looks at extra-EU imports by individual EU Member State. Table 2 shows that in 1994, Germany was the largest importer for the 5 most significant products in extra-EU imports. For the most part France, Italy and the United Kingdom occupied the 2nd to 4th spots in differing order. The Netherlands appeared twice in the top 4, replacing Italy in ‘Computer, electronic and optical products’ and the United Kingdom in ‘Crude petroleum and natural gas‘
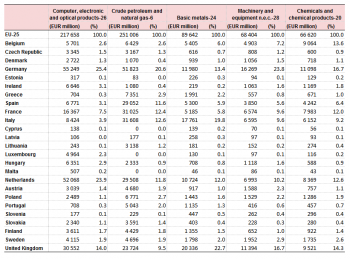
In 2006, ten countries joined the EU (see Table 4). For the five products shown, their combined share in imports was largest for Crude petroleum and natural gas (7.8 %) and smallest for 'Basic metals' (5.0 %). The Netherlands swapped places again with Spain as 4th largest importer of Crude petroleum and natural gas and it replaced France in the top for both 'Machinery and equipment' and 'Chemicals and chemical products'. Besides Germany, the Netherlands was now the only country appearing in the top 4 for all five products. However Dutch trade flows are over-estimated because of the so-called ‘Rotterdam effect’ (or quasi-transit trade): that is goods bound for other EU countries arrive in Dutch ports and, according to EU rules, are recorded as extra-EU imports by the Netherlands (the country where goods are released for free circulation). This in turn increases the intra-EU flows from the Netherlands to those Member States to which the goods are re-exported. To a lesser extent, Belgian figures are similarly overestimated.
In 2012 France dropped out of the top 4 in 'Crude petroleum and natural gas' in favour of Spain (see Table 5). However it entered the top 4 in both 'Machinery and equipment' and 'Chemicals and chemical products replacing Italy and the United Kingdom respectively. Romania and Bulgaria who entered the EU in 2012 had import shares below 1% in four of the five products. Only in 'Crude petroleum and natural gas' were their shares slightly higher.
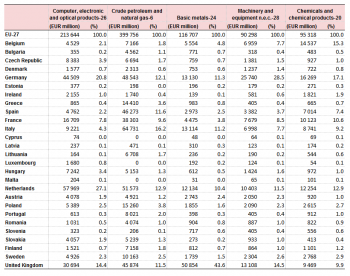
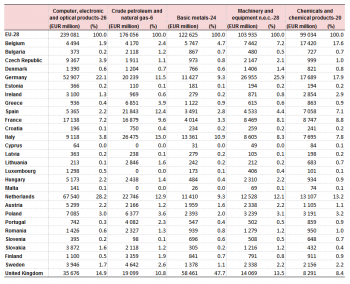
Between 2012 and 2013 no changes in the top four were seen for any of the five products (see Table 6). In 2013 absolute values for all 5 products had dropped compared to the previous. Until then this had only happened in 'Computer, electronic and optical products' between 2006 and 2012. Croatia who joined the EU in 2013 had shares below 0.5 % for all five products.
Croatia's shares remained below 0.5 % three years later in 2016 (see Table 7). Imports for four of the five products bounced back surpassing the level they had in 2012. The only exception to this was 'Crude oil and natural gas' where falling prices caused the value of imports to fall from EUR 400 billion in 2012 to only EUR 175 billion in 2016. Compared to 2013 there was only one change in the top 4 in 'Machinery and equipment' where Italy edged out France from the fourth place.
Data sources and availability
EU data comes from Eurostat’s COMEXT database.
COMEXT is the Eurostat reference database for international trade in goods. It provides access not only to both recent and historical data from the EU Member States but also to statistics of a significant number of non-EU countries. International trade aggregated and detailed statistics disseminated from Eurostat website are compiled from COMEXT data according to a monthly process. Because COMEXT is updated on a daily basis, data published on the website may differ from data stored in COMEXT in case of recent revisions.
European statistics on international trade in goods are compiled according to the EU concepts and definitions and may, therefore, differ from national data published by Member States.
Product classification
Classification of products by activity (CPA) is a statistical classification of products and services obligatory for all EU Member States. CPA classifies products by activity in which they are produced. Products are transportable goods and services. The CPA is a product classification whose elements are related to activities as defined by NACE Rev. 2. Each product - whether it be a transportable or a non-transportable good or a service - is assigned to one single NACE Rev. 2 activity. The linkage to activities as defined by NACE Rev. 2 gives the CPA a structure parallel to that of NACE Rev. 2 at all levels distinguished by NACE Rev. 2.
Unit of measure
Trade values are expressed in millions (106) of euros. They correspond to the statistical value, i.e. to the amount which would be invoiced in case of sale or purchase at the national border of the reporting country. It is called a FOB value (free on board) for exports and a CIF value (cost, insurance, freight) for imports.
Context
The automobile industry remains of prime importance for the EU, producing about a quarter of the world total of motor vehicles. The industry accounts for 5 % of employment in the EU and is an important contributor to many of the EU's national economies. In Germany, for example, the industry's share in manufacturing as a whole is close to 20 %, according to the European Automobile Manufacturers' Association. Trade in new and used motor vehicles accounts for a substantial part of the EU total, with close to 6 % of the total value of all extra-EU exports in 2011. The industry has suffered from the financial crisis which started in 2008 and is also under pressure from environmental regulation to curb tailpipe emissions.
See also
Further Eurostat information
Data visualisation
- Did you know? Some funny and curious facts about trade of the EU
- Top 5 partners in trade in goods
- My Country in a bubble
Main tables
- International trade in goods - long-term indicators (t_ext_go_lti)
- International trade of machinery and transport equipment (SITC 7), by declaring country (tet00009)
- Extra-EU28 trade of machinery and transport equipment (SITC 7), by Member State (tet00059)
- Extra-EU28 trade of machinery and transport equipment (SITC 7), by main partners (tet00030)
- International trade in goods - short-term indicators (t_ext_go_sti)
- Imports of goods - machinery and transport equipment (teiet170)
- Exports of goods - machinery and transport equipment (teiet070)
Database
- International trade in goods - aggregated data (ext_go_agg)
- International trade in goods - detailed data (detail)
Dedicated section
Methodology / Metadata
- International trade in goods statistics - background
- International trade in goods (ESMS metadata file — ext_go_esms)
- User guide on European statistics on international trade in goods
Source data for tables, figures and maps (MS Excel)
Other information — Legal background
- Regulation (EC) No 471/2009 of 6 May 2009 on Community statistics relating to external trade with non-member countries
- Regulation (EU) No 92/2010 of 2 February 2010 implementing Regulation (EC) No 471/2009, as regards data exchange between customs authorities and national statistical authorities, compilation of statistics and quality assessment
- Regulation (EU) No 113/2010 of 9 February 2010 implementing Regulation (EC) No 471/2009 , as regards trade coverage, definition of the data, compilation of statistics on trade by business characteristics and by invoicing currency, and specific goods or movements.
External links
Notes
[[Category:<Subtheme category name(s)>|Name of the statistical article]] [[Category:<Statistical article>|Name of the statistical article]]
Delete [[Category:Model|]] below (and this line as well) before saving!
