Archive:Main goods in extra-EU exports
- Data extracted in September 2017. Most recent data: Further Eurostat information, Main tables and Database. Planned article update: September 2018
This article focuses on the most significant goods by value (according to the CPA classification) in extra-EU exports. It presents statistics for the EU-28, EU-27, EU-25, EU-15 and EU-12 aggregates for the years 2016, 2013, 2012, 2006, 2004 and 1994 respectively. Statistics on goods traded between the EU and the world — especially the size and evolution of exports — enable the EU and national authorities to evaluate the health and competitiveness of EU industries. These statistics also provide EU businesses with essential information for their sales and marketing policies.
Main statistical findings
# Extra-EU exports tripled between 1994 and 2016, in part due to successive increases in the composition of the EU;
# In this period the most exported goods were:
- machinery and equipment (CPA 28),
- motor vehicles (CPA 29)
- pharmaceutical products (CPA 21)
- chemical products (CPA 20)
- computer, electronic and optical products (CPA 26)
Evolution of extra-EU export
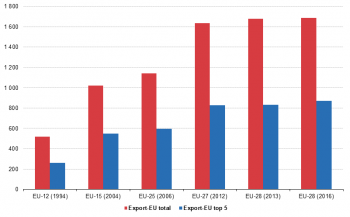
The value of extra-EU exports has grown from EUR 542 billion in 1994 to EUR 1 744 billion in 2016 (see Figure 1). It must be noted that this rise reflects to a large extent the increase in the composition of the EU over this period.
In the same period the value of extra-EU imports grew slighty less from EUR 539 billion in 1994 to EUR 1 710 billion in 2016 (see Extra-EU_import_of_the_imported goods). Consequently the trade balance grew from EUR 3 billion in 1994 to EUR 33 billion in 2016. However in between these two years the trade balance had been as low as EUR - 185 billion in 2006 (see Extra-EU trade in goods.
The evolution of the value of the top 5 products exported within the EU follows a similar trend. In 1994, the value of these products was EUR 259 billion which was 48 % of the value of all extra-EU exports. In 2004 (EUR 548 billion) and 2006 (EUR 597 billion), this share was slightly more than 50 % but in 2012 and 2013, it dropped back to 49 % and 48 % respectively. Finaly in 2016 at (EUR 871 billion) it was almost exactly 50 %.).
The 5 most significant products in extra-EU exports
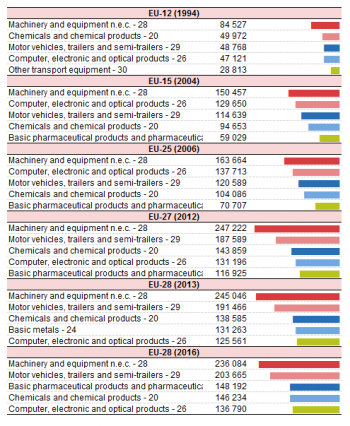
There has been a degree of consistency in the top 5 products in extra-EU exports in terms of value. Four of them appear during the whole period. These are ‘Machinery and equipment’, ‘Motor vehicles, trailers and semi-trailers’ , ‘Chemicals and chemical products’ and ‘Computer, electronic and optical products’. ‘Basic pharmaceutical products’ appear in four of the six years shown and was replaced by ‘Other transport equipment‘ in 1994 and by ‘Basic metals‘ in 2013 but reappeared in 2016. (see Table 1)
‘Machinery and equipment’ held the first place in all years show. ‘Motor vehicles, trailers and semi-trailers’ started out as third but reached 2nd in 2012 where it stayed. ‘Computer, electronic and optical products’ started as 4th in 1994, rose to 2nd in 2004 and 2006 but then fell back to 4th in 2012 and 5th in 2013 and 2016. ‘Chemicals and chemical products’ was 2nd in 1994, dropped to 4th in 2004 and 2006 climbed to 3rd in 2012 and 2013 but had to settle for 4th in 2016. ‘Basic pharmaceutical products’ which had been 5th in 2004, 2006 and 2012,dropped out of the top 5 in 2013 but reappeared as 3rd in 2016.
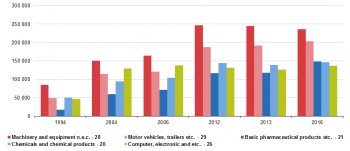
Figure 2 shows the top 5 products of 2016 over the whole period. Between 1994 and 2004 the largest growth is found in ‘Computer, electronic and optical products’. After 2004 export values of ‘Computer, electronic and optical products’ since 2004 do not grow much and are overtaken by ‘Motor vehicles, trailers and semi-trailers’ and ‘Chemicals and chemical products’ in 2012 and by ‘Basic pharmaceutical products’ in 2016.
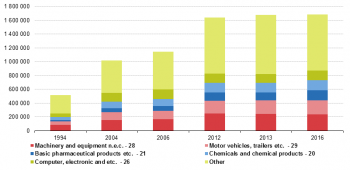
Figure 3 adds 'Other' to the top 5 products thus showing the total value of exports. Three of the five products as well at 'Other' grow by 4.8 to 5.1 %. Motor vehicles grow slightly more by 6.7 %. It is in 'Basic pharmaceutical products' we find the highest growth of more than 10.3 % lifting the total growth to 5.5 %.
Most traded goods in Extra-EU exports by Member State
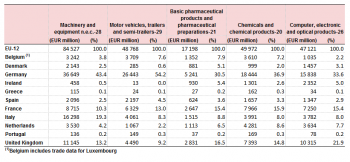
The analysis in this section looks at extra-EU exports by individual EU Member State. Table 2 shows that in 1994, Germany was the leading EU exporter with the highest total volume trade in each of the 5 most significant products (‘Machinery and equipment’ (EUR 37 billion), ‘Motor vehicles, trailers and semi-trailers’ (EUR 26 billion), ‘Basic pharmaceutical products’ (EUR 5 billion), ‘Chemicals and chemical products’ (EUR 18 billion) and ‘Computer, electronic and optical products’ (EUR 16 billion). Italy held the second position ‘Machinery and equipment’ while France (Motor vehicles, trailers and semi-trailers’ and ‘Chemicals and chemical products’) and the UK (‘Basic pharmaceutical products’ and ‘Computer, electronic and optical products’) were both second in two product groups.
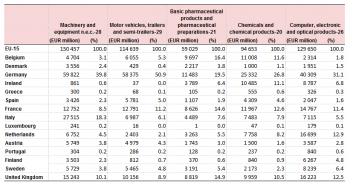
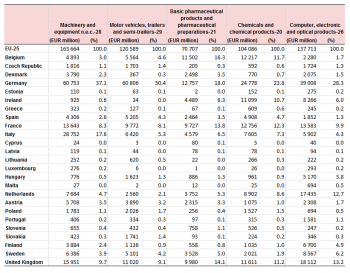
Tables 2 to 6 show that over the 1994–2013 period the larger economies in the EU continued to have the highest trade values for the 5 most significant products. However, as might be expected, the trade value of the EU-12 Member States as a proportion of total intra-EU trade decreased as the EU expanded. For ‘Motor vehicles, trailers and semi-trailers’, ‘Computer, electronic and optical products’ and ‘Food products’ the EU-12 accounted for 70–75 % of the total intra-EU trade in these products by 2013. For ‘Chemicals and chemical products’ and ‘Machinery and equipment’ (EUR 32 billion) the EU-12 accounted for over 80 % of the total intra-EU trade in these products by 2013.
From 1994 to 2013 intra-EU trade in ‘Motor vehicles, trailers and semi-trailers’ more than tripled from EUR 49 billion to EUR 166 billion. With the exception of Greece, all other EU Member States registered an increase in this sector. Over the period Germany remained the largest trader by value of ‘Motor vehicles, trailers and semi-trailers’ with the value of its trade to other EU Member States more than tripling between 1994 and 2013, although this value has been relatively stable since 2006. Germany's relative share of intra-EU trade of motors remained at over one quarter of the total. This growth was driven by both increases in the price of these goods and changes in the composition of the EU as well as any increase in the volume of trade of motors.
For intra-EU trade in ‘Chemicals and chemical products’, Germany again had the largest share of trade throughout the period with between 19 % and 23 % of the EU total, more than tripling in value — from EUR 35 billion in 1994 to EUR 121 billion in 2013. France’s share fell over the same period from 17 % (second place in 1994 with EUR 22 billion) to 11 % in 2013 (fourth place with EUR 61 billion). In 2013 the Member States that joined the EU from 2004 onwards made up 11 % of the trade in chemicals. Poland ranked eighth in this sector in 2013 with 4 % of the total intra-EU trade following a 29 % increase from 2006 to 2013 (from EUR 15 billion to EUR 20 billion).
The share of ‘Computer, electronic and optical products’ in total intra-EU trade grew between 1994 and 2006 from 10 % to 13 %. In 2012 the percentage dropped to 9 % and to 8 % in 2013. With an increase in value of EUR 320 billion over this period, intra-EU trade of ‘Computer, electronic and optical products’ more than doubled. Germany maintained the highest share of this sectors’ trade during this period, reaching 26 % in 2013. Although for the United Kingdom, intra-EU trade in this sector grew by 35 % from 1994 to 2013, its share in the total EU trade of ‘Computer, electronic and optical products’ went down from 18 % to 7 %. The Netherlands showed a similar pattern in trade in this product type with a decrease of 9 percentage points during the same period.
The Member States that joined the EU from 2004 onwards have made a contribution to the increase of intra-EU trade in this sector. Their share has increased from 4 % in 2004 to 11 % in 2012 and 16 % in 2013. Poland and the Czech Republic both had a 4 % share of the intra-EU trade of ‘Computer, electronic and optical products’ in 2013 and both EU Member States have showed increases from 2006 to 2013 (from EUR 10 billion and EUR 7 billion in 2006 to EUR 19 billion and EUR 17 billion in 2013, respectively).
The intra-EU trade of ‘Food products’ as a proportion of total intra-EU trade has remained stable, ranging from 8 % to 9 %, and in value this sector showed an increase of EUR 312 billion from 1994 to 2013. The largest share of total trade continues to be held by Germany and in 2013 it was closely followed by the Netherlands. In fact, the Netherlands has gained exportance in this area, growing from a 6 % share in 2004 to a 17 % share in 2013. The Member States that have joined the EU since 2004 held more than a fifth (21 %) of total EU trade in this sector in 2013. Of the 12 EU Member States that reported figures in 1994, only Greece registered a decrease in the value of intra-EU trade in food products.
Intra-EU trade in ‘Machinery and equipment’ was the sector which showed the smallest increase in value terms (EUR 298 billion), but the highest growth rate (with its value of EUR 413 billion in 2013 over three times the figure in 1994 of EUR 115 billion). Intra-EU trade in this sector increased in all EU Member States. Germany had the highest share throughout the years under consideration; however its share in total intra-EU trade in this sector has decreased from 28 % in 1994 to 18 % in 2013. This was also the case for France, the United Kingdom, Italy and the Netherlands. The other EU-12 countries registered an increase in their share of intra-EU trade in ‘Machinery and equipment’. The share of intra-EU trade in this sector for the 13 EU Member States who have joined the EU since 2004 was 13 % in 2013.
Intra-EU trade of the most traded goods by Member State, 2013-2015
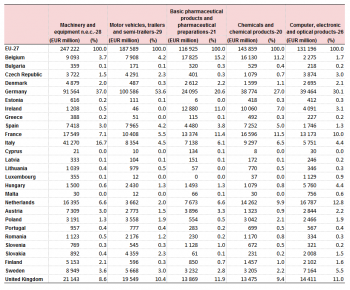
Between 2013 and 2015 the composition of the EU remained the same. Nevertheless exports in all of the top 5 traded products increased. Germany was the largest exporter in each of the top 5 products. The highest increase of intra-EU exports between 2013 and 2015 occurred in "Motor vehicles" (+25 %), where the United Kingdom's export share increased the most (+0.8 p.p.) while France's declined most (-0.9 p.p). There was more moderate growth in "Computers and electronics" and in "Machinery and equipment" of +16 % and +11 % respectively. The largest fluctuations in these two group were in French exports in "Computers and electronics" which fell -0.6 p.p. In "Machinery and equipment" Poland's exports increased by 0.7 p.p. Growth was rather small in "Food products" (+5 %) and "Chemical products" (+ 3 %) without much change in countries shares of the EU exports.
There were four countries that gained market share in each of the top 5 trade products namely Czech Republic, Ireland, Spain and Croatia. There were three countries that lost market share in each of the 5 top traded products, namely Estonia, France and Sweden. Of these three France (+16 billion EUR) and Sweden (+5 billion EUR) nevertheless saw their exports in absolute terms rise. Only Estonia saw its exports in absolute terms fall (-234 million EUR), a feat it shared with Malta (-128 million EUR) . Croatia (+38 %) and Czech Republic (+24 %) saw the highest growth rate of their exports in the top 5 traded products.
Data sources and availability
EU data comes from Eurostat’s COMEXT database.
COMEXT is the Eurostat reference database for international trade in goods. It provides access not only to both recent and historical data from the EU Member States but also to statistics of a significant number of non-EU countries. International trade aggregated and detailed statistics disseminated from Eurostat website are compiled from COMEXT data according to a monthly process. Because COMEXT is updated on a daily basis, data published on the website may differ from data stored in COMEXT in case of recent revisions.
European statistics on international trade in goods are compiled according to the EU concepts and definitions and may, therefore, differ from national data published by Member States.
Product classification
Classification of products by activity (CPA) is a statistical classification of products and services obligatory for all EU Member States. CPA classifies products by activity in which they are produced. Products are transportable goods and services. The CPA is a product classification whose elements are related to activities as defined by NACE Rev. 2. Each product - whether it be a transportable or a non-transportable good or a service - is assigned to one single NACE Rev. 2 activity. The linkage to activities as defined by NACE Rev. 2 gives the CPA a structure parallel to that of NACE Rev. 2 at all levels distinguished by NACE Rev. 2.
Unit of measure
Trade values are expressed in millions (106) of euros. They correspond to the statistical value, i.e. to the amount which would be invoiced in case of sale or purchase at the national border of the reporting country. It is called a FOB value (free on board) for exports and a CIF value (cost, insurance, freight) for imports.
Context
The automobile industry remains of prime importance for the EU, producing about a quarter of the world total of motor vehicles. The industry accounts for 5 % of employment in the EU and is an important contributor to many of the EU's national economies. In Germany, for example, the industry's share in manufacturing as a whole is close to 20 %, according to the European Automobile Manufacturers' Association. Trade in new and used motor vehicles accounts for a substantial part of the EU total, with close to 6 % of the total value of all extra-EU exports in 2011. The industry has suffered from the financial crisis which started in 2008 and is also under pressure from environmental regulation to curb tailpipe emissions.
See also
Further Eurostat information
Data visualisation
- Did you know? Some funny and curious facts about trade of the EU
- Top 5 partners in trade in goods
- My Country in a bubble
Main tables
- International trade in goods - long-term indicators (t_ext_go_lti)
- International trade of machinery and transport equipment (SITC 7), by declaring country (tet00009)
- Extra-EU28 trade of machinery and transport equipment (SITC 7), by Member State (tet00059)
- Extra-EU28 trade of machinery and transport equipment (SITC 7), by main partners (tet00030)
- International trade in goods - short-term indicators (t_ext_go_sti)
- Imports of goods - machinery and transport equipment (teiet170)
- Exports of goods - machinery and transport equipment (teiet070)
Database
- International trade in goods - aggregated data (ext_go_agg)
- International trade in goods - detailed data (detail)
Dedicated section
Methodology / Metadata
- International trade in goods statistics - background
- International trade in goods (ESMS metadata file — ext_go_esms)
- User guide on European statistics on international trade in goods
Source data for tables, figures and maps (MS Excel)
Other information — Legal background
- Regulation (EC) No 471/2009 of 6 May 2009 on Community statistics relating to external trade with non-member countries
- Regulation (EU) No 92/2010 of 2 February 2010 implementing Regulation (EC) No 471/2009, as regards data exchange between customs authorities and national statistical authorities, compilation of statistics and quality assessment
- Regulation (EU) No 113/2010 of 9 February 2010 implementing Regulation (EC) No 471/2009 , as regards trade coverage, definition of the data, compilation of statistics on trade by business characteristics and by invoicing currency, and specific goods or movements.
External links
Notes
[[Category:<Subtheme category name(s)>|Name of the statistical article]] [[Category:<Statistical article>|Name of the statistical article]]
Delete [[Category:Model|]] below (and this line as well) before saving!
