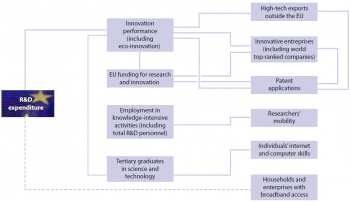
- Data from December 2014. Most recent data: Further Eurostat information, Main tables. Planned article update: August 2016.
This article is part of a set of statistical articles based on the Eurostat publication Smarter, greener, more inclusive? - Indicators to support the Europe 2020 strategy. It provides recent statistics on research, development and innovation in the European Union (EU), key areas of the EU's Europe 2020 strategy.
Having more innovative products and services on the market addresses two objectives of the strategy’s smart growth objective: job creation through increased industrial competitiveness, labour productivity and the efficient use of resources; and finding solutions to societal challenges such as climate change and clean energy, security, and active and healthy ageing.
Europe 2020 strategy target on R&D The Europe 2020 strategy sets the target of ‘improving the conditions for innovation, research and development’ [1], in particular with the aim of ‘increasing combined public and private investment in R&D to 3 % of GDP’ by 2020 [2].

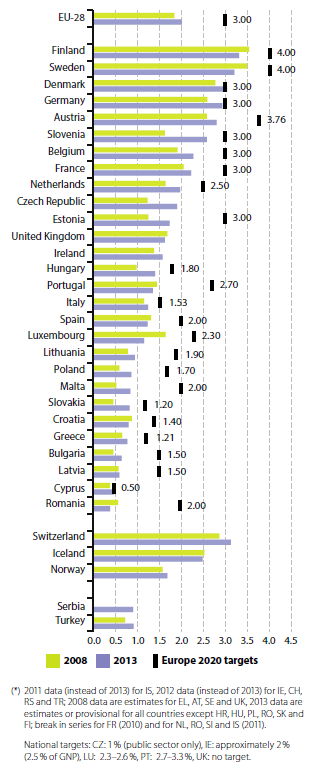
(% of GDP)
Source: Eurostat online data code (t2020_20)
Source: Eurostat online data code (t2020_20)
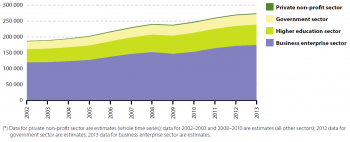
(EUR million)
Source: Eurostat online data code (rd_e_gerdtot)

(% change over previous year)
Source: Eurostat online data code (rd_e_gerdtot)
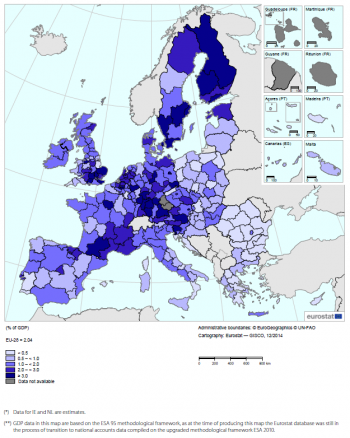
(% of ESA 95 based GDP)
Source: Eurostat online data code (rd_e_gerdreg)
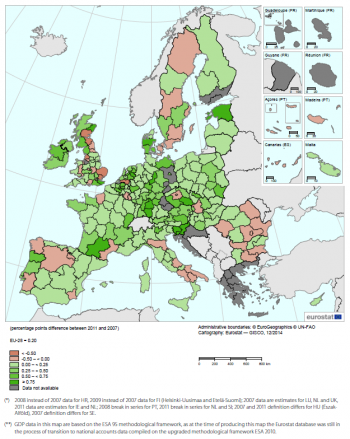
(percentage points difference between 2011 and 2007, % of ESA 95 based GDP)
Source: Eurostat online data code (rd_e_gerdreg)
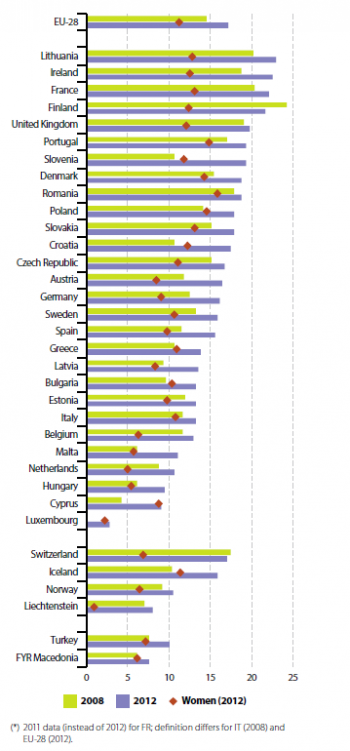
(Graduates per 1 000 inhabitants, 20 to 29 years old)
Source: Eurostat online data code (tps00188)
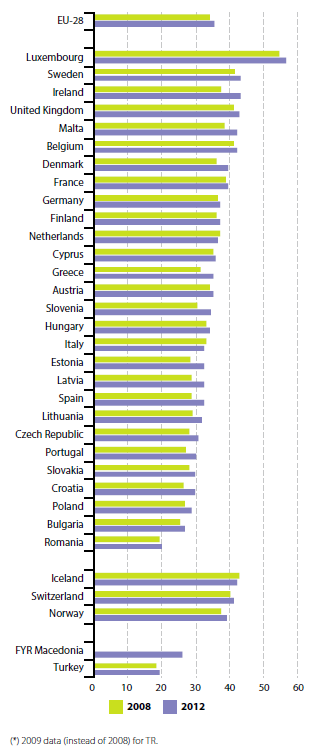
(% of total employment)
Source: Eurostat online data code (htec_kia_emp2)
(Full-time equivalents, % of the labour force)
Source: Eurostat online data code (rd_p_perslf)
(%)
Source: MORE2 Higher Education Survey (2012)

(% of households and % of enterprises)
Source: Eurostat online data code (tin00089) and (tin00090)
(% of the total number of individuals aged 16 to 74)
left: computer skills, 2007 and 2012 (*)
right:internet skills, 2007 and 2013 (**)
Source: Eurostat online data code (tsdsc460) and (tsdsc470)
(Index)
Source: European Commission, Innovation Union Scoreboard 2014, Brussels, 2014

(% of the total number of enterprises)
Source: Eurostat online data code (inn_cis7_type)
(Index EU 28=100)
Source: European Commission, Eco-Innovation Observatory, online data code (t2020_rt20)
(Number)
Source: Eurostat online data code (pat_ep_nnac)
(Number)
Source: Eurostat online data code (pat_ep_nrg)
(% of GDP)
Source: Eurostat online data code (rd_e_gerdtot)
(EUR million)
Source: Eurostat online data code (htec_trd_group4)
(per 1 000 of population aged 20 to 29)
Source: Eurostat online data code (tps00188)
Main statistical findings
How much is the EU investing in R&D?
The headline indicator ‘gross domestic expenditure on R&D’ shows the proportion of GDP dedicated to research and development [3]. It is also referred to as ‘R&D intensity’ and reflects the extent of research and innovation undertaken in a country in terms of resources input.
Figure 1 shows a relative stagnation of gross domestic expenditure on R&D at around 1.77 % of gross domestic product (GDP) for the period 2004 to 2007. At the onset of the economic crisis, R&D intensity increased to 1.94 % in 2009 and has continued to grow marginally since 2011, reaching 2.02 % in 2013. The reasons for the increase between 2007 and 2009 include GDP falling more rapidly than overall R&D expenditure [4] and the actions taken by individual EU Member States to step up public R&D investment. In 2009, many Member States sustained nominal growth in public R&D expenditure to counter the impacts of the crisis on private investment [5].
Member States stepping up spending on R&D
Figure 3 shows a rather varied picture of EU Member States’ R&D expenditure as a percentage of GDP. In 2013, R&D expenditure ranged from 0.48 % to 3.32 % across the EU. Northern European countries such as Finland and Sweden not only share a pattern of high expenditure, they also have the most ambitious national targets. In 2013, Denmark achieved its national target of 3 % and Germany came very close to meeting its target. Countries with lower R&D expenditure levels, below 1 %, were mostly in Eastern and Southern Europe, for instance Romania, Bulgaria, Cyprus, Malta and Greece. From the above countries, Cyprus came closest to its national target.
The financial crisis and its adverse impact on GDP growth in the following years, along with an increase in nominal government spending on R&D, led to an increase in R&D intensity in most Member States (with the exception of some countries including Croatia, Luxembourg, Portugal, the United Kingdom and Sweden). Germany has experienced the fastest growth, exceeding the EU average since 2011 [6]. The analysis showed that the European Commission and individual Member States put R&D investment high on the agenda for combating the crisis.
Private R&D investment remains the largest source of expenditure
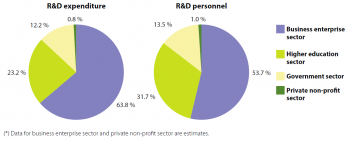
Expenditure on R&D is split into four institutional sectors: government, business enterprise, higher education and the private non-profit sector (see the section on 'Data sources and availability'). The two sectors with the highest expenditure on R&D in Europe have been the business enterprise sector, which made up 63.8 % (EUR 174.4 billion), and the higher education sector, which made up 23.62 % (EUR 63.4 billion) of total R&D expenditure in 2013. With a more modest 12.2 % (EUR 33.4 billion), the government sector plays an important role, especially in terms of the long-term stability of R&D expenditure. The importance of the private non-profit sector is negligible, spending less than 1 % of the total (EUR 2.3 billion).
Between 2002 and 2013, expenditure grew almost constantly across all sectors in absolute terms at the European level (see Figure 4 and Table 1). The higher education sector grew the fastest by 52.4 %, followed by the business and government sectors by 46.2 % and 37.2 % respectively. The private non-profit sector grew by 41.7 % over the period but experienced ups and downs along the way.
When the financial and economic crisis hit Europe in 2008, some EU Member States such as Germany, Austria and the Nordic countries boosted public R&D expenditure to stimulate economic growth and encourage private R&D investment, which remains the largest source of R&D expenditure (9). Government-sector R&D expenditure grew by about 2.7 % between 2008 and 2009 (see Figure 4 and Table 1). It continued to grow further in spite of the crisis, though at a slower pace than in most of the pre-crisis years. The same applied for higher-education expenditure, which grew by 3.1 % between 2008 and 2009 and continued to rise after the onset of crisis.
In comparison, R&D expenditure by the business sector fell by 3.4 % between 2008 and 2009. During an economic crisis businesses usually decrease their R&D expenditure (see next section). However, R&D spending actually started to rise again after 2009, with growth rates of 4.2 % and 7.4 % in 2010 and 2011, and more moderate rates of 4.3 % and 1.9 % in 2012 and 2013 respectively. These rates were still below pre-crisis levels of 7.9 % in 2006 and 6.5 % in 2007.
In some countries (Poland, Romania, Slovakia, Croatia, Lithuania, Latvia, Cyprus and Greece), R&D effort relies predominantly on the public sector (higher education and government). This indicates conditions for business R&D investment are still insufficiently attractive [7]. Private non-profit sector trends show a succession of ups and downs.
The role of anti-cyclic public R&D investment policy
In general, private investment — including R&D expenditure - typically follows cyclical patterns with regard to GDP growth. In contrast, growth in public or government-financed R&D investment usually experiences counter-cyclical trends. During the economic crisis in 2008–09, the European Commission and EU Member States took concerted action to increase public R&D investment, not just to stimulate economic growth but also to encourage private R&D investment. As a result, the disparities in R&D investment increased in the EU during the crisis.
Despite severe budgetary constraints, government R&D funding grew faster (or decreased less) than GDP during the crisis in half of the EU Member States: Malta, Luxembourg, Estonia, the Czech Republic, Denmark, Germany, Austria, Croatia, Slovenia, Poland, Cyprus, Finland, Sweden and Portugal. In some countries direct government R&D funding complemented efforts by providing indirect support through tax incentives. This was particularly the case in France, Portugal, Ireland, the Netherlands, Austria, Denmark, Italy and Slovakia. In the remaining countries (mostly with low government R&D budgets), government R&D budgets grew much more slowly than GDP. However, the situation differs widely across countries. Efforts to preserve government R&D investment have been strongest in Estonia, Slovakia, Luxembourg, Portugal and Germany since 2007 [8].
R&D intensity concentrated in regions in Germany, the United Kingdom and Nordic countries
When analysing R&D intensity by region (see Map 1), a high level of R&D spending can be seen in 32 of the NUTS 2 regions in Germany (11 regions), the UK (six), Sweden (four) and Finland (three), followed by regions in Belgium, France and Austria (two regions each), and Denmark and Slovenia (one region each). Altogether these regions were responsible for 44.1 % of the EU’s total R&D expenditure in 2011. Some research-intensive ‘clusters’ also become apparent in this group, particularly in southern Germany, the French Midi-Pyrénées region and the Cheshire and East Anglia regions in the United Kingdom. All of these clusters are far exceeding the 3 % target the EU set itself for 2020 with shares comprised between 7.7 % and 5.0 %. Though, the most remarkable share is in Belgian’s Brabant Wallon province, with 8.9 % of GDP spent on R&D. At the other end of the scale, the 44 regions with R&D intensity below 0.5 % of GDP mainly belong to southern or central European countries: Greece, Romania and Poland (seven regions each), Bulgaria (five regions), Portugal (four regions) and Spain (three regions).
The capital region recorded the highest levels of R&D intensity in 11 EU Member States. In addition, in 17 countries, the capital regions’ R&D intensity exceeded the national average but was not necessarily the highest in the country. Only the United Kingdom and Belgium clearly bucked this trend, while in Ireland and the Netherlands the capital regions and national averages were very close. Those multi-regional Member States such as Bulgaria, Ireland, Greece, Croatia, Hungary, Romania and Slovakia, with relatively low national R&D intensities also experienced a narrow range of regional R&D intensities.
Changes in R&D intensity over time are highlighted in Map 2. Of the 244 regions for which data is available, 51 experienced a decline in R&D intensity between 2007 and 2011. This decline was below one percentage point in all regions except in Essex and Lancashire in the United Kingdom. Intensity in these two regions dropped by more than two percentage points. In five regions, including Brussels, one region from Italy and the United Kingdom, and two regions from Bulgaria, the decline was marginal, at just 0.01 percentage points. Three regions remained unchanged: Dresden in Germany, Calabria in Italy and Gloucestershire in the United Kingdom. In the remaining 190 regions, R&D intensity increased by between 0.01 percentage points (Koblenz, Umbria and Wien) and 1.44 percentage points (Belgian Brabant Wallon). The increase was below one percentage point, except in four regions.
While EU funding seeks to target all regions, an innovation divide across Europe’s regions remains. There appears to be a regional innovation paradox, whereby those regions characterised by established innovative activity maintain their position as innovative leaders (such as the Nordic countries), while those that trail behind fail to catch up, despite efforts to target these regions for funding and policy prescriptions (see about EU funding in 'Data sources and availability' and Figure 20) [9].
How the EU strengthens its human capital and knowledge base
Current skill mismatches are a threat to Europe’s innovation capacity at a time of increasing technological needs (also see the articles on 'Employment' and 'Education'). Demand in Europe for highly qualified people is predicted to rise by almost 16 million in the period up to 2020 [10]. In particular the stock of human resources such as scientists, researchers and engineers, is insufficient [11], a situation which Horizon 2020 and the European Research Area (ERA) initiative attempt to improve by supporting researchers’ careers and mobility and further facilitate the entry and stay of third-country researchers [12].
Knowledge and skills are crucial for gaining new scientific and technological expertise and for building the economy’s capacity to absorb and use this knowledge (see 'Data sources and availability'). R&D expenditure covers a substantial part of expenditure on skills and education and, therefore, constitutes a vital enabling factor for human capital. In this regard, the EU will need to train and employ at least one million new researchers compared with 2008 levels if it is to reach the R&D target of 3 % [13].
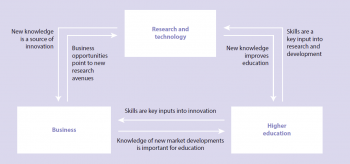
Businesses and higher education institutions can work together to share knowledge. In particular, close and effective links between education, research and innovation will stimulate the development of entrepreneurial, creative and innovative skills in all disciplines. It will also promote innovation in higher education through more interactive learning environments and increased knowledge exchange, and contribute ultimately to growth and job creation [14].
The number of science graduates in the EU is increasing...
In line with Europe’s declared intention to become the world’s most competitive science-based economy, a well-functioning research and innovation system is expected to promote excellence in education and skills development and ensure a sufficient supply of (post)graduates in science, technology, engineering and mathematics.
In spite of some weaknesses with science teaching in some Member States, and namely still too limited number of girls taking science to an advanced level, Europe has a good basic education system [15]. As a result, an ever-increasing number of the EU population are graduating from tertiary education in science and technology. Figure 5 shows how this trend has developed over the past decade. Between 2008 and 2012, the number of tertiary graduates in science and technology grew by 17.9 %, from 14.5 graduates per 1 000 inhabitants in 2008 to 17.1 graduates per 1 000 inhabitants in 2012.
This trend varies considerably across EU Member States (see Figure 5). In 2012, the number of science and technology graduates ranged from about 23 per 1 000 inhabitants in Lithuania to 9 per 1 000 inhabitants in Cyprus (Luxembourg being an exception with only 2.8 per 1 000 inhabitants) [16]. This gap has serious implications for labour mobility and the notion of an open EU labour market (see 'Data sources and availability'). All countries except Finland have increased their graduation from tertiary education rates since 2008. Between 2008 and 2012, Cyprus more than doubled its tertiary graduate rate, while the rate grew by more than 50 % in Hungary, Croatia, Slove-nia and Malta.
...but gender differences remain
Empowering women in tertiary education and enhancing their employment opportunities in the R&D sector is also an important issue for the EU. However, gender equality relies heavily on many factors such as R&D innovation systems, the importance of science to the national economy, the features of the labour market and equality policies. Starting from a modest level of 9.6 graduates per 1 000 inhabitants in 2008, the share of female tertiary graduates grew faster than the growth of males in science and technology graduates until 2012. This trend could in future help address the current underrepresentation of women in science and research careers and PhD positions. It could also mean the trend of men outnumbering women in employment of researchers might be reversed. Currently, men account for 67 % [17] of research positions, 51 % of PhD students and 54 % of graduates. However, women are much less likely to reach a top-level [18] position in research than men and progress has been slow [19]. For example, in 2010 only 20 % of women held a top-level position.
How is the EU performing with regard to employment in knowledge-intensive activities?
As outlined earlier, Europe has been improving its academic tertiary education output. In addition, many countries have put in place national measures intended to attract a highly qualified workforce and human resources to science and research, including women [20]. In the EU, the number of people employed in knowledge-intensive activities as a share of total employment increased slightly from 34.0 % in 2008 to 35.6 % in 2012. However, the picture across Members States is rather mixed, as shown in Figure 6. While in 2012 Romania (20 %), Bulgaria (26.9 %) and Poland (28.9 %) showed the lowest percentages, Luxembourg (56.6 %), Sweden (43.3 %) and Ireland (43.2 %) had the highest.
As a general trend, between 2008 and 2012, employment in knowledge-intensive activities increased in almost all EU Member States, demonstrating that the EU is moving towards a more knowledge-based economy. Countries making substantial progress were Ireland (5.7 percentage points), followed by Estonia, Latvia, Spain, Slovenia, Greece, Malta, Croatia, Denmark and Portugal. All of these have been experiencing a period of continuous expansion of employment in knowledge-intensive activities of 3.0 to 4.2 percentage points. However, there were falls in the Netherlands (– 0.9 percentage points) and Italy (– 0.4 percentage points).
In 2012, the share of women employed in knowledge-intensive activities exceeded that of men in all countries, making up 43.6 % of total EU employment in that sector. However, only 13.1 % of women were employed in EU knowledge-intensive business enterprises, highlighting the need for more efforts towards gender mainstreaming. At the EU level, the stock of R&D personnel - including researchers and other staff employed directly in R&D - constituted 1.22 % of total employment in 2012, translating into more than 2.6 million full-time equivalent positions. More than a half of the R&D personnel (53.0 %) were employed in the business enterprise sector (see also Figure 19).
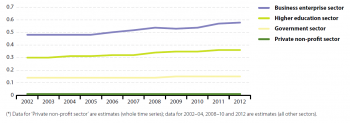
Between 2002 and 2012 the share of R&D personnel in the labour force increased by 0.18 percentage points, from 0.92 % to 1.10 %. As shown in Figure 7, this trend was supported by growth in three of the four institutional sectors. However, the rate of growth was quite different between the sectors. The business enterprise sector grew by 0.1 percentage points between 2002 and 2012, followed by the higher education sector which grew by 0.06 percentage points over the same period. The government sector increased by only 0.01 percentage points; the private non-profit sector remained stable at 0.01 %.
Around one-third of EU researchers have been mobile
The ERA is defined as a unified research area open to the world based on the Internal Market, in which the removal of barriers to researcher mobility, training and attractive careers will be ensured [21].
In recent years, significant progress has been made and the EU has increased its stock of researchers. However, as already stated, it was estimated that in 2010 one million more researchers — a more than 60 % increase — were still needed to meet the objective of 3 % R&D intensity by 2020 [22]. This figure takes into consideration the number of researchers who will retire and the existence of a persistent ‘brain drain’ from the EU to the United States [23].
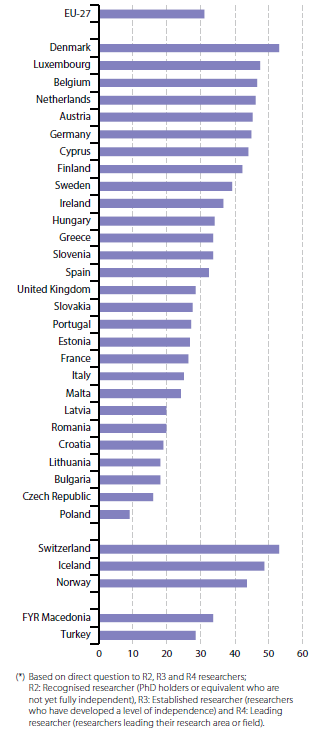
The mobility of EU researchers is high. Around 31 % of EU post-PhD researchers have worked abroad, whether in the EU or worldwide, as researchers for more than three months at least once during the past 10 years [24]. In half of the Member States, the proportion is above the EU average, ranging from 32.3 % in Spain to 53 % in Denmark (see Figure 8). In the other half, shares vary from 9.1 % in Poland to 28.5 % in the United Kingdom.
The gender gap in mobility is still highly visible: only 25 % of female researchers experienced a post-PhD mobility of more than three months in another country in the past 10 years, compared with 34 % for men [25]. Their share exceeds that of men only in Ireland (52 %). The gap varies widely in the remaining countries, from seven percentage points in Finland to 100 percentage points in Latvia where mobility of the female research population has been zero over recent years [26].
On the whole, the mobility experience is largely positive: at EU level, 80 % of internationally mobile researchers believe mobility has strongly increased the advancement of their research skills and 62 % felt it had improved the quality of their research publications [27].
ICT connectivity and digital skills are central to a knowledge-based economy
Information and communications technology (ICT) skills and knowledge are essential for developing an effective research and innovation system. In that sense, they are an important part of the skills base needed in today’s interactive and connected world.
Furthermore, ICT development and usage skills are a new driver for employment and R&D in Europe. The value added of the ICT sector, including information industries, accounted for 4 % of GDP in 2010. In addition, the sector represented 2.5 % of EU total employment while R&D personnel in ICT made up 20 % of total R&D personnel. In the same year, R&D intensity in the ICT sector amounted to 5.2 % [28]. A number of EU policy strategies under the Europe 2020 strategy umbrella tackle the issue of ICT connectivity and skills at the business and citizen levels and address knowledge circulation among the research community (see 'Data sources and availability').
A large part of the EU population is, however, still affected by a digital literacy deficit. The exclusion of many people from the digital knowledge-based society and economy is holding back the large multiplier effect that ICT take-up has on innovations and productivity growth. These skills do not only improve employability, they also enhance societal learning, creativity, emancipation and empowerment.
Broadband internet connections in businesses and households increased substantially
Infrastructure availability is vital to the process of diffusing the digital and knowledge-based economy into the very corners of society. Increased Broadband internet access opportunities for private and business usage are an important enabling factor for this process. The share of European households and business with broadband internet access rose considerably between 2007 and 2013, in line with advances in the global internet, wider network coverage and increased affordability. Enterprises’ usage of broadband internet connections increased by 13 percentage points over the same period, from 77 % to 90 %. At the same time, the share of households enjoying broadband access increased by 34 percentage points, from 42 % to 76 % (see Figure 9).
Growth in access to ICT infrastructure is also reflected at Member State level. Between 2007 and 2013 the share of both households and enterprises with broadband internet access increased in all countries. The only exception is enterprise access in Croatia, which fell by 3.8 %. In 2013, the share of household connectivity exceeded the EU average in 11 Member States, with rates ranging from 78 % in France to 88 % in Finland. The other 17 countries had lower access rates, from 54 % in Bulgaria to 74 % in Slovenia. In general, the highest growth rates over the period 2007 to 2013 were mainly in Eastern and Southern European countries. Some of these, such as Romania and Greece, had access rates in 2013 that were about seven times higher than in 2007. Compared with household connectivity, differences in enterprises’ broadband internet access in 2013 were less pronounced, with nine Member States below the EU average. In 2013 enterprises’ access varied from 99 % in Finland to 61 % in Romania.
Rise in the EU population’s digital skills
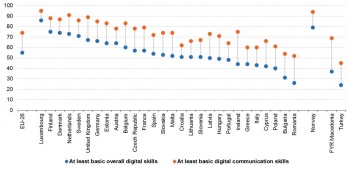
Between 2007 and 2012 the share of individuals with at least a medium level of basic computer skills [29] in the EU grew slightly from 47 % [30] to 50 % (see Figure 10). At the Member State level, the share ranged from 74 % to 21 % in 2012. The highest shares, close to or exceeding 70 %, could be found in Luxembourg, Denmark and Finland.
As for computer skills, internet skills are equally important for a society’s digital knowledge base. Figure 10 (right-hand graph) shows that between 2007 [31] and 2013 the share of individuals with at least a medium level of internet skills [32] increased substantially at the EU level from 30 % to 47 %. This favourable trend is mirrored at the Member State level, where all countries improved their populations’ internet skills between 2007 and 2013. Increases in internet skills across the EU in general reflect improvements in connectivity (see Figure 9). Thus it is not surprising several Member States, such as Belgium, Ireland, Greece, Cyprus, Romania, Slovakia, Sweden and the United Kingdom, increased the share of people with advanced internet skills by close to or more than two times.
How are businesses achieving technology-based innovation and bringing good ideas to the market?
A dynamic business environment is essential for the promotion and diffusion of innovations. The challenge is to make use of R&D through entrepreneurship and creativity to trigger innovation and economic competitiveness. Therefore, measures targeting knowledge diffusion and absorption, for example, through the creation of technology markets and licensing schemes, are just as important as investment in knowledge generation (see 'Data sources and availability'). The higher the uptake and use of ideas from R&D, the more likely those innovative players are to invest in future knowledge generation through increased private R&D expenditure. Furthermore, innovators also help to create a more dynamic system. In many cases they contribute to the structural and technological changes needed to adapt to new circumstances and challenges. An example of this is the depletion of fossil fuels and the resulting transition towards more renewable energy sources. Significant progress in achieving knowledge diffusion and absorption is measured through growth in innovative firms, the number of patent applications, the export of high-tech products and the number of patents related to societal challenges such as climate change.
The EU’s innovation performance has improved
The EU has become more innovative in recent years, rising from an innovation performance index of 0.493 in 2006 to 0.554 in 2013 (see Figure 11). As a result the EU has decreased its innovation gap with the United States and Japan [33], although it still lags behind these countries and South Korea.
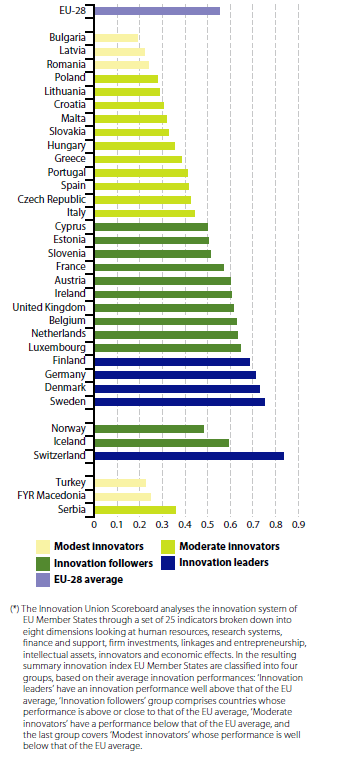
While all Member States have become more innovative, differences in innovation performances are still high and are diminishing only slowly. This is particularly visible in business innovation co-operation, and knowledge excellence and internationalisation [34]. The overall ranking within the EU remains relatively stable. Four ‘innovation leaders’ include Sweden at the top, followed by Denmark, Germany and Finland. At the other end of the scale, ‘modest innovators’ are made up of three Eastern Member States. In between, two large groups of 11 ‘moderate innovators’ and 10 ‘innovation followers’ can be observed (see Figure 11).
Portugal, Estonia and Latvia have shown the most improvement over the past few years. In these countries the index increased by more than 25 % between 2006 and 2013. The least progress was made by the innovation leader Sweden and the innovation follower UK. In these two countries the index has increased by a mere 0.02 points. Most progress achieved by countries lies in the openness and attractiveness of the EU research system as well as business innovation collaboration and the commercialisation of knowledge as measured by licence and patent revenues from abroad. However, the growth of public R&D expenditure over the past few years has been offset by a continuous decline in venture capital investments and non-R&D innovation investments by companies [35] (see also indicators on R&D expenditure and patent applications).
An analysis of the regional situation indicates that over the seven-year period from 2004 to 2010, innovation performance has improved for 155 out of 190 EU regions. In the remaining 35 regions, scattered across 15 Member States, innovation performance has worsened [36]. In the same way as for Member States, the 190 regions have also been grouped into ‘regional innovation leaders’ (34 regions), ‘regional innovation followers’ (57 regions), ‘regional moderate innovators’ (68 regions) and ‘regional modest innovators’ (31 regions). The most innovative regions also appear to be located in the most innovative countries, revealing a concentration of innovation excellence in relatively few areas in Europe. All regional innovation lead-ers are located in only eight Member States, of which the four national innovation leaders and four innovation followers (see Figure 11) consist of Denmark, Germany, Finland, France, Ireland, the Netherlands, Sweden and the United Kingdom.
More than half of EU enterprises contribute to innovation activity
An analysis of business innovativeness reveals that more than half of the EU’s enterprises are innovative and reported innovation activity in 2010 (see Figure 12). Member States considered as innovation leaders have a share of innovative enterprises substantially above the EU average of 53 %. This is namely the case for Germany (79 %) and Luxembourg (68 %). Innovative companies can be distinguished by the type of innovation they pursue. Figure 12 shows how different business strategies lead to different innovation types such as product and/or process as well as organisational and/or marketing innovation.
Northern European countries are leaders in eco-innovation
Eco-innovation, like all innovations, is bringing a new product (good or service) to the market or implementing a new solution in the production or organisational processes of a compa-ny [37]. Eco-innovation reduces the use of natural resources and decreases the release of harmful substances across the whole lifecycle, bringing economic, social and environmental benefits. Environmental benefits include improved resource productivity, in particular better material and energy efficiency, lower GHG emissions and reduced waste generation, which is both beneficial for companies and end users. Measuring eco-innovation performance helps with assessing whether the EU and its Member States are moving towards smart and sustainable growth in Europe, as requested by the Europe 2020 strategy.
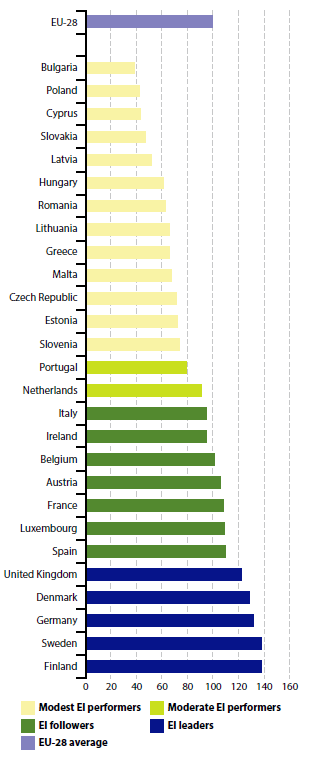
In 2013, the overall eco-innovation performance of EU countries ranged from around 40 in Bulgaria, Poland and Cyprus to almost 130 or more in Denmark, Germany, Finland and Sweden. The latter four countries are also the innovation leaders in the Union innovation scoreboard (see Figure 11). The majority of EU-15 countries can be found at the top, particularly Scandinavian countries, but also Germany, the United Kingdom, Spain, Luxembourg, Austria and Belgium. These all persistently show an index value above the EU average over the four years analysed by the index (2010 to 2013). The less well performing countries are in Eastern and Southern Europe. Another set of four countries made up of France, Italy, Ireland and the Netherlands, has values rather close to or exceeding the EU average in 2013 and in the preceding years.
The ranking of a few Member States has improved considerably since 2010: this is namely the case of Lithuania, which gained eight places, and Estonia and Luxembourg, gaining six places each. However, the ranking was less favourable in some other countries: Cyprus and Bulgaria both lost seven places and the Netherlands six places [38].
How are EU sectors performing with regard to new patent applications?
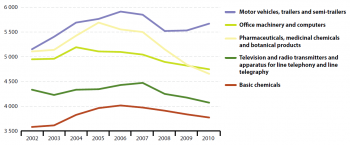
The more cutting-edge knowledge is produced, the more likely it is such knowledge will spill over into new products and private R&D activities. In this regard, patents provide a valuable measure of the exploitation of research results and of inventiveness of countries, regions and firms (see 'Data sources and availability'). Over the period 2002 to 2007, patent applications in the EU manufacturing sector increased almost continuously until the global economic and financial crisis began to be felt in 2008. After peaking in 2006, EU patent applications fell by 7.2 % between 2007 and 2010. This was more than for total EU patent applications, which declined by 4.5 % over the same period.
Taking a more detailed view of the manufacturing sector, the trend at EU level is to a large extent mirrored in the individual sectors as outlined in Figure 2.16 [39]. Of the five largest EU manufacturing subsectors, the pharmaceuticals sector has been hit the hardest, with patent applications dropping by more than 15.4 % between 2007 and 2010. This was followed by the television and radio transmitters sector (– 9.0 %). All of the remaining sectors — basic chemicals; office machinery and computers; and motor vehicles, trailers and semi-trailers — have been hit to a lesser degree (varying between – 3.0 % and – 5.9 %). During that period, industrial patents as a share of total patent applications also declined gradually, from 47.7 % in 2007 to 46.3 % in 2010.
Technological solutions addressing climate change
The EU focuses its investment strategies towards innovation-oriented sectors that help address some of society’s most pressing challenges. Combining research and innovation with market development measures can help provide the necessary structural and technological solutions to societal challenges, such as climate change adaptation, healthy ageing or security of material supply. Accordingly, targeted sectors also represent future areas of potential economic growth and jobs. In this regard the European Commission initiated a series of ‘innovation partnerships’ under the flagship initiative ‘Innovation Union’. These aim to foster the development and deployment of technologies needed to meet the challenges identified.
Climate change patents have been equally hit by the crisis
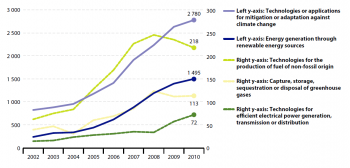
During the past decade Europe’s progress in addressing societal challenges through patenting has been focused on climate change mitigation and adaptation [40]. Figure 2.17 shows EU patent applications in relation to climate change mitigation and adaptation. Like conventional manufacturing patent applications, the market for patent applications targeting climate change adaptation and mitigation did not escape the turmoil created by the financial and economic crisis. Europe’s patent market for climate change mitigation and adaptation experienced an almost increas-ingly strong growth rate between 2002 and 2008, peaking at 34.9 % between 2007 and 2008. In the next three years, patent applications continued to rise but at a much slower pace, easing to a particularly low growth rate in 2010 (5.4 %). This slowdown might be due to organisations postponing some applications because of cost or risk reasons during the crisis.
The newer ‘capture, storage, sequestration or disposal of greenhouse gases’ sector, which only accounts for about 4 %, was most affected by the crisis. Patent applications in this sector dropped by nearly 10 % in 2009 before rising slightly again in 2010. Other sectors affected include the ‘electrical power generation, transmission or distribution’ sector which dropped by 3.5 % in 2008 before rising sharply in 2009 and 2010, and the production of fuel of non-fossil origin sector which has been declining since 2009 (– 10.9 %). During the crisis the most important driver for a technological push towards more efficient, secure and clean energy generation was the geopolitical situation in many oil-exporting countries worldwide and the oil crisis during 2003 and 2008. This push was mirrored by the expansion of patent applications.
Is the EU a competitive global player in R&D?
Investment in R&D remains crucial for maintaining a competitive advantage over other world leaders with regard to high-quality science and innovative products. The EU is currently lagging behind other global players such as the United States, Japan and South Korea in terms of business R&D expenditure, patent applications and tertiary education [41].
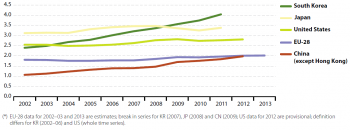
Between 2002 and 2013, EU R&D intensity remained relatively stable, increasing slightly from 1.81 % of GDP in 2002 to 2.02 % in 2013. Other world competitors experienced different patterns of growth in R&D intensity (see Figure 16). South Korea and China showed the highest growth rates. South Korea grew by 1.34 percentage points between 2002 and 2010, while China grew by 0.77 percentage points between 2002 and 2011. The United States and Japan showed more moderate growth. The United States showed a 0.22 percentage point increase between 2002 and 2011 and Japan grew by 0.13 percentage points between 2002 and 2010. The United States, Japan and South Korea are not only outperforming the EU in overall R&D intensity, but also in terms of business enterprise R&D intensity. While only 62.0 % of EU R&D intensity originated from the business enterprise sector in 2010, the United States, China, South Korea and Japan registered between 68.5 % and 76.6 % of R&D intensity from this sector.
High-tech exports have recovered on the international market
Beyond turning research results into tangible applications, innovative businesses compete globally to sell their high-tech products on the world market. By bringing good ideas to the market, businesses contribute to innovation-related trade, for example, in manufactured goods, for the benefit of an economy’s balance of trade. Even though only 13 % of the EU’s small and medium enterprises (SMEs) are active in markets outside the EU, evidence suggests that these exporters show greater employment growth than non-exporters [42].
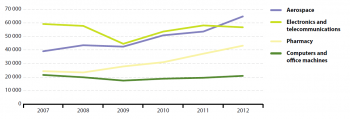
Total EU high-tech exports to outside the EU fell during 2008 and 2009. However, after the sharp drop in 2009 high-tech exports quickly recovered and had increased continuously by more than 40 % by 2012. Similar development trends can be observed at the individual sector level. Since the recovery from the economic crisis, the aerospace and pharmacy sectors have been the main drivers behind high-tech exports by the EU, growing by more than 50 % between 2009 and 2012 (Figure 17).
The EU’s international performance with regard to human capital
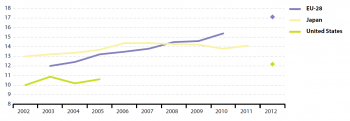
Since 2003, Europe’s international position in terms of tertiary education has improved continuously compared with the United States and Japan (see Figure 18). Increasing the number of tertiary graduates is fundamental. First, the EU target of raising R&D intensity to 3 % will require substantial investment in future human capital to absorb the extra investment. Second, it is needed to address the looming demographic challenge of an increasing number of elderly and a decreasing number of young people. Since 2008 the EU has outperformed Japan with regard to tertiary graduates. In 2010, the EU produced 1.6 more graduates per 1 000 inhabitants than Japan. In 2012, it also produced 4.9 more graduates per 1 000 inhabitants than the United States.
Conclusions and outlook towards 2020
The EU is facing increasing competition but remains a main knowledge production centre of the world, accounting for almost a third of the world’s science and technology production [43]. Over the past 30 years, Europe has supported wide-ranging research projects developed by Member States, spending almost EUR 120 000 million by 2013. It will have another EUR 78.6 billion at its disposal for the period from 2014 to 2020.
Between 2002 and 2007, the EU followed a relatively stable trend of 1.8 % in gross domestic expenditure on R&D as a percentage of GDP. Since then, it has grown marginally. This was due to the combined effects of the crisis on GDP growth and an increase in nominal government R&D spending to combat the long-term impacts of the crisis, especially during the first period of the crisis (from 2008 to 2010) [44].
The EU’s investment in R&D and innovation is increasingly targeted at supporting growth-enhancing policies to strengthen its human capital and knowledge base. The EU increased its output of tertiary graduates in science and technology by 17.9 % between 2008 and 2012. Particularly, the share of female graduates grew faster than the overall growth in science and technology graduates, potentially impacting on future employment gender equality. Moreover, between 2008 and 2012, employment in knowledge-intensive activities increased in almost all EU Member States, demonstrating that the EU is moving towards a more knowledge-based economy. In recent years, the EU also increased its stock of researchers and encouraged their mobility. One-third of researchers have worked abroad in the past 10 years, but mobile male researchers still outnumber female researchers in almost all countries.
The EU also invested in developing its population’s digital literacy and improving the ICT connectivity of both businesses and households. Between 2007 and 2012, the share of individuals having at least a medium level of computer skills increased from 47 % to 50 %; between 2007 and 2013, individuals’ internet skills grew substantially from 30 % to 47 %. Overall these trends have been partly facilitated by some far-reaching developments in terms of connectivity of both households and businesses.
The EU has become more innovative, with Sweden, Denmark, Germany and Finland acting as ‘innovation leaders’ at both national and regional levels. A majority of European firms also reported innovation activity in 2010. Eco-innovation, a more recent innovation type, is helping Europe transition to a more resource-efficient region. The number of patents in the EU manufacturing sector experienced an almost continuous increase until the impact of the crisis began to be felt. EU patent applications, having peaked in 2006, decreased by more than 4 % between 2007 and 2009. Moreover, the market addressing technological solutions for climate change has been equally hit by the crisis, causing a slowdown in the number of patent applications in that sector after 2008.
At the global level, even though the EU is an attractive location for R&D investment, it is still lagging behind its Asian and American competitors in terms of R&D expenditure, in particular by business enterprise. Nonetheless, although Europe is still more focused on traditional industries than its international competitors and needs more strategic high-tech investment [45], it’s high-tech exports to outside the EU have recovered since the crisis and have increased by more than 40 % between 2010 and 2012. Strong growth in the aerospace and pharmacy sectors has been a major driver of this. In addition, Europe’s position in terms of tertiary education graduates has improved constantly since 2003 and it is now outperforming Japan.
Efforts needed to meet the Europe 2020 target on R&D
The Europe 2020 strategy tries to overcome the economic crisis and its impacts by addressing the shortcomings of the European growth model. It also attempts to create the conditions for a different type of growth through more effective investments in education, research and innovation. However, with a current level of 2.02 % in 2013 and limited progress over time, the R&D intensity is expected to remain below the 3 % objective that the EU has set itself for 2020. According to latest projections [46], and if current reforms and financial efforts continue, investment in R&D is forecast to rise to 2.2 % by 2020. Progressing more rapidly towards the 3 % target would need faster structural shift to more knowledge-based economic activities. If Member States meet their national targets, this share could amount to 2.6 %. However, progress towards the national targets is very uneven, with targets ranging from 0.5 % to 4.0 % of GDP. In 2013, Denmark already met its national target, while Germany came very close, with a gap of 0.06 percentage points to be closed by 2020.
Besides context-specific factors that influence R&D investment, the distance to the EU target can be ascribed to various challenges that have not been fully overcome by the actions and instruments put in place by the EU. These instruments aim to foster private investment in R&D and to maintain and promote public funding of R&D despite the crisis.
Among the EU policy instruments, the flagship initiative ‘Innovation Union’ is one of the most prominent. It places renewed emphasis on using public sector intervention to stimulate the private sector and to remove bottlenecks to enable the conversion of Europe’s scientific expertise into marketable goods and services. More specifically the flagship initiative is putting emphasis on the challenges facing our society, such as climate change.
Delivery of the actions set out in the ‘Innovation Union’ flagship initiative is on course, but with various levels of implementation. In particular, the initiative has not prevented the growing persistence of innovation performance gaps among EU countries, although it has reduced the gap between the EU and its main competitors [47].
For the period from 2014 to 2020, the ‘Innovation Union’ will be implemented through financial support provided by Horizon 2020 (see Data sources and availability), Europe’s current framework programme for research and innovation. With EUR 78.6 billion of funding available for the next seven years, Horizon 2020 will namely finance the further development of ERA which is at the heart of Europe 2020 and ‘Innovation Union’ (see Data sources and availability). The ERA has been designed to create attractive conditions for carrying out research and investing in R&D intensive sectors. Another policy instrument is the ‘Digital agenda for Europe’ flagship initiative which aims to unleash the digital potential and diffuse the digital culture widely across the EU through a set of more than 100 actions. Ninety per cent of these had been completed or were on track in January 2014. The flagship initiative has increased political focus on the digital economy while also strengthening the use of the internet, development of e-commerce, availability of e-government services and accessibility of basic broadband internet connections in most of Europe [48].
Data sources and availability
(%)
Source: Eurostat online codes (rd_e_gerdtot) and (rd_p_persocc)
(EUR billion)
Source: European Commission, DG RTD, Factsheet: Horizon 2020 budget
The EU R&D sector in a snapshot
In the EU, R&D activities are carried out by four main institutional sectors:
Business enterprise sector: all firms, organisations and institutions whose primary activity is the market production of goods or services (other than higher education) for sale to the general public at an economically significant price. It also includes the private non-profit institutes that mainly serve them.
Government sector: all departments, offices and other bodies that furnish but normally do not sell to the community those common services, other than higher education, that cannot otherwise be conveniently and economically provided, and which administer the state and the economic and social policy of the community. It also includes non-profit institutes controlled and mainly financed by government. Public enterprises are included in the business enterprise sector.
Higher education sector: all universities, colleges of technology and other institutes of post--secondary education, whatever their source of finance or legal status. It also includes all research institutes, experimental stations and clinics operating under the direct control of or administered by or associated with higher education establishments.
Private non-profit sector: non-market, private non-profit institutions serving households (the general public); private individuals or households [49]. Figure 19 shows the distribution of R&D expenditure and employment between these four sectors in the EU in 2013.
Horizon 2020 — the biggest EU research and innovation programme ever
Horizon 2020 is the current EU research and innovation programme. It follows up on the previous EU research framework programmes, which were implemented in 1984 and provided funding for a total of almost EUR 120 000 million of wide-ranging research projects up to 2013 (13).
With EUR 78.6 billion [50] of funding available for the seven-year period from 2014 to 2020, Horizon 2020 is the financial instrument implementing the ‘Innovation Union’ in the EU. It focuses on three priorities [51]:
- Generating excellent science to strengthen the Union’s world-class excellence in science.
- Fostering industrial leadership to support business, including micro, small and medium-sized enterprises (SMEs) and innovation.
- Tackling societal challenges, to respond directly to the challenges identified in the Europe 2020 strategy by supporting activities covering the entire spectrum from research to market.
Horizon 2020 aims to achieve the Europe 2020 ambitions for smart, sustainable and inclusive growth and jobs. The goal is to ensure that Europe produces world-class science, removes barriers to innovation and makes it easier for the public and private sectors to work together to deliver innovation.
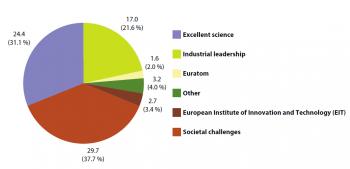
The biggest part of the Horizon 2020 budget, 37.7 %, representing EUR 29.7 billion, is devoted to tackling societal challenges in the field of environment (including climate change), energy, transport, health and demographic changes, and security. Almost one-third (31.1 %) of the budget is allocated to bringing about excellence in science, namely through the European Research Council. Another 21.6 % are devoted to increasing industrial leadership, in particular in enabling and industrial technologies such as information and communication technology (ICT), nanotechnologies and space. The European Institute of Innovation and Technology (EIT) and Euratom — the research funding programme for the peaceful use of nuclear energy in the EU — receive 3.4 % and 2.0 % of the funding respectively.
The knowledge triangle: education facilitates research and innovation
Education is the ultimate means of building up human capital and is strongly linked to the concepts of research and innovation. These three concepts, which are central drivers of a knowledge-based society, form the so-called knowledge triangle [52]. This concept couples education, academic research and knowledge production, and innovation, and highlights the mutual benefits from strong interlinkages among the three. To realise a cohesive European Research Area (ERA, see below), education, research and innovation need to develop strong links with each other.
An open labour market for researchers is an essential factor for the completion of a European Research Area [53]
The constrained mobility of European researchers within EU borders and Europe’s relative attrac-tiveness to researchers from other parts of the world are breaks to the so-called ‘Fifth Freedom’ [54], that is the free movement of knowledge. Promoting mobility across institutions, disciplines, countries and sectors for opening up and connecting EU research systems, is the objective of the ERA [55] reform agenda which focuses on five key priorities:
- More effective national research systems.
- Optimal transnational co-operation and competition.
- An open labour market for researchers.
- Gender equality and gender mainstreaming in research.
- Optimal circulation and transfer of scientific knowledge, including via digital means.
Together, the EU Member States, the European Commission and Research Organisations should ensure the completion of the ERA by 2014.
Policies contributing to the development of a digital economy and society
A series of high-level Europe 2020 initiatives address the issue of investment in digital technologies, in particular to increase connectivity and ICT skills of businesses and citizens, and the free movement of knowledge between science and business.
Connectivity, is addressed by the flagship initiative ‘Digital Agenda for Europe’ [56] that contributes to the smart growth priority to boost citizens and businesses’ access to broadband. ICT skills, are targeted by another flagship initiative, the ‘Agenda for new skills and jobs’ [57]. It facilitates the inclusive growth priority, supporting the improvement of e-skill levels in the labour force and the creation of jobs through an enhanced set of skills and in the ICT sector overall. The flagship initiative ‘Innovation Union’ [58] called for the completion of ERA (see below) by 2014, which should optimise the circulation, access to and transfer of scientific knowledge including via digital ERA [59].
Relationships between R&D, innovation and patents
Patents are legal instruments that encourage companies to innovate by conferring some exclusive rights to inventors or assignees in return for the disclosure of an invention. According to literature [60], a company’s propensity to file patents is influ-enced by three factors: R&D efforts, strategic considerations and the competitive environment. One of the trade-offs for filing patent applications is that it excludes other parties from using the invention, unless permitted by the patent holder, and therefore limits its diffusion into socie-ty [61].
Since the 1990s, a trend of increased propensity to patent without a corresponding growth in R&D expenditure has been experienced in the United States and EU Member States. This trend reflects an increase in R&D productivity.
Next to patent development, the extent to which patents — reservoirs of potential innovations — are actually used for economic and societal purposes remains of major importance. Licensing has largely been used to alleviate the risk that innovations are patented for reasons other than increasing productivity and further innovation (for example, guaranteeing protection from rivals) and are not used [62].
The relevance of research and innovation for societal progress
Research enlarges the scientific and technological knowledge needed to tackle societal problems or simply to satisfy intellectual curiosity. Innovation creates value by introducing new or improved products (goods or services), processes and logistics or distribution methods. The two concepts are intertwined, with scientific and technological research providing knowledge inputs for innovation.
Innovation is a broad concept that encompasses the capacity of a company, economy or society to adapt to changing environments and circumstances in different ways. It comprises a variety of aspects [63]:
- Product and process innovation: the introduction of new or significantly improved goods, services or processes.
- Organisational innovation: changes in the way business or manufacturing practices are organised.
- Marketing innovation: the introduction of new marketing methods (concept or strategy).
Other innovation types may encompass [64]:
- User-driven innovation: innovation that draws heavily on knowledge inputs from customers and markets.
- Open innovation: changes in the way companies and other organisations access and exploit knowledge to innovate.
- Social innovation: innovations in the way society organises itself, especially the different ways that the public sector serves the needs of society.
All of these innovation types have socioeconomic impacts, for example, research and innovation have a strong relationship with technical change, knowledge capabilities and the productivity of companies. More specifically, a positive relationship exists between innovation and socioeconomic performance. For example, regions with high levels of innovation are more likely to have higher levels of development (in GDP terms), labour productivity and employment rates and, to a lesser extent, lower energy usage [65].
The addition of the third concept of education forms the notion of the knowledge triangle: education, research and innovation. These three concepts benefit from their strong interlinkages.
Eco-Innovation Scoreboard
The Eco-Innovation Scoreboard (Eco-IS) [66] assesses and illustrates eco-innovation performance across the 28 EU Member States. The Eco-IS shows how well individual Member States perform in different dimensions of eco-innovation compared with the EU average. It is based on 16 indicators grouped in to five thematic areas: eco-innovation inputs, eco-innovation activities, eco-innovation outputs, resource efficiency and socio-economic outcomes. In the index, EU Member States are ranked in relation to the EU average of 100 (see Figure 13)
Context
Research and development - why do they matter?
Research and development (R&D) and innovation are key policy components of the Europe 2020 strategy. Investment in R&D and innovation, by fostering an increase or substantial improvements in the quality of innovative products and services, contributes to the strategy’s smart growth objective, creating jobs and addressing societal challenges. By paving the way towards increased industrial competitiveness, labour productivity and the efficient use of resources, they are also at the heart of sustainable growth. In particular the ‘Innovation Union’ flagship initiative aims to create innovation-friendly environment for EU researchers and entrepreneurs that makes it easier for great ideas to be turned into products and services.
R&D and innovation contribute to a well-functioning, knowledge-based economy. The well-being of the EU population also depends on scientific and technical solutions being found to global societal challenges such as climate change and clean energy, security, and active and healthy ageing.
The analysis in this article benchmarks the EU average against the performance of individual Member States and — whenever data are available — against countries of the European Free Trade Association (EFTA) and EU candidate countries. It is based on the headline indicator ‘Gross domestic expenditure on R&D’, which monitors the strategy’s research and development target. The headline indicator is complemented with other contextual indicators. These present a broader picture, looking into potential drivers behind the changes in the headline indicator and the impacts of the EU’s expenditure on its R&D and innovation performance.
The analysis first sheds light on fundamental enabling factors that drive innovation. These are the first link in the innovation chain and include R&D investment by EU Member States and the way it is financed by the various public and private societal actors. The role of education, in particular higher education, in providing the necessary science and technology skills and workforce is also highlighted.
This is followed by a look at the EU’s performance concerning business frontrunners, their innovative capacity, including in ‘green’ domains, and the technological output at the end of the innovation chain in terms of commercialisation and the relevance for societal challenges. The analysis closes by comparing the EU’s position with that of global competitors such as the United States, Japan, South Korea and China.
R&D and innovation are major drivers of economic growth, competitiveness and employment in a knowledge-based economy. Public investment generates the knowledge base and talent that innovative companies need. It also leverages investment in research and innovation. These are all crucial to fulfilling the ambitions of the Europe 2020 strategy [67].
The EU’s R&D target has a mutually beneficial relationship with the strategy’s tertiary educational attainment and employment targets (see articles on 'Employment' and 'Education'). On the one hand, the attainment of new skills feeds the development of academic know¬ledge and innovative products. On the other, greater investment in R&D provides new jobs in business and academia, increasing demand for scientists and researchers in the labour market. Moreover, increased investment in education and skills development, as well as a rise in the output of tertiary education graduates, improves the skills base of the EU labour force and, therefore, its employability.
A competitive and innovative knowledge-based economy relies strongly on its human capital. R&D investment and the Europe 2020’s tertiary education target are closely interlinked. Mutual benefits also exist between the strategy’s targets on R&D and on climate change and energy when taking into account the future potential of innovative new products and processes to tackle these societal challenges (see the article on 'Climate change and energy').
See also
Further Eurostat information
Publications
Main tables
Dedicated section
Methodology / Metadata
- Towards robust quality management for European Statistics - Communication from the Commission COM(2011) 211 final
Other information
- Regulation 223/2009 of 11 March 2009 on European statistics
External links
Notes
- European Council conclusions 17 June 2010, EUCO 13/10, Brussels, 2010. ↑
- European Commission, Taking stock of the Europe 2020 strategy for smart, sustainable and inclusive growth, COM(2014) 130 final, Brussels, 2014 (p. 12). ↑
- ‘Research and experimental development (R&D) comprises creative work undertaken on a systematic basis in order to increase the stock of knowledge, including knowledge of man, culture and society and the use of this stock of knowledge to devise new applications’; (Frascati Manual, 2002 edition, § 63). ↑
- European Commission, Innovation Union Competitiveness Report 2011, Brussels, 2011 (p. 64). ↑
- European Commission, Innovation Union Competitiveness Report 2013, Brussels 2013 (p. 38). ↑
- European Commission, Taking stock of the Europe 2020 strategy for smart, sustainable and inclusive growth, COM(2014) 130 final, Brussels (p. 12). ↑
- European Commission, Innovation Union Competitiveness Report 2013, Brussels 2013 (p.38). ↑
- European Commission, Innovation Union Competitiveness Report 2013, Brussels 2013 (p. 38–46). ↑
- European Commission, Research and innovation statistics at regional level, Statistics Explained, Luxembourg, 2014. ↑
- European Commission, Researchers’ report – Final report 2013, Brussels, 2013 (p. 26). ↑
- European Commission, Commission staff working document — A rationale for action accompanying the Europe 2020 Flagship Initiative Innovation Union. SEC(2010) 1161 final, Brussels, 2010 (p. 34). ↑
- European Commission, A Reinforced European Research Area Partnership for Excellence and Growth, COM(2012) 392 final, Brussels, 2012 (p. 12 and 15). ↑
- European Commission, Researchers’ report — Final report 2013, Brussels, 2013 (p. 11). ↑
- See Knowledge Triangle and Innovation at http://ec.europa.eu/education/policy/higher-education/knowledge-innovation-triangle_en.htm ↑
- European Commission, Europe 2020 Flagship Initiative Innovation Union. SEC (2010) 1161, Brussels, 2011 (p. 11 and 36). ↑
- On the other hand, Luxembourg has one of the highest levels of mobile researchers; see Figure 8 illustrating the indicator on researchers’ mobility. ↑
- 2009 figure; (European Commission, She figures 2012 — Gender in Research and Innovation, Luxembourg, 2012 (p. 25)). ↑
- Grade A: the single highest grade/post at which research is normally conducted. (She figures 2012 — Gender in Research and Innovation, 2012, p. 135). ↑
- European Commission, Researchers’ Report — Final Report 2013, Brussels, 2013 (p. 42 and 45). ↑
- European Commission, European Research Area, Facts and Figures for 2013, Luxembourg, 2013. ↑
- European Commission, Researchers’ report — Final report 2013, Brussels, 2013 (p. 11) ↑
- European Commission, Commission staff working document — A rationale for action accompanying the Europe 2020 Flagship Initiative Innovation Union. SEC (2010) 1161 final, Brussels, 2010 (p. 87). ↑
- European Commission, Innovation Union Competitiveness Report 2013, Brussels, 2013 (p. 15). ↑
- MORE2 Higher Education Survey, 2012; see: http://www.more-2.eu/www/index.php?option=com_content&view=article&id=118&Itemid=125. ↑
- European Commission, Researchers’ report — Final report 2013, Brussels, 2013 (p. 104). ↑
- 2009 figures, European Commission, She figures 2012 — Gender in Research and Innovation. Luxembourg, 2012 (p. 43)). ↑
- European Commission, European Research Area, Progress report 2013, Luxembourg, 2013, (p. 22). ↑
- European Commission, Scoreboard 2014 — The EU ICT Sector and its R&D performance 2014, Brussels, 2014 (p. 3 onwards) ↑
- The data refer to individuals having either a medium or a high level of computer skills. A high level of basic computer skills refers to individuals who were able to carry out 5 or 6 of 6 computer-related items, whereas a medium level of basic computer skills refers to individuals who have carried out 3 or 4 of the following 6 computer-related items: copy or move a file or folder; use copy and paste tools to duplicate or move information within a document; use basis arithmetic formula (add, subtract, multiply, divide) in a spreadsheet; compress files; connect and install new devices, e.g. a printer or a modem; write a computer program using a specialised programming language. ↑
- EU average based on 2007 data. ↑
- EU average based on 2007 data. ↑
- The data refer to individuals having either a medium or a high level of internet skills. A high level of basic internet skills refers to individuals who were able to carry out 5 or 6 of 6 internet-related items, whereas a medium level of basic internet skills refers to individuals who have carried out 3 or 4 of the following 6 internet-related items: use a search engine to find information; send an e-mail with attached files; post messages to chatrooms, newsgroups or any online discussion forum; use the Internet to make telephone calls; use peer-to-peer file sharing for exchanging movies, music etc.; create a web page. ↑
- European Commission, Innovation Union Scoreboard 2014, Brussels, 2014 (p. 6). ↑
- European Commission, Innovation Union Scoreboard 2014, Brussels, 2014 (p. 6). ↑
- European Commission, Innovation Union Scoreboard 2014, Brussels, 2014 (p. 6). ↑
- European Commission, Regional Innovation Union Scoreboard 2014, Brussels, 2014 (p. 5). ↑
- http://www.eco-innovation.eu/media/EIO_introduction_brief1.pdf. ↑
- Detailed data is available in the database at: http://ec.europa.eu/environment/eco-innovation/. ↑
- The selection of sectors is based on the most active ones in terms of patent applications. ↑
- European Commission, 2011. Innovation Union Competitiveness Report 2011, Brussels, 2011 (p. 415). ↑
- European Commission, 2013. Innovation Union Scoreboard 2013, Brussels, 2013 (p. 7). ↑
- European Commission, Commission staff working document — A rationale for action accompanying the Europe 2020 Flagship Initiative Innovation Union. SEC(2010) 1161 final, Brussels, 2010 (p. 73). ↑
- European Commission, New report shows Europe needs more strategic high-tech investment, Press release, Brussels, 2013; see: http://ec.europa.eu/research/index.cfm?pg=newsalert&year=2013&na=na-021213. ↑
- European Commission, Research and innovation as sources of renewed growth COM(2014) 339 final, Brussels (p. 1–2) ↑
- European Commission, New report shows Europe needs more strategic high-tech investment, Press release, Brussels, 2013; see: http://ec.europa.eu/research/index.cfm?pg=newsalert&year=2013&na=na-021213. ↑
- European Commission, Taking stock of the Europe 2020 strategy for smart, sustainable and inclusive growth, COM(2014) 130 final, Brussels, 2014 (p. 12) and European Commission, Taking stock of the Europe 2020 strategy for smart, sustainable and inclusive growth, COM(2014) 130 final — Annexes 1 to 3, Brussels, 2014 (p. 7–10). ↑
- European Commission, Taking stock of the Europe 2020 strategy for smart, sustainable and inclusive growth, COM(2014) 130 final — Annexes 1 to 3, Brussels, 2014 (p. 32). ↑
- European Commission, Taking stock of the Europe 2020 strategy for smart, sustainable and inclusive growth, COM(2014) 130 final — Annexes 1 to 3, Brussels, 2014 (p. 33). ↑
- For some countries, the PNP is included in the GOV. ↑
- Current 2011 prices. ↑
- Regulation (EU) No 1291/2013 of the European Parliament and of the Council of 11 December 2013 establishing Horizon 2020 — the Framework Programme for Research and Innovation (2014–2020). ↑
- European Institute of Innovation and Technology, Catalysing innovation in the knowledge triangle: practices from the EIT knowledge and innovation communities, 2012 (p. 8). ↑
- European Commission, European Research Area, Facts and Figures for 2013, Luxembourg, 2013. ↑
- The need for a ’Fifth Freedom’ relating to research was first raised by Commissioner Potočnik in a speech in April 2007; see http://europa.eu/rapid/press-release_SPEECH-07-257_en.htm. ↑
- European Commission, A Reinforced European Research Area Partnership for Excellence and Growth, COM(2012) 392 final, Brussels, 2012. ↑
- European Commission, A Digital Agenda for Europe, COM(2010)245 final, Brussels, 2010 ; see also: Digital “to-do” list: new digital priorities for 2013-2014 at http://ec.europa.eu/digital-agenda/en/news/digital-do-list-new-digital-priorities-2013-2014. ↑
- European Commission, An agenda for new skills and jobs, COM(2010)682 final, Brussels, 2010. ↑
- European Commission, Innovation Union, COM(2010)546 final, Brussels, 2010. ↑
- European Commission, European Research Area, Facts and Figures for 2013, Luxembourg, 2013 (p. 23). ↑
- Harhoff, D., Hall, B.H., von Graevenitz, G., Hoisl, K., Wagner, S., Gambardella, A. and Giuri, P., The strategic use of patents and its implications for enterprise and competition policies, Final Report to DG Enterprise, JULY 8, 2007 (p. 7). ↑
- Gambardella, A., Giuri, P. and Mariani, M., Study on evaluating the knowledge economy: what are patents actually worth? The value of patents for today’s economy and society. Project ETD/2004/IM/E3/77 for DG Internal Market, 2006 (p. 28, 31). ↑
- Gambardella, A., Giuri, P. and Mariani, M., Study on evaluating the knowledge economy: what are patents actually worth? The value of patents for today’s economy and society. Project ETD/2004/IM/E3/77 for DG Internal Market, 2006 (p. 28, 31). ↑
- European Commission, Community Innovation Survey 2010 (CIS 2010), Luxembourg (p. 1 onwards). ↑
- European Commission, Commission staff working document — A rationale for action accompanying the Europe 2020 Flagship Initiative Innovation Union. SEC (2010) 1161 final, Brussels, 2010 (p. 6). ↑
- European Commission, 2013. Innovation Union Scoreboard 2013, Brussels, 2013 (p. 64). ↑
- http://www.eco-innovation.eu/index.php?option=com_content&view=article&id=2&Itemid=34 ↑
- European Commission, Research and innovation as sources of renewed growth, COM(2014) 339 final, Brussels (p. 1–2). ↑

