Labour cost structural statistics - levels
Data from 10 November 2023.
Next article update: September 2026.
Highlights
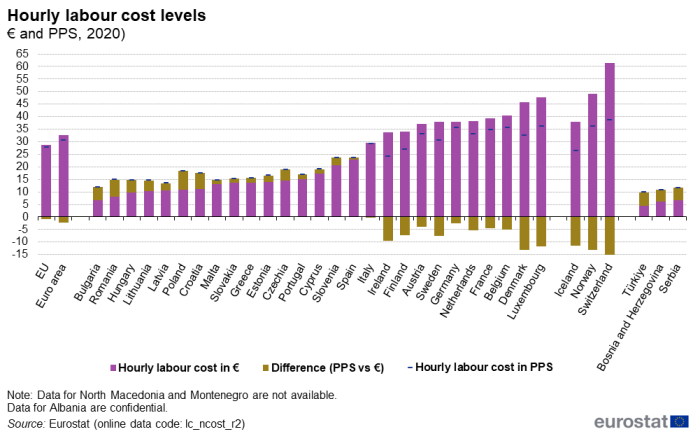
In 2020, the average hourly labour costs ranged from €6.6 in Bulgaria to €47.7 in Luxembourg.
Disparities within the EU were considerably smaller after adjusting for price differentials across countries.This article is based on the latest release of the 4-yearly Labour cost survey (LCS), with the reference year 2020. This survey is conducted every four years and provides comprehensive and detailed information, comparable at EU level, on the level and structure of labour costs in the different sectors of the economy. The LCS covers businesses with at least 10 employees and all economic activities defined in sections B to N and P to S of the statistical classification of economic activities in the European Union (NACE Rev 2). This article always refers to this scope, which is considered as 'total economy' including the calculation of relative shares. For the definitions of employees, hours worked and hours paid, in the context of this survey, please consult the paragraph: Data source and definitions, at the end of this article.
Full article
General overview
In 2020, the mean hourly labour cost in the European Union (EU) was €28.7 per hour worked and €32.6 in the euro area (EA). In the economic sector "financial and insurance activities" (NACE Rev.2 Section K) it was €49.2, 70.4 % higher than the EU average, while in the economic sector "accommodation and food service activities" (NACE Rev. 2 Section I) it was €17.1, 40.9 % lower.
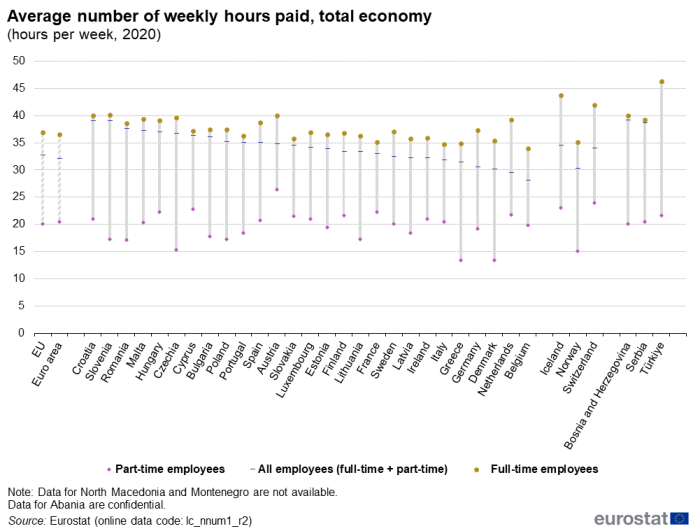
On average, full-time employees in the EU were paid for 36.9 hours per calendar week (i.e. all weeks of the year including e.g. holidays periods), while part-time employees were paid for 20.1 hours, approximately 55 % of full-timers.
Wages and salaries, including social contributions payable by employees, represent the largest share (75.6 %) of total labour costs, followed by social contributions paid by employers (23.4 %). The remainder (1.0 %) is absorbed by vocational training costs, other expenditures and taxes less subsidies on labour.
Weekly hours paid
In 2020, full-time employees were paid on average for 36.9 hours per calendar week in the EU, while part-time employees were paid for 20.1 hours (Figure 1). The highest average number of weekly hours paid for full-time employees was observed in Slovenia (40.1 hours), followed by Austria (40.0 hours) and Czechia (39.7 hours). The average weekly number of hours paid for full- time employees was below the EU average in 12 EU Member States, ranging between 34.0 hours paid in Belgium and 36.8 hours in Finland.
The highest number of average weekly hours paid to part-time employees in the EU was observed in Austria (26.4 hours), followed by Cyprus (22.8 hours), France (22.3 hours) and Hungary (22.2 hours). The average weekly number of hours paid to part-time employees was below the EU average in 13 EU Member States, ranging between 13.4 weekly hours paid to part-time employees in Denmark and Greece and 19.8 hours in Belgium.
The highest number of average weekly hours paid to all employees in the EU, be they working on a full-time or a part-time basis, was observed in Croatia and Slovenia (both 39.0 hours), followed by Romania (37.6 hours), Malta (37.2 hours) and Hungary (37.0 hours). The lowest numbers were recorded in Belgium (28.1 hours) and the Netherlands (29.4 hours). Those figures result from the combined effect of (1) the average number of hours paid to full-timers (2) those paid to part-timers and (3) the proportion of part-time employees in the mentioned economies.
Hours worked
Hours worked by enterprise size class
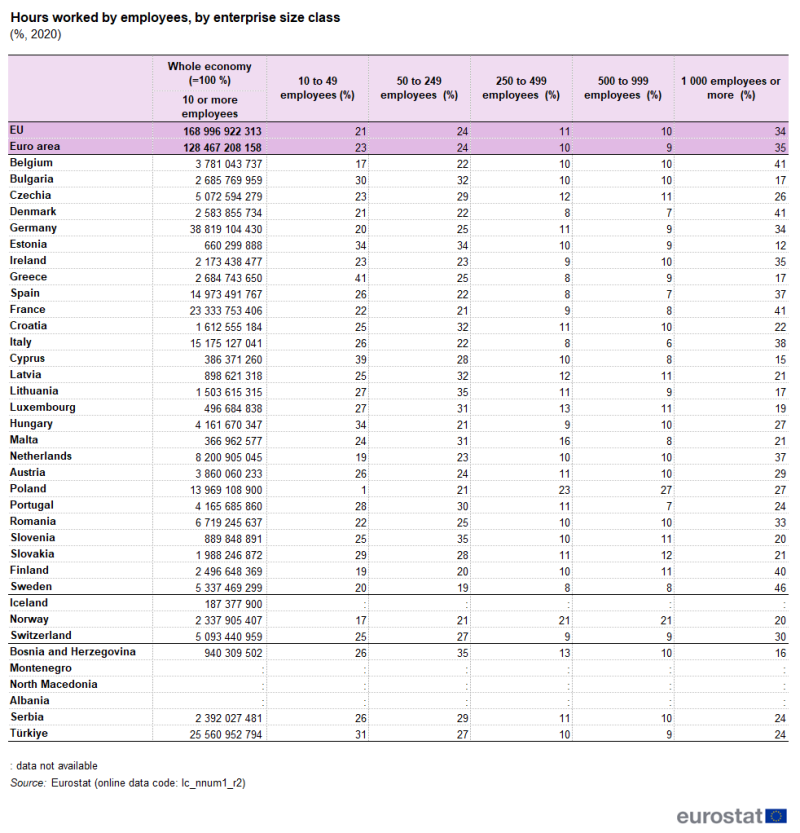
In the EU as a whole, the highest share of hours worked was recorded in enterprises employing 1000 or more employees (34 %) followed by enterprises employing between 50 and 249 employees (24 %) and those employing between 10 and 49 employees (21 %). The lowest shares were recorded in enterprises with 500 to 999 employees (10 %) followed by those employing between 250 and 499 employees (11 %) (Table 1). It should be noted that the share of total number of hours worked by size-class in each country is the result of the combination of the number of enterprises, the number of employees per enterprise and the number of hours worked per employee, for a given size-class.
Source: Eurostat (lc_nnum1_r2)
The highest share of hours worked in large enterprises (i.e. with more than 1000 employees) was observed in Sweden (46 %). Belgium, Denmark, France (all 41 %) and Finland (40 %) also showed high shares, followed by Italy (38 %) as well as Spain and the Netherlands (37 % both). At the other extreme, the lowest shares of hours worked in large enterprises were recorded in Estonia (12 %), Cyprus (15 %), Greece and Lithuania (17 % both). It should be noted that size classes are measured at national level and do not take into account, for enterprise groups, the employees working in foreign affiliates.
Poland recorded particularly high shares of hours worked in enterprises with 500 to 999 employees (27 % against 10 % for the EU average) as well as in enterprises with 250 to 499 employees (23 % against 11 % for the EU), as was also the case for Malta to some extent (16 %).
Enterprises with 50 to 249 employees had a high share of hours worked in Slovenia and Lithuania (both 35 % against 24 % for the EU) followed by Estonia (34 %) and Croatia (32 %).
As regards small businesses, with 10 to 49 employees, the highest share of hours worked was recorded in Greece (41 %), followed by Cyprus (39 %) then Estonia and Hungary (both 34 %).
Hours worked by economic sectors
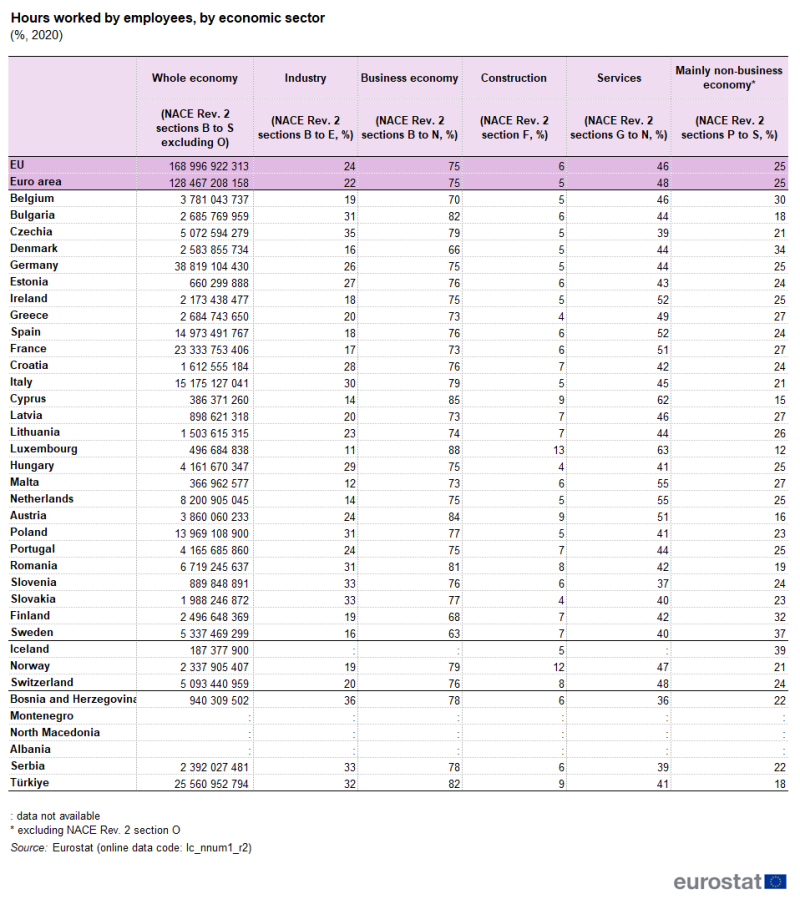
In the EU, 75 % of the hours worked in 2020 were recorded in the business economy (NACE Rev. 2 sections B to N) of which: 46 % in services (NACE Rev. 2 sections G to N); 24 % in industry (NACE Rev. 2 sections B to E) and 5 % in construction (NACE Rev. 2 section F) (Table 2).
The highest share for industry was recorded in Czechia (35 %), followed by Slovenia and Slovakia (both 33 %), then Bulgaria, Poland and Romania (all 31 %) as well as Italy (30 %). The lowest shares were observed in Luxembourg (11 %), Malta (12 %), Cyprus and the Netherlands (both 14 %), Denmark and Sweden (both 16 %), France (17 %), Ireland and Spain (both 18 %) as well as Belgium and Finland (19 %).
As regards the services sector, the highest share was recorded in Luxembourg (63 % against 46 % for the EU), followed by Cyprus (62 %).
Luxembourg was characterised by a high share of hours worked in enterprises in the construction sector (13 %) and a low share in the mainly non-business economy (12 %).
As regards the latter sector, the mainly non-business economy, which mainly covers education and health, the highest proportions were recorded in Sweden (37 %), Denmark (34 %) and Finland (32 %). The lowest, besides Luxembourg, were recorded in Cyprus (15 %), Austria (16 %), Bulgaria (18 %) and Romania (19 %).
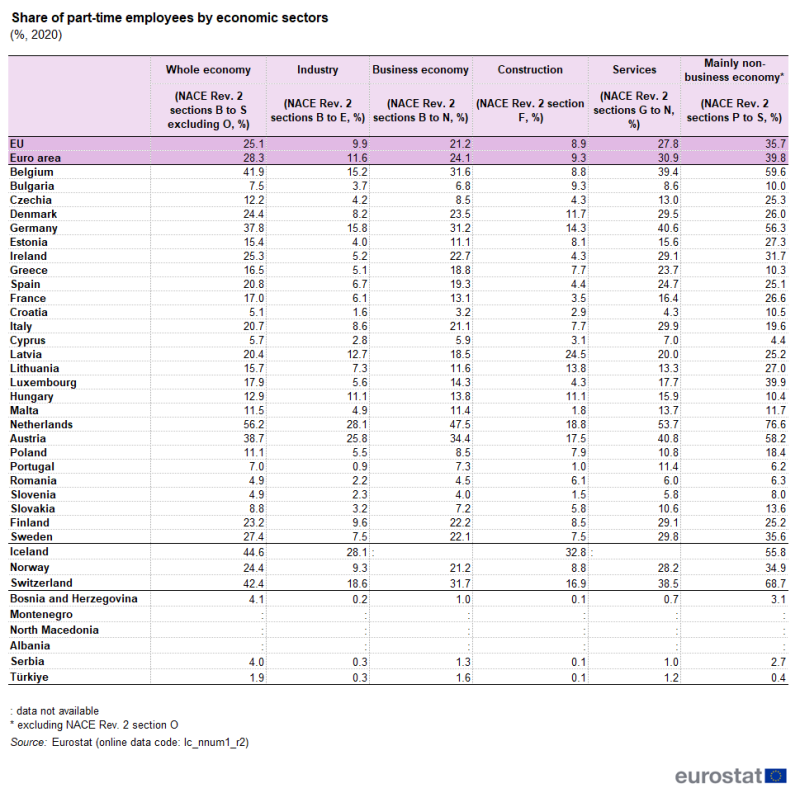
In 2020, 25.1 % of all employees were working part-time in the EU and 28.3 % in the euro area (Table 3). In the EU, the highest share of part-time employees was recorded in the mainly non-business economy (35.7 %) and the lowest in construction (8.9 %).
Part-time employees represented more than one-third of all employees in four Member States in 2020: the Netherlands (56.2 %), Belgium (41.9 %), Austria (38.7 %) and Germany (37.8 %). Seven countries recorded a share below 10 %: Romania and Slovenia (both 4.9 %), Croatia (5.1 %), Cyprus (5.7 %), Portugal (7.0 %), Bulgaria (7.5 %) and Slovakia (8.8 %).
Structure of labour costs
'Labour costs' are the costs borne by employers to use the labour provided by their employees. The components of the labour costs are: compensation of employees (D1), vocational training costs (D2), other expenditures (e.g. recruitment costs and money spent on uniforms) (D3), taxes paid by the employer on behalf of employees (D4) less subsidies (D5) received as incentives to employ labour, as shown in the diagram below.
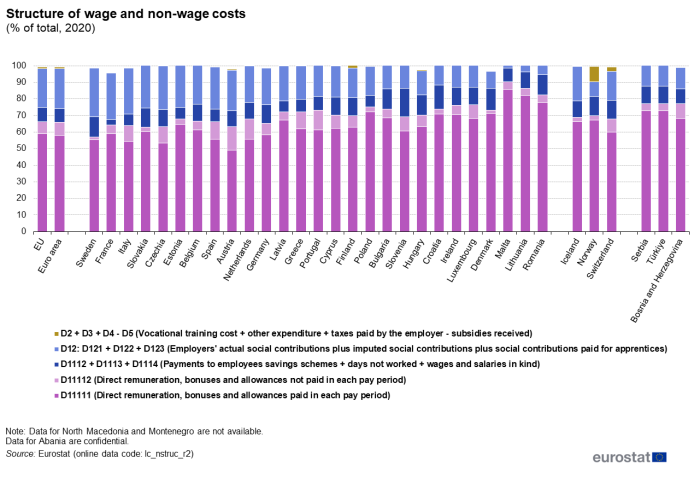
Wages and salaries, including social contributions payable by employees, represent the largest share of total labour costs (75.6 % for the EU as a whole), followed by social contributions paid by employers (23.4 %). The remainder (1.0 %) is absorbed by vocational training costs, other expenditures and taxes less subsidies received on labour (Figure 2).
The main part of labour costs corresponds to 'Compensation of employees' including (gross) wages and salaries (D11) and employers' social contributions (D12). Wages and salaries are further split, distinguishing between direct remuneration, bonuses and allowances paid in each pay period (D11111), direct remuneration, bonuses and allowances not paid in each pay period (D11112), payments to employees' savings schemes (D1112), payments for days not worked (D1113) and wages and salaries in kind (D1114). Similarly, employers' social contributions (D12) are split into employers' actual social contributions (D121) and employers' imputed social contributions (D122) both excluding apprentices, as well as employers' social contributions for apprentices (D123).
In 2020, the average share of direct remuneration, bonuses and allowances paid in each pay period (D11111) was 59.0 % in the EU and 58.1 % in the euro area. The highest share was observed in Malta (85.7 %), followed by Lithuania (82.0 %) and Romania (77.8 %). The lowest shares were observed in Austria (49.2 %), Czechia (53.3 %), Italy (54.3 %), Sweden (55.5 %), Spain (55.6 %) and the Netherlands (55.7 %).
The average share of bonuses and allowances not paid in each pay period (D11112) was, in 2020, 7.2 % in the EU and 7.8 % in the euro area. The highest shares, all above 10%, were recorded in five EU Member States: Austria (14.2 %) followed by the Netherlands (12.2 %), Portugal (11.9 %), Spain (10.6 %) and Greece (10.4 %).
Within social contributions paid by employers (D12), Employers' actual social contributions (D121) were the main component (19.4 % of total labour costs, at EU level). In four EU Member States, the latter accounted for more than one-quarter of the total labour cost: (25.2 %) in Czechia ; (25.4 %) in Italy, (26.2 %) in Slovakia and (27.8 %) in Sweden. Employers' actual social contributions recorded the lowest share of the total labour costs in Lithuania (1.6 %), followed by Romania (3.5 %), Malta (5.7 %) and Denmark (8.2 %).
The highest share of vocational training costs (D2) was observed in Ireland (3.0 %),followed by France (1.3 %), the Netherlands (1.1 %) and Hungary (1.0 %). In the remaining Member States, the share of vocational training costs ranged between 0.1 %, recorded in Belgium, Bulgaria, Greece, Cyprus, Latvia as well as Romania, and 0.6 % in Malta.
'Other expenditures paid by the employer' (D3) include in particular recruitment costs and costs for working clothes provided by the employer. The highest shares for this component of labour costs were recorded in the Netherlands and Hungary (both 2.0 %), followed by Denmark (1.1 %), Sweden and Croatia (1.0 % for both) and Poland (0.9 %). In the remaining Member States, the share of other expenditures paid by the employer ranged between 0.1 % in Germany, Ireland, Greece, Italy and Cyprus and 0.7 % in Spain and Finland.
The highest share of taxes paid by the employer (D4) was recorded in France (2.6 %) and Austria (2.3 %) followed by Sweden (1.7 %) and Denmark (1.5 %).
The share of subsidies received by the employer (D5) was the highest in Malta (6.9 %) followed by the Netherlands (4.2 %) and Ireland (4.1 %).
Hourly labour costs in euro and purchasing power standards
In 2020, the highest hourly labour costs among EU Member States, expressed in euros, were recorded in Luxembourg (€47.7), followed by Denmark (€45.7), Belgium (€40.5) and France (€39.2). The lowest levels were recorded in Bulgaria (€6.6), Romania (€8.2) and Hungary (€9.8). The highest level, recorded for Luxembourg, was 7.3 times higher than the lowest, recorded for Bulgaria.
Disparities are considerably smaller when hourly labour costs are expressed in purchasing power standard (PPS), a measure which accounts for price differentials across countries. In PPS, hourly labour costs range from 11.9 in Bulgaria to 36.1 in Luxembourg i.e. 3 times more.
Data source and definitions
The Labour cost survey (LCS) provides details on the level and structure of labour cost data, hours worked and hours paid for employees in the European Union (EU).
Employees include all persons employed at the observation unit and with an employment contract (permanent or not), except family workers; home workers; occasional workers; persons wholly remunerated by way of fees or commission; board of Director Members; directors/managers paid by way of profit share or by a fee; self-employed persons. Data do not cover apprentices except in the case of Bulgaria, Latvia, Croatia, Slovenia and Serbia where they represent a low share of the total labour force (less than 1 %).
If not otherwise stated, data refer to full-time and part-time employees working in enterprises employing 10 employees or more, in all economic sectors except: agriculture, forestry and fishing (NACE Rev. 2 Section A) and public administration and defence; compulsory social security (NACE Rev. 2 Section O). The transmission of LCS data for NACE section O is voluntary.
Hours worked are defined as the periods of time employees spent on direct and ancillary activities to produce goods and services, including normal periods of work, paid and unpaid overtime and time spent on preparation, maintaining, repairing, cleaning and writing reports associated with main work. They exclude periods of vacation and other public holidays, sick leave and other types of absence which employees are paid for.
Hours paid cover normal and overtime hours worked remunerated by the employer to employees, hours for which the employee is paid at a reduced rate as well as the hours not worked but nevertheless paid (e.g. annual holidays/vacation, absence due to sickness, public holidays and other hours paid, including time off for medical examinations, births, weddings, funerals, moving house etc.).
The average hours paid per calendar week are calculated as the total number of hours paid by a full-time employee during the year divided by the decimal number of all weeks in that year (i.e. 52.14) including vacation/holidays and other periods (e.g. sick leave) where the employee is not available for producing goods and services. This number should not be confused with the standard number of hours worked during a working week.
Context
Labour costs refer to the total expenditure borne by employers in order to employ staff. They cover wage and non-wage costs less subsidies. They do include vocational training costs or other expenditures such as recruitment costs, spending on working clothes, etc.
Direct access to
- Labour costs survey
- Labour market (including Labour Force Survey, see Methodology - Labour costs
- Regulation (EC) No 530/1999 of 9 March 1999 concerning structural statistics on earnings and on labour costs
- Regulation (EC) No 1737/2005 of 21 October 2005 amending Regulation (EC) No 1726/1999 as regards the definition and transmission of information on labour costs (Text with EEA relevance)
- Regulation Regulation (EC) No 698/2006 of 5 May 2006 implementing Council Regulation (EC) No 530/1999 as regards quality evaluation of structural statistics on labour costs and earnings (Text with EEA relevance)
- Regulation (EC) No 1893/2006 of 20 December 2006 establishing the statistical classification of economic activities NACE Revision 2 and amending Council Regulation (EEC) No 3037/90 as well as certain EC Regulations on specific statistical domains (Text with EEA relevance)
- Summaries of EU Legislation: Comparable EU-wide statistics on economic activities
- Summaries of EU Legislation: Statistical classification of economic activities
- Regulation (EC) No 973/2007 of 20 August 2007 amending certain EC Regulations on specific statistical domains implementing the statistical classification of economic activities NACE Revision 2
