Archive:Tourism statistics for Croatia
In 2012, 88 % of foreign guest nights in Croatia were spent by visitors from within the EU
Statistics in focus 2/2014; Author: Christophe Demunter, Krista Dimitrakopoulou
ISSN:2314-9647 Catalogue number:KS-SF-14-002-EN-N
On 1 July 2013, Croatia became the 28th Member State of the European Union. With its Mediterranean climate and long Adriatic coastline, Croatia is a popular tourist destination. In 2012, residents from EU Member States made more than 7.2 million trips to Croatia, accounting for 70.4 million tourism nights and EUR 3.5 billion of tourism expenditure (NB: data for these variables do not include trips by residents of Denmark, Greece, France, Poland, Sweden and the United Kingdom).
This article takes a closer look at the importance of tourism for the Croatian economy and population.








Main statistical findings
Hotel, restaurant and catering sector employs 3 out of 4 persons in tourism industries
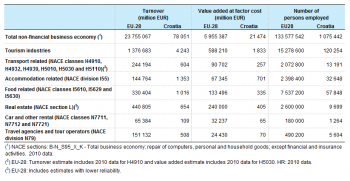
Tourism industries in Croatia recorded a total turnover in 2011 of EUR 4.2 billion (see Table 1), corresponding to 5.4 % of the total turnover of the non-financial business economy in Croatia. This is just below the 5.8 % share for the EU-28 as a whole. Accommodation and food service activities represented 56 % of the tourism industries’ turnover (compared with 35 % for the EU-28), and accounted for 75 % of the over 120 000 persons employed in tourism industries.
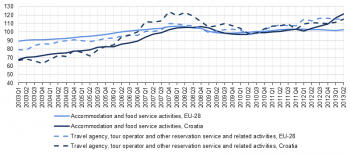
The quarterly index of turnover for a subset of tourism industries (accommodation and food services, travel agency and tour operators) indicates a relatively stronger growth in Croatia over the period 2003-13 than for the average of the European Union (see Figure 1).
Tourism has a very strong seasonal component
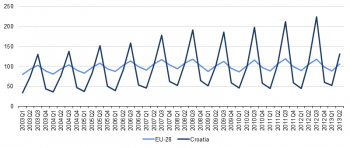
Compared with the EU-28, Croatia’s tourism activities are much more seasonal. Figures 2 and 3 show the more pronounced seasonal variations of the quarterly index of turnover for accommodation and food services and for travel agencies and tour operators respectively.
The strong seasonality is confirmed by volume data, presented in Figure 4, for the monthly number of nights spent at tourist accommodation establishments. The peak months of July and August accounted for 58 % of nights spent in Croatian tourist accommodation establishments during the year 2012. While July and August are also the two peak months at EU level, only 33 % of nights spent in the EU during 2012 were recorded in these months. The winter months from November to March had a share of nearly 25 % of European guest nights in 2012, while for Croatia the same five-month period was far less significant at 3.7 % of the annual total.
Accommodation infrastructure is heavily concentrated in coastal areas
In 2012, the number of available bed places in Croatian tourist accommodation establishments was just under 800 000 (around 2.7 % of bed places in the European Union), of which 20 % were in hotels and similar accommodation, 52 % in holiday and other short stay accommodation and 28 % on camping grounds, recreational vehicle parks and trailer parks (see Table 2).
With the adoption of EU Regulation 0692/2011 concerning European statistics on tourism, accommodation data is also available broken down by type of locality – according to the degree of urbanisation and whether coastal or non-coastal location – and by size class of the establishments (the latter only for hotels and similar accommodation).
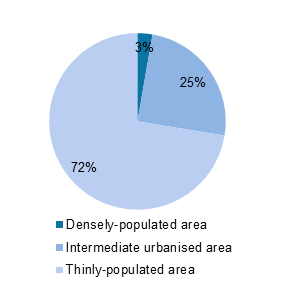
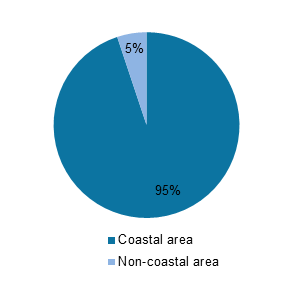
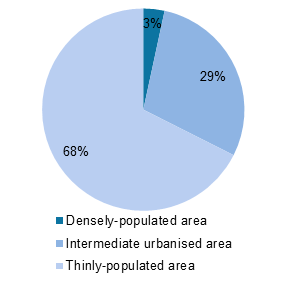
In 2012, only a small share of total bed places in Croatia was located in densely populated areas (see Figure 5). From a topographic point of view, the vast majority of bed places (95 %) was located in coastal areas – i.e. in municipalities bordering the sea or having more than half of their territory within 10km of the coastline (see Figure 6). This strong focus on (more climate dependent) coastal tourism can partially explain the high degree of seasonality observed in Croatian tourism industries (see also Figures 2 to 4).
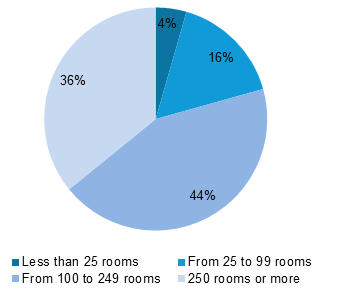
A significant share of bed places was located in small family-run businesses included in holiday and other short stay accommodation. For hotels and similar accommodation, smaller establishments having fewer than 25 rooms had a dominant share of 40 % (see Figure 7). Larger hotels of 100 to 249 rooms or more than 250 rooms accounted for 21 % and 8 % respectively of total bed place capacity.
Tourism grew slightly faster in Croatia than in the EU during the period 2000-11
Figure 8 looks at the growth in tourism — measured as the evolution in the number of nights spent at tourist accommodation establishments — over the period ranging from 2000 to 2011. At the beginning of the 2000s in particular, Croatia experienced a significantly higher growth — with an average annual growth rate of 3.9 % in the years 2000 to 2005 — than the European Union, which averaged 0.9 % during the same years (in the aftermath of the 9/11 attacks). In the second half of the decade, the Croatian growth pattern resembled more and more that of the EU. However, the negative impact of the economic crisis caused a dip that extended until 2010 in Croatia, while recovery for the EU as a whole already started in 2009. In 2011, Croatian tourist accommodation establishments saw growth of 6.1 % in the number of nights spent, compared with a growth of 3.4 % for the EU as a whole.
Tourism in Croatia is mainly focused on foreigners from within the EU
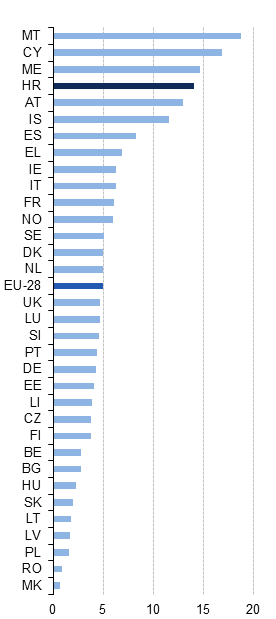
In 2012, over 62 million guest nights were recorded in Croatian tourist accommodation establishments (see Table 3). Tourism intensity measures the guest nights per inhabitant of the country. For Croatia, this intensity level was relatively high at 14.1 (EU-28: 5.0). Only the island Member States of Malta (18.8) and Cyprus (16.9) and the neighbouring country of Montenegro (14.7) recorded a higher tourism intensity (see Figure 9).
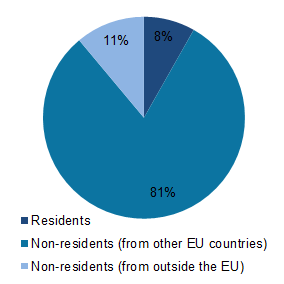
Croatia was an attractive destination for foreigners in 2012 (see Figure 10). Non-residents accounted for 92 % of nights spent at tourist accommodation establishments, while the average tourism nights by non-residents for all Member States is less than half that (44 %). The majority of these non-residents originated from other EU Member States. Only 11 % of guest nights in Croatian accommodation establishments were spent by tourists from outside the EU.
The top-5 foreign markets for Croatia were Germany (24 %), Slovenia (11 %), Austria (9 %), the Czech Republic and Italy (both 8 %) (see Figure 11).
The choice of destinations was in line with the distribution of accommodation capacity: a very small proportion of guest nights in establishments located in densely populated areas and 95 % in coastal areas (see Figures 12 and 13, also Figures 5 and 6). Only the island countries of Malta and Cyprus saw a higher dominance of coastal tourism. At the level of the European Union, around 44 % of all nights spent were recorded in coastal areas. While the largest hotels (250 bed places or more) accounted for only 8 % of establishments, they recorded more than one third (36 %) of all nights spent at hotels and similar accommodation during 2012 (see Figure 14).
Only 1 in 3 residents of Croatia made one or more long holiday trips in 2012
Previous sections looked at the Croatian tourism industry and at Croatia as a tourism destination. This section and the following ones will take a look at Croatia as a generating market by focusing on the participation of Croatian residents in tourism and the characteristics of the trips they made in 2012.
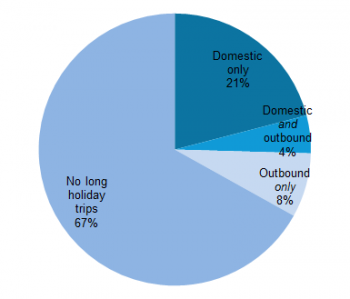
Figure 15 shows participation in tourism, measured as the share of the population (aged 15 or over) that made at least one holiday trip of four nights or more during the reference year. Two thirds of the Croatian population did not participate in tourism during the year 2012, 25 % made at least one domestic trip of four nights or more, and 12 % made at least one outbound trip of four nights or more (4 % made both domestic and outbound trips in 2012). In other words, many Croatians did not go on a long holiday in 2012 and those who did mainly visited a destination in Croatia.
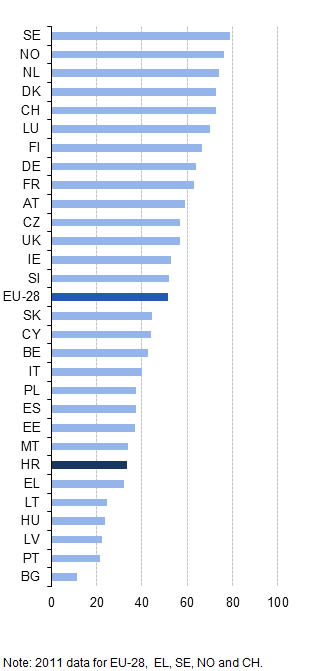
This relatively low participation in tourism of 33 % (EU-28: 51.2 %) can possibly be explained by the geographical location of the country and its appealing climate during the main tourism season. A similar below EU average participation is also observed for most other Mediterranean or southern Member States (see Figure 16).
The typical Croatian holiday trip was by car to a domestic destination staying in non-rented accommodation
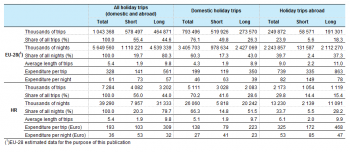
Residents of Croatia (aged 15 or over) made 7.3 million trips for personal purpose during 2012, corresponding to nearly 40 million nights (see Table 4). Some 56 % of these were short trips of 1 to 3 nights away from home, of which three quarters were spent in Croatia. For the 44 % of trips of 4 nights or more, domestic trips again accounted for the biggest share (two thirds).
The balance between short trips and long trips was comparable to the averages observed for the EU-28. However, while domestic trips were the dominant segment for both Croatia and the EU-28, outbound trips were slightly more significant for Croatia (29.8 %, compared with 23.9 % for the EU as a whole). A majority of outbound trips had a destination in the EU, mainly in Italy, Slovenia, Austria or Germany (see Figure 17).
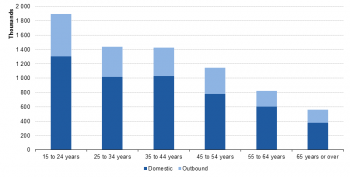
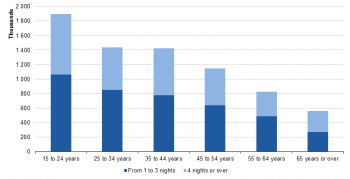
Age did not seem to be an important factor in the choice of destination or the duration of tourism trips. Both domestic and outbound trips, and short and long trips, were more or less equally represented in each age segment (see Figures 18 and 19), the only exception being a relatively stronger presence of long trips in the age group 65 years or over.
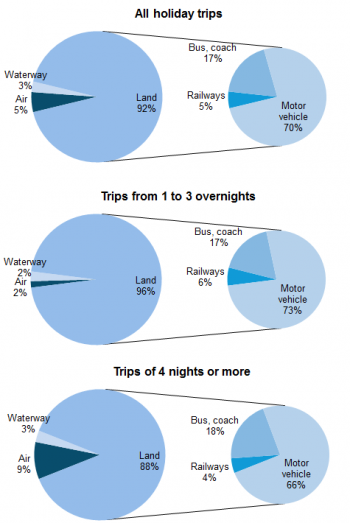
As to the means of transport used to reach the destination, a majority of trips (70 %) had a motor vehicle (owned or rented) as the main means of transport (see Figure 20). With a share of 17 %, buses and coaches were also popular. Railway transport and air transport accounted for only 5 % each, although the share for air transport reached 9 % when considering only long trips of four nights or more.
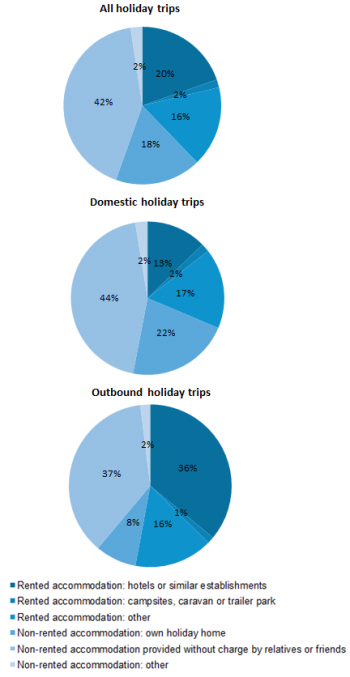
The breakdown of holiday trips made by Croatian residents by type of accommodation is shown in Figure 21. Accommodation provided without charge by friends or relatives was the most common accommodation choice in 2012 (42 %), followed by hotels and similar accommodation (20 %) and owned holiday homes (18 %). More than two thirds of domestic holiday trips were spent at non-rented accommodation; for outbound trips, the share was just below half of all holiday trips.
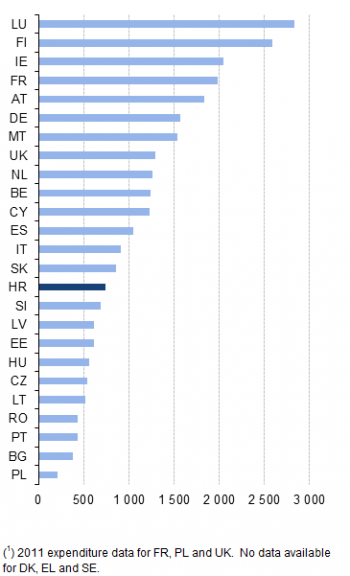
Croatian tourists spent on average EUR 193 per holiday trip (NB: this refers to expenditure per individual, not for the entire household or travel party), or EUR 36 per night; the average expenditure level for the EU-28 amounted to EUR 328 per trip and EUR 61 per night (see Table 4). Average expenditure per trip for trips made by residents of Croatia was 2.4 times higher for foreign trips (EUR 325) than for domestic trips (EUR 138). Average expenditure per night was 2.0 times higher for foreign trips (EUR 53) than for domestic trips (EUR 27). The average annual tourism expenditure per inhabitant who participated in tourism during the reference year 2012 was EUR 738 (see Figure 22), putting Croatia in the middle group of Member States for which this indicator is available, just ahead of its neighbouring country Slovenia.
Although domestic trips accounted for the dominant share of the number of trips made by Croatians, the share of outbound trips in total tourism expenditure in 2012 (EUR 1 409 million) was just above the share of domestic trips (50.1 % against 49.9 %).
Travel had a very positive impact on the balance of payments for Croatia in 2012 (see Table 5). Travel receipts (EUR 6.8 billion) were 9 times higher than travel expenditure (EUR 0.7 billion), resulting in a EUR 6.1 billion surplus for the travel item of Croatia's balance of payments.
Data sources and availability
A system of harmonised tourism statistics was established in Council Directive 95/57/EC of 23 November 1995 on the collection of statistical information in the field of tourism. This legal basis requires EU Member States to provide a regular set of comparable tourism statistics. Amendments in 2004 and 2006 concerned the enlargement of the EU and recent changes in the world market for tourism. In July 2011, the European Parliament and the Council of the European Union adopted a new Regulation 692/2011 concerning European statistics on tourism and repealing Council Directive 95/57/EC; this came into force for the 2012 reference year.
Tourism statistics in the EU consist of two main components: on the one hand, statistics relating to capacity and occupancy in collective tourist accommodation; on the other, statistics relating to tourism demand. In most EU Member States, the former are collected via surveys filled in by accommodation establishments, while the latter are mainly collected via traveller surveys at border crossings or through household surveys.
This article includes data extracted from other areas of official statistics, in particular structural business statistics (SBS), short-term business statistics (STS) and balance of payments, in order to provide users with a better economic analysis of this sector that is an important motor for many countries' economies and labour market.
Context
The EU is a major tourist destination, with five of its Member States among the world’s top 10 destinations for holidaymakers, according to UNWTO[1] (United Nations World Tourism Organisation) data. Tourism has the potential to contribute towards employment and economic growth, as well as to development in rural, peripheral or less-developed areas. These characteristics drive the demand for reliable and harmonised statistics within this field, as well as within the wider context of regional policy and sustainable development policy areas.
Tourism can play a significant role in the development of European regions. Infrastructure created for tourism purposes contributes to local development, while jobs that are created or maintained can help counteract industrial or rural decline. Sustainable tourism involves the preservation and enhancement of cultural and natural heritage, ranging from the arts to local gastronomy or the preservation of biodiversity.
In 2006, the European Commission adopted a Communication titled 'A renewed EU tourism policy: towards a stronger partnership for European tourism’ (COM(2006) 134 final). It addressed a range of challenges that will shape tourism in the coming years, including Europe’s ageing population, growing external competition, consumer demand for more specialised tourism, and the need to develop more sustainable and environmentally-friendly tourism practices. It argued that more competitive tourism supply and sustainable destinations would help raise tourist satisfaction and secure Europe’s position as the world’s leading tourist destination. It was followed in October 2007 by another Communication, titled 'Agenda for a sustainable and competitive European tourism’ (COM(2007) 621 final), which proposed actions in relation to the sustainable management of destinations, the integration of sustainability concerns by businesses, and the awareness of sustainability issues among tourists.
The Lisbon Treaty acknowledged the importance of tourism — outlining a specific competence for the EU in this field and allowing for decisions to be taken by a qualified majority. An article within the Treaty specifies that the EU ‘shall complement the action of the Member States in the tourism sector, in particular by promoting the competitiveness of Union undertakings in that sector’. ‘Europe, the world’s No 1 tourist destination — a new political framework for tourism in Europe’ (COM(2010) 352 final) was adopted by the European Commission in June 2010. This Communication seeks to encourage a coordinated approach for initiatives linked to tourism and defined a new framework for actions to increase the competitiveness of tourism and its capacity for sustainable growth. It proposed a number of European or multinational initiatives — including a consolidation of the socioeconomic knowledge base for tourism — aimed at achieving these objectives.
See also
- All articles on Croatia
- Coastal regions - population statistics
- Coastal region statistics
- Mediterranean and Black Sea coastal region statistics
- Tourism statistics
Further Eurostat information
Data visualisation
- Regional Statistics Illustrated - select statistical domain 'Tourism' (top right)
Publications
Main tables
Database
Dedicated section
Methodology / Metadata
- Annual data on trips of EU residents (ESMS metadata file - tour_dem_esms)
- Capacity of tourist accommodation establishments (ESMS metadata file - tour_cap_esms)
- Methodological manual for tourism statistics
- Occupancy of tourist accommodation establishments (ESMS metadata file - tour_occ_esms)
Source data for tables, figures and maps (MS Excel)
Other information
- Agenda for a sustainable and competitive European tourism (Communication from the European Commission, October 2007)
- Methodology for tourism statistics and Tourism Satellite Accounts (TSA)
External links
Notes