Data extracted in March 2024.
Planned article update: 30 April 2025.
Highlights
Among European Neighbourhood Policy-South countries for which data is available, the share of people aged 65 years and older within the total population ranged from 2.8% in Libya (in 2020) to 12.3% in Israel (in 2021), while it was estimated at 21.1% in the EU (in 2022).
In 2020, Libya had the lowest population density among the European Neighbourhood Policy-South countries with 4 inhabitants per square kilometre, while Palestine had the highest population density among the countries at 836 inhabitants per square kilometre.
Among European Neighbourhood Policy-South countries in 2022, only Israel recorded higher life expectancy for both men and women than in the EU. Lowest life expectancy at birth was recorded for men in Jordan, 72.7 years; and for women in both Egypt (2019 data) and Jordan at 75.1 years.
This article is part of an online publication and presents information relating to a range of demographic statistics for nine of the ten countries that form the European Neighbourhood Policy-South (ENP-South) region — Algeria, Egypt, Israel, Jordan, Lebanon, Libya, Morocco, Palestine [1] and Tunisia. Cooperation with Syria is suspended since 2011. Lebanon excludes Palestinian refugee camps from its survey. Aside from basic data on population levels and structure, the article also provides information for these countries and the European Union (EU) on the population density, natural change in the population, infant mortality rate, life expectancy and school completion rate for primary education.
Given that data collection for ENP-South countries is non-obligatory and subject to various changes, such as shifts in country status or alterations in the political and geographical context, data availability is often inconsistent over the entire presented period or for recent years.
Population by sex
Population or usual resident population represents the number of inhabitants of a given area. Eurostat uses the reference date of 1 January of the year in question. In some cases, the 31 December of the previous year is used.
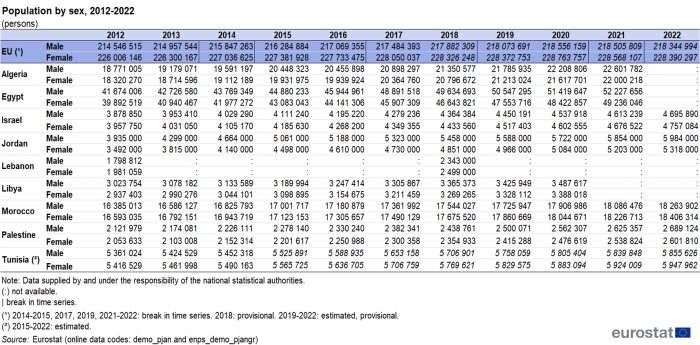
Data for the ENP-South countries and the EU on the total population by sex for the years 2012-2022 is shown in Table 1. In 2022, the number of women in the total population was higher in Lebanon (51.6 % in 2018, the latest available data), Tunisia (50.4 %), Israel (50.3 %) and Morocco (50.2 %), whereas the number of men in the total population was higher in Jordan (52.9 %), Egypt (51.5 % in 2021 – latest available data), Palestine (50.8 %), Algeria and Libya (50.7 % each, although Algerian data refers to 2021, and Libyan data to 2020 – latest data available). In the EU, women made up 51.1 % of the total population.
Between 2012 and 2022, or the latest year for which data is available, the population grew year on year in the ENP South region.
Algeria's population grew over this period by 20 % for both genders: from 18.8 million in 2012 to 22.6 million men in 2021; and from 18.3 million to 22.0 million women in 2021.
Egypt's population, which is the most populous of the ENP-South countries, increased between 2012 and 2021 (2022 data not available) by 25 % for men (from 41.7 million to 52.2 million), and by 23 % for women (from 39.9 million to 49.2 million).
Israel's demographics showed a consistent upward trend, with an increase of 21 % for the male population (from 3.9 million in 2012 to 4.7 million in 2022), and 20 % for the female population (from 4.0 million to 4.8 million over the period).
In Jordan, the male population increased from 3.9 million in 2012 to 6.0 million in 2022, and the female population from 3.5 million in 2012 to approximately 5.3 million in 2022, showing one of the strongest growths in the region for this period, with a rise of 52 % for both genders. Data for Lebanon, although limited, presents a population of 1.8 million men and 2.0 million women in 2012, and 2.3 million men and 2.5 million women in 2018 (no other data available).
Libya's population increased by 15 % for both genders, from 3.0 million to 3.5 million men, and from 2.9 million to 3.4 million women between 2012 and 2020 (no more recent data available).
Morocco's population experienced a steady increase between 2012 and 2022, rising by 11 % for both genders: from 16.4 million to 18.3 million men, and from 16.6 million to 18.4 million women; while Palestine showed a rise of 27 % for both genders over the same period (from 2.1 million men to 2.7 million, and from 2.1 million to 2.6 million women).
Tunisia's population registered the slowest growth rate from the ENP South region between 2012 and 2022, from approximately 5.4 million to an estimation of 5.9 million for both men and women demographics, representing an increase of 9% and 10% respectively over the period.
In the EU, the male population increased marginally from approximately 214.5 million in 2012 to about 218.3 million in 2022. The female population followed a similar trajectory, starting at roughly 226.0 million and slightly rising to 228.4 million during the same period, indicating a steady but slow growth rate.
Population by age class
The age distribution within a population provides invaluable insights into the socioeconomic status and potential future challenges of a region. The Eurostat data for 2022, or the most recent year available, is presented in Figure 1 and sheds light on the demographic composition across the European Union (EU) and ENP-South countries.
The share of the elderly population, defined here as persons aged 65 years and over, accounted for 12.33 % of the population in Israel (2021 data), 11.0 % in Lebanon (2018 estimated data), 9.6 % in Tunisia, 7.9 % in Morocco, 6.9 % in Algeria (2021 provisional data), 3.9 % in Egypt (2021 data), 3.7 % in Jordan, 3.4 % in Palestine and 2.8 % in Libya (2020 data). In comparison, people aged 65 years and over made up 21.1 % of the total population of the EU in 2022, a higher proportion than in any of the ENP-South countries. This reflects, among other factors, greater longevity among the EU population.
At the other end of the age spectrum, the shares of young people in the total populations of the ENP-South countries were higher than the EU average. The highest proportion was recorded in 2022 for Palestine, where those aged less than 15 years made up 37.8 % of the population. In Jordan, people aged less than 15 years accounted for 34.4 %. In Egypt, 34.2 % of the total population were aged under 15 years (2021 data). In Libya, the share was 31.3 % (2020 data); in Algeria 30.6 % (2021 provisional data); in Israel 27.9 % (2021 data); in Morocco 25.3 %; in Tunisia 25.0 %; and in Lebanon 24.1 (2018 estimated data). Young people accounted for 15.0 % of the EU's population in 2022.
The EU's population is ageing, as consistently low birth rates and higher life expectancy transform the shape of its age pyramid. As a result, the proportion of people of working age in the EU is shrinking, while the relative number of those retired is expanding. This will, in turn, lead to an increased burden on those of working age to provide for the social expenditure required by the ageing population for a range of services. These issues are less evident in the ENP-South countries, as they have a lower proportion of persons aged over 65 years in their populations.
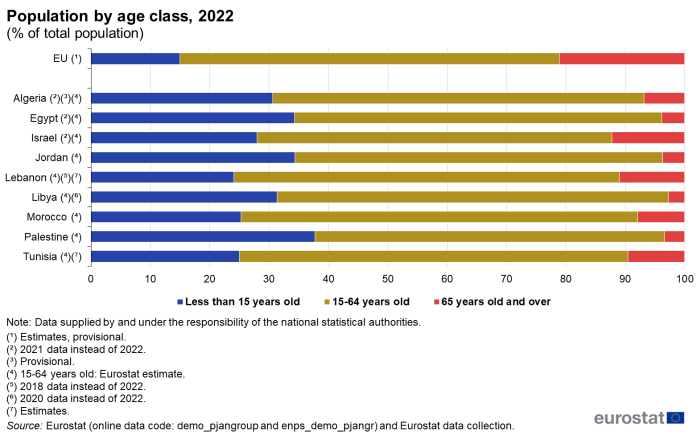
(% of total population)
Source: Eurostat (demo_pjangroup), (enps_demo_pjangr) and Eurostat data collection
Population density
Data on population density, measured in inhabitants per square kilometre, is illustrated in Figure 2 for the ENP-South countries and compared with the EU.
Palestine's population density was by far the highest among ENP-South region in 2022, at 878.2 inhabitants per square kilometre. In 2012, its population density stood at 693.1 inhabitants per square kilometre. Palestine's population density in 2022 was twice as high as Israel's, and almost seven times that of Jordan's population density.
Israel experienced a steady increase in its population density, from 347.1 inhabitants per square kilometre in 2012 to 415.3 in 2022.
Lebanon reported a density of 362 inhabitants per square kilometre in 2012 (no more recent data available).
The population density in Jordan increased from 83.6 in 2012 to 127.3 inhabitants per square kilometre in 2022. Its population density in 2022 represented nearly a third of Israel's.
Between 2012 and 2019 (latest available data), population density in Egypt increased from 81.8 to 98.1 inhabitants per square kilometre, while Tunisia's population density grew marginally from 65.7 to 68.4 inhabitants per square kilometre between 2012 and 2016 (latest available data).
Libya, with the lowest density among the ENP-South region, saw a marginal increment between 2012 and 2020 (2013 and 2021-2022 data not available) from 3.6 to 4.1 inhabitants per square kilometre.
The EU's population density remained relatively stable over the decade, with a slight fluctuation around 108 inhabitants per square kilometre.
Overall, these density trends highlight the diverse demographic pressures faced by different regions. While some are experiencing a notable intensification in population concentration, potentially leading to urban crowding and resource challenges, others maintain low density, which can offer opportunities for spatial and economic expansion.
There is no data available for Morocco.
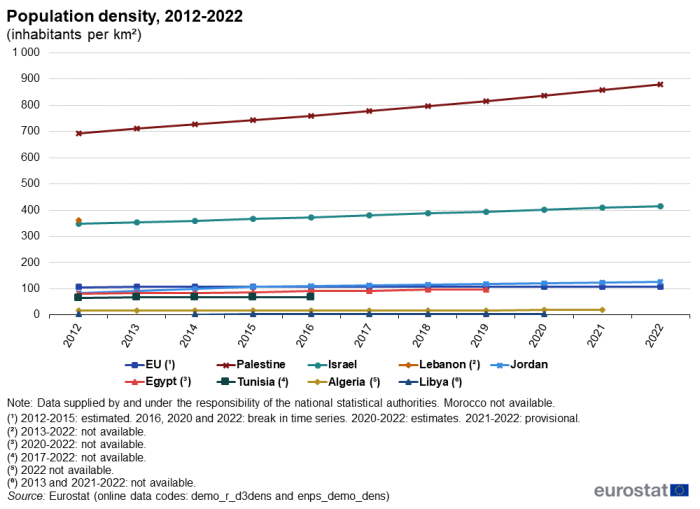
(inhabitants per square kilometre)
Source: Eurostat (demo_r_d3dens) and (enps_demo_dens)
Crude birth and death rates
The crude rate of natural increase is calculated by subtracting the crude death rate from the crude birth rate. A positive result implies that the natural rate of population change is positive and so the population increases, excluding the effect of migrant flows. The data are illustrated in Figure 3.
All the ENP-South countries for which data is available reported crude birth rates that substantially exceeded crude death rates.
In Palestine, natural population growth was 25.5 per thousand inhabitants in 2022. A decade earlier, it was estimated at 28.8 per thousand inhabitants resulting in the highest natural population growth rate in the ENP South region. Algeria saw a natural population growth of 19.2 per thousand inhabitants in 2019 (more recent data not available). In 2012, the corresponding figure was 21.6.
In Libya, natural population growth was 16.1 per thousand inhabitants in 2019 (more recent data not available) and 15.7 in 2012.
In Egypt, natural population growth was 14.1 per thousand inhabitants in 2021 (no 2022 data available) and 25.5 in 2012.
Israel had a natural population growth of 13.6 per thousand inhabitants in 2022 and 16.3 per thousand in 2012.
In Jordan, natural population growth was at 12.1 per thousand inhabitants in 2022 and 21.9 in 2012; nevertheless, for 2022 data the population on 31 December of the previous year was used.
Natural population growth in Morocco was at 10.9 per thousand inhabitants in 2022 and an estimated 13.2 per thousand inhabitants a decade earlier.
Finally, the lowest natural population growth of the ENP-South countries was found in Tunisia, where natural population growth was 4.5 per thousand inhabitants in 2021 (no 2022 data available) and 14.3 per thousand inhabitants in 2012.
There is no data available for Lebanon.
In contrast, the EU reported crude death rates that were higher than crude birth rates in 2022. This resulted therefore in a natural population decrease of -2.8 per thousand inhabitants in 2022, while in 2012 the natural rate of population change had been slightly negative, at -0.1 per thousand inhabitants.
The natural rate of population growth has slowed in all ENP-South countries in the period to 2022, or the most recent year for which data is available, with the exception of Libya. The greatest differences over this period occurred in Egypt, where the recorded slowdown in the rate of natural population growth was 11.4 per thousand inhabitants; in Tunisia and Jordan, where the difference was 9.8 and 9.0 per thousand inhabitants.
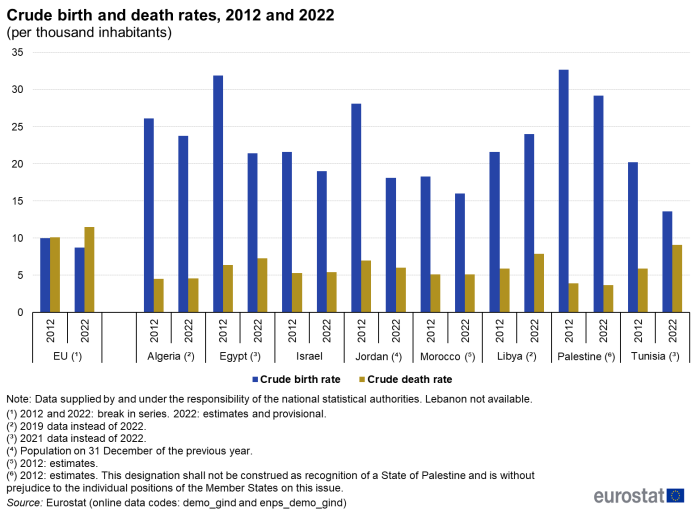
(per thousand persons)
Source: Eurostat (demo_gind) and (enps_demo_gind)
Infant mortality rate
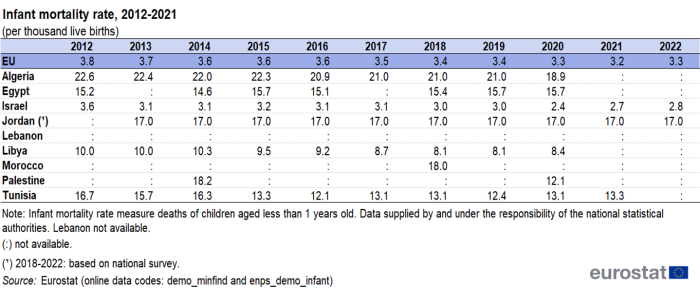
The infant mortality rates presented in Table 3 are defined as the number of deaths of children under one year of age per thousand live births. This indicator can be used to highlight health infrastructures and demography trends within ENP-South countries.
Infant mortality rates fell in all the ENP-South countries over the period 2012-2022 for which data is available, except in Egypt. In some countries the decline was rapid.
The infant mortality rate in Algeria declined from 22.6 per thousand live births in 2012 to 18.9 in 2020 (latest available data), being the highest among the ENP-South region.
In Morocco, data is only available for 2018, when the infant mortality rate was 18.0 per thousand live births.
Jordan’s infant mortality rate was constant between 2013 (no 2012 data available) and 2022, at 17.0 per thousand live births.
Egypt’s infant mortality rate rose marginally from 15.2 per thousand in 2012 to 15.7 per thousand in 2020 (latest available data).
In Tunisia, the decline was from 16.7 in 2012 to 13.3 per thousand live births in 2021 (2022 data not available).
In Palestine, infant mortality fell from 18.2 per thousand live births in 2014 to 12.1 in 2020 (the only available data). This was the sharpest decline among the ENP-South countries.
Libya's infant mortality declined from 10.0 per thousand in 2012 to 8.4 in 2020 (latest available data).
A decline in infant mortality rate from already low rates was recorded in Israel, from 3.6 in 2012 to 2.8 per thousand live births in 2022.
No data available for Lebanon.
The rates for the EU were significantly lower than in most ENP-South countries, with the exception of Israel. EU's infant mortality rate decreased from 3.8 per thousand live births in 2012 to 3.3 per thousand live births in 2022.
(per thousand live births)
Source: Eurostat (demo_minfind) and (enps_demo_infant)
Life expectancy at birth
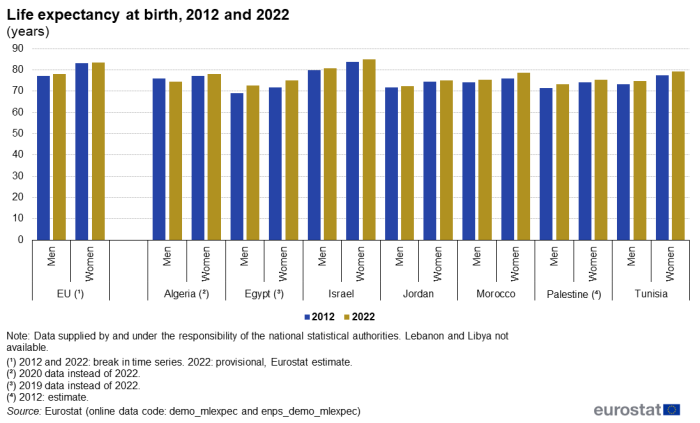
Life expectancy at birth at a certain age is the mean additional number of years that a person of that age can expect to live, if subjected throughout the rest of his or her life to the current mortality conditions. Life expectancy at birth rose rapidly during the last century due to a number of factors, including reductions in infant mortality, rising living standards, improved lifestyles and better education, as well as advances in healthcare and medicine. Data for 2012 and 2022, or the most recent year for which data are available, are illustrated in Figure 4 for men and for women in all the ENP-South countries for which data are available.
There was an increase in life expectancy for women and men in most but not all ENP-South countries over the period. The increase was particularly marked in Egypt: male life expectancy increased from 69.0 years in 2012 to 72.7 years in 2019 (more recent data not available) and female from 71.8 to 75.1 years over the same period.
In Morocco, male life expectancy increased from 74.2 in 2012 to 75.2 years in 2022 and women from 76.0 to 78.6 years.
In Tunisia, men had a life expectancy of 73.3 in 2012 and 74.7 years in 2022 while for women life expectancy increased from 77.3 to 79.3 years over the same period.
In Palestine, men had life expectancy of 71.3 in 2012 (estimated) and 73.2 years in 2022; the corresponding figures for women were 74.1 (estimated) and 75.4 years.
In Israel, male life expectancy increased from an already high 79.9 years to 80.7 years between 2012 and 2022; female life expectancy rose from 83.6 to 84.8 years. These figures are higher than in the EU.
In Algeria, male life expectancy declined from 75.8 years in 2012 to 74.5 years in 2020 (latest available data), while female life expectancy increased from 77.1 to 78.1 years.
In Jordan, male life expectancy increased from 71.6 in 2012 to 72.3 years in 2022, while female life expectancy rose from 74.4 to 75.1 years.
For comparison, in the EU, male life expectancy was 77.1 years in 2012 and an estimated 78.0 years in 2022. Female life expectancy was 83.1 years in 2012 and 83.4 years in 2022. It should be noted that there is a break in series for the EU.
Life expectancy at birth for females is higher than for males both in all the ENP-South countries for which data are available and the EU. In 2022, the gender gap was 4.6 years in Tunisia. This was the biggest gender gap recorded among the ENP-South countries. In 2012 it was 4.0 years.
In Israel, the gender gap was 4.1 years in 2022, up from 3.7 years in 2012.
Algeria and Morocco had similar gender gaps, at 3.6 years (2020 data) and 3.4 years, respectively; they increased by 2.3 and 1.6 years, respectively, compared with 2012.
In Jordan, the gender gap was 2.8 years in 2022, as it was in 2012.
Egypt and Palestine had similar rates with a gender gap of 2.8 years in 2012, respectively; they decreased in 2022 to 2.4 (2019 data) and 2.2 years, respectively.
In comparison, the EU reported a higher gender gap than any of the ENP-South countries, with 6.0 years in 2012 and 5.4 years in 2022. It has to be noted that there is a break in series for the EU.
(years)
Source: Eurostat (demo_mlexpec) and (enps_demo_mlexpec)
School completion rate for primary education
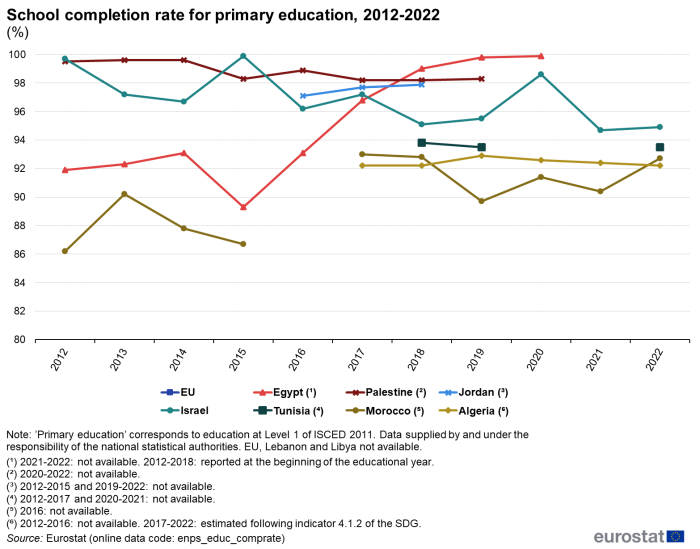
The completion rate of primary education following international standard classification of education (ISCED) measures the share of population aged above 25 years which enrolled and completed primary education. Some populations can be more at risk of education inaccessibility due to political or socio-economic reasons. Completion rate for primary education represents the share of population with basic skills like basic calculus or literacy, learnt during primary education.
In Egypt, there was a significant increase from 91.9 % in 2012 to an almost ideal completion rate of 99.9 % in 2020 (more recent data not available), showcasing substantial improvement in primary education completion. This was the highest increase of the completion rate in the ENP-South region (+8 percentage points (pp) over the period).
For Palestine, the recorded completion rates are very high, around 99.5-99.6 % for 2012 to 2014, with a slight decrease in the following years and standing at 98.3 % in 2019 (latest data available).
Jordan's data, limited to 2016-2018, marginally grew from 97.1 % in 2016 to 97.9% in 2018.
Israel's completion rate fluctuated over the period. Between 2012 and 2014 it decreased from 99.7 % to 96.7 %. In 2015 it increased to an almost ideal completion rate of 99.9 %. Between 2016 and 2020 it ranged between 95.1 % and 98.6 %, while in 2021 it reached its lowest point at 94.7 %. In 2022, the completion rate was 94.9 %, 4.8 pp lower than in 2012, which is the biggest decrease in the region over the period.
Tunisia's completion rate, available only for 2018, 2019 and 2022, ranged between 93.5 % and 93.8 %.
Morocco experienced the second highest growth in its completion rate from the ENP-South region for which data is available. From 86.2 % in 2012 - which coincides with its lowest point – it increased to 92.7 % in 2022 (+6.5 pp over the period); the highest point was 93.0 % in 2017. Morocco's completion rate is one of the lowest from the ENP-South region, for which data is available. This was the case for 2012 to 2015 and 2019 to 2021; in 2017, 2018 and 2022, Algeria had the lowest completion rate from the region.
Algeria's rates are available from 2017 onwards, with a relatively stable trend around 92 % (highest peak at 92.9 % in 2019 and the lowest points at 92.2 % in 2017, 2018 and 2022), indicating a stable situation in primary education completion.
Data for Lebanon, Libya and the EU are not available.
Source: Eurostat (enps_educ_comprate)
Source data for tables and graphs
Data sources
The data for ENP-South countries are supplied by and under the responsibility of the national statistical authorities of each country on a voluntary basis. The data mainly result from an annual data collection cycle that has been established by Eurostat. Cooperation with Syria is suspended since 2011. These statistics are available free-of-charge on Eurostat's website, together with a range of different indicators covering most socio-economic areas.
Eurostat provides a wide range of demographic data, including statistics on population at national and regional level by sex or age, as well as for various demographic events influencing the size, the structure and the specific characteristics of these populations, like natural population change or mortality rate. Eurostat collects data from EU Member States and other countries participating in its demography data collection exercise (including the ENP-South countries) concerning the population as of 1 January each year.
Context
Statistics on population change and its structure are increasingly used to support policymaking and provide an opportunity to monitor demographic behaviour within an economic, social and cultural context. Demographic trends present both opportunities and challenges and monitoring them with data and statistics provides insightful observations for relevant analysis. The use of internationally accepted concepts and definitions permits an analysis of different economies, such as the interdependencies between the economies of the EU Member States, or a comparison between the EU and non-member countries.
The European Neighbourhood Policy (ENP), launched in 2003 and developed throughout 2004, supports and fosters stability, security and prosperity in the EU's neighbourhood. The ENP was revised in 2015. The main principles of the revised policy are a tailored approach to partner countries; flexibility; joint ownership; greater involvement of EU member states and shared responsibility. The ENP aims to deepen engagement with civil society and social partners. It offers partner countries greater access to the EU's market and regulatory framework, standards and internal agencies and programmes.
The Joint Communication on Renewed Partnership with the Southern Neighbourhood – A new Agenda for the Mediterranean, accompanied by an Economic and Investment Plan for the Southern neighbours, of 9 February 2021 further guides cooperation with the ENP-South countries. Additional information on the policy context of the ENP is provided on the website of Directorate-General European Neighbourhood Policy and Enlargement Negotiations (DG NEAR).
In cooperation with its ENP partners, Eurostat has the responsibility to promote and implement the use of European and internationally recognised standards and methodology for the production of statistics, necessary for designing and monitoring policies in various areas. Eurostat manages and coordinates EU efforts to increase the capacity of the ENP countries to develop, produce and disseminate good quality data according to European and international standards.
Reliable and comparable data are essential for evidence-based decision-making. They are needed to monitor the implementation of the agreements between the EU and the ENP-South countries, the impact of policy interventions and the reaching of the Sustainable Development Goals (SDGs).
The main objective of Euro-Mediterranean cooperation in statistics is to enable the production and dissemination of reliable and comparable data, in line with European and international norms and standards.
The EU has been supporting statistical capacity building in the region for a number of years through bilateral and regional activities to strengthen statistical capacity. This takes the form of technical assistance to partner countries' national statistical authorities through targeted assistance programmes, such as the MEDSTAT programme which provides capacity building support in the form of activities such as training courses, working groups and workshops, exchange of best practice and the transfer of statistical know-how.
Notes
- ↑ This designation shall not be construed as recognition of a State of Palestine and is without prejudice to the individual positions of the Member States on this issue.
Explore further
Other articles
- All articles on non-EU countries
- European Neighbourhood Policy countries — statistical overview — online publication
- Statistical cooperation — online publication
- All articles on population
Thematic section
Publications
Books
Factsheets
- Basic figures on the European Neighbourhood Policy-South countries — 2023 edition
- Statistics for a green future — factsheets on European Neighbourhood policy-South Countries — 2022 edition
- Basic figures on the European Neighbourhood Policy-South countries — 2022 edition
- Basic figures on the European Neighbourhood Policy-South countries — 2021 edition
Leaflets
- Basic figures on the European Neighbourhood Policy — South countries — 2020 edition
- Basic figures on the European Neighbourhood Policy — South countries — 2019 edition
- Labour force statistics in Enlargement and ENP‑South countries — 2019 edition
- Basic figures on the European Neighbourhood Policy — South countries — 2018 edition
- Energy and transport statistics for the European neighbourhood policy-South countries — 2018 edition
- Basic figures on the European Neighbourhood Policy — South countries — 2016 edition
- Labour force statistics for the Mediterranean region — 2016 edition
- Basic figures on the European Neighbourhood Policy — South countries — 2015 edition
Methodology
- Southern European Neighbourhood Policy countries (ENP-South) (enps) (ESMS metadata file — enps_esms)
- Population (demo_pop) (ESMS metadata file — demo_pop_esms)
External links
- Directorate-General European Neighbourhood Policy and Enlargement Negotiations (DG NEAR) — Southern Neighbourhood
- Directorate-General European Neighbourhood Policy and Enlargement Negotiations (DG NEAR) — The EU and its Southern Neighbourhood Factsheet (2021)
- European External Action Service — European Neighbourhood Policy
- European External Action Service — Renewed partnership with the Southern Neighbourhood - A new agenda for the Mediterranean
- Joint Communication JOIN(2021) 2 final: Renewed Partnership with the Southern Neighbourhood – A new Agenda for the Mediterranean
- Joint Staff Working Document SWD(2021) 23 final: Renewed Partnership with the Southern Neighbourhood – Economic and Investment Plan for the Southern Neighbours, accompanying the document JOIN(2021) 2 final
- Economic and Investment Plan for the Southern neighbours
- European External Action Service — Middle South and North Africa (MENA)
- European External Action Service — Union for the Mediterranean (UfM) and the EU
- MEDSTAT V – Euro Mediterranean Statistical Cooperation

