Key figures for European Neighbourhood East countries
Data extracted in March 2024.
Planned article update: March 2025.
Highlights
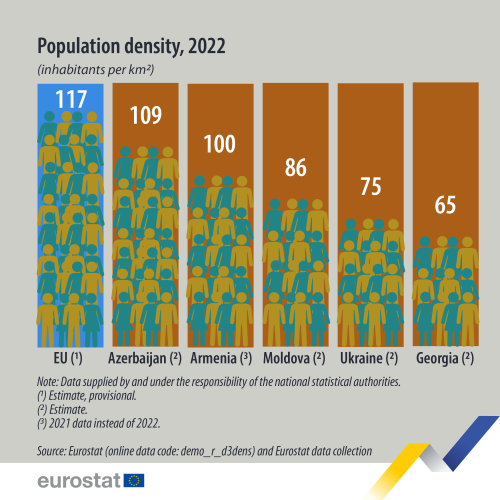
In 2022, the population density of the European Neighbourhood Policy-East countries Armenia, Azerbaijan, Georgia, Moldova and Ukraine ranged from 65 inhabitants per square kilometers to 117 in Azerbaijan while it was 109 in the EU.
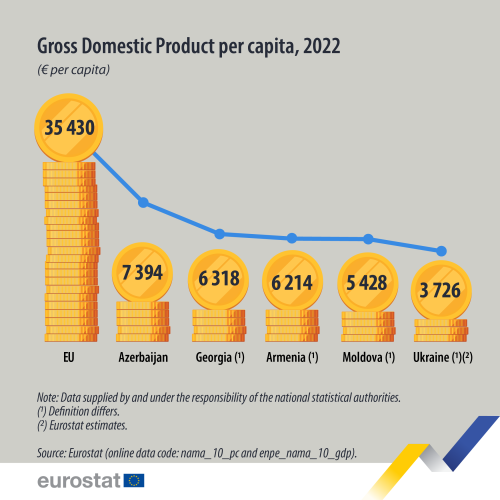
GDP per capita in the European Neighbourhood Policy-East countries was between €3 726 and €7 394 in 2022 while it was €35 430 in the EU.
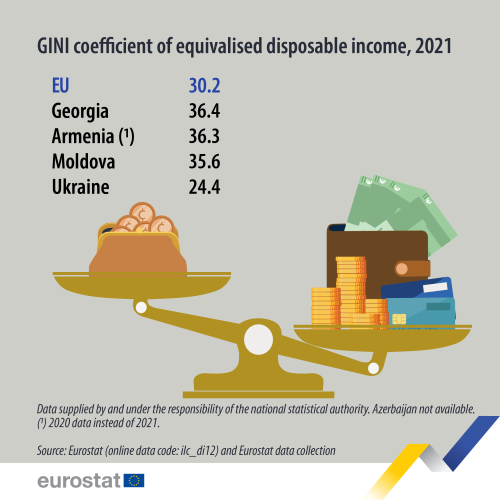
Ukraine had the lowest GINI coefficient of equivalised disposable income among the European Neighbourhood Policy-East countries for which data was available in 2021, with 24.4 while Georgia had the highest at 36.4. In comparison, EU was at 30.2.
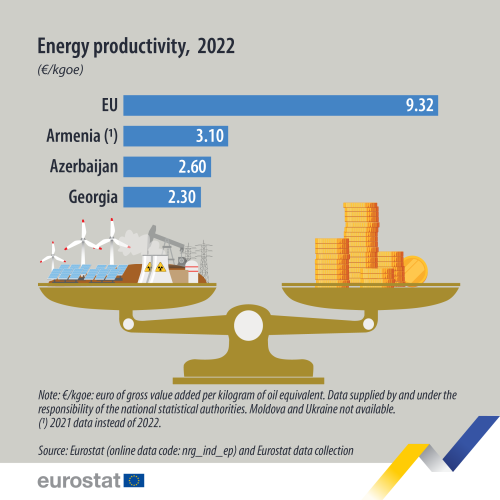
Energy productivity among European Neighbourhood Policy-East countries for which data is available ranged between €2.3 per kilogramme of oil equivalent in Georgia in 2022 and €3.1 in Armenia in 2021, while it was at €9.3 in 2022 in the EU.
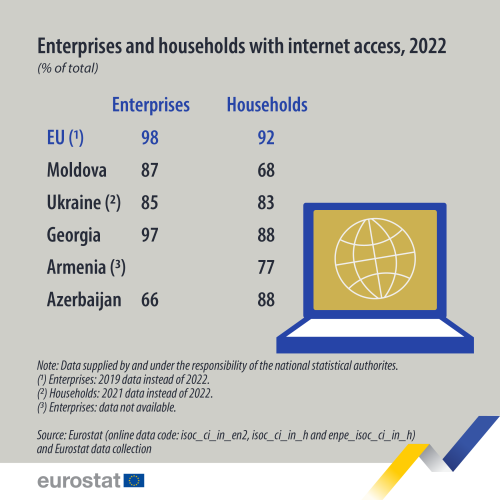
In 2022, 88 % of the households in the European Neighbourhood Policy-East countries Georgia and Azerbaijan had access to the internet. This was close to the EU average of 92 %.
This article is part of an online publication. It presents statistics on five main topics to create an overview for five European Neighbourhood Policy-East (ENP-East) countries, namely, Moldova, Georgia, Ukraine, Armenia and Azerbaijan, compared with the European Union (EU). Moldova, Georgia and Ukraine are also candidate countries, the European Council granting Moldova and Ukraine candidate status on 23 June 2022 and Georgia on 14 December 2023. This article does not contain any data on Belarus, as statistical cooperation with Belarus has been suspended as of March 2022.
Data shown for Georgia exclude the regions of Abkhazia and South Ossetia over which the government of Georgia does not exercise control. The data managed by the National Bureau of Statistics of the Republic of Moldova does not include data from Transnistria over which the government of the Republic of Moldova does not exercise control. Since 2014, data for Ukraine generally exclude the illegally annexed Autonomous Republic of Crimea and the City of Sevastopol and the territories which are not under control of the Ukrainian government. Data on Ukraine for the year 2022 is limited due to exemption under the martial law from mandatory data submission by the reporting units to the State Statistics Service of Ukraine, effective as of 3 March 2022, following Russia's war of aggression against Ukraine.
This article presents, among others: statistics on population density, gross domestic product (GDP), measured in € per capita; inequality of disposable income measured by GINI coefficient, energy productivity expressed in gross value added (GVA) per kilogram of oil equivalent (kgoe) and internet access of households and enterprises. The indicators presented have been selected based on the importance of the policy areas and social issues they inform, as well as the availability of data.
Full article
Population density
Data on population density, measured in inhabitants per square kilometre, is illustrated in Figure 1 for the ENP-East countries and compared with the EU.
In 2022, Azerbaijan had the highest population density among the ENP-East countries, estimated at 117 inhabitants per km2, and was also the only ENP-East country with a population density higher than the 109 inhabitants per km2 in the EU. Armenia followed, with 100 inhabitants per km2 (2021 data instead of 2022), while Moldova was estimated at 86, Ukraine at 75, and Georgia at 65, just over half of Azerbaijan's density.
(inhabitants per km2)
Source: Eurostat (demo_r_d3dens) and Eurostat data collection.
Gross domestic product (GDP) per capita
Analysis of GDP per capita (per person) removes the influence of the population size, making comparisons between different countries easier and more relevant. As a result, GDP per capita is a broad economic indicator that may be used for a basic analysis of living standards.
As shown in Figure 2, the highest GDP per capita among the ENP-East countries was recorded in Azerbaijan, at €7 394 in 2022. This represented slightly more than one fifth of the EU value which was at €35 430 per capita. In Georgia, GDP per capita was measured at €6 318, in Armenia at €6 214, in Moldova at €5 428, and in Ukraine it was estimated at €3 726, almost ten times lower than the EU value.
The GDP per capita values in the ENP-East countries were still relatively similar to each other, with the highest value in 2022 close to double that of the lowest one. In comparison, in 2022 the GDP in € per capita amongst the EU Member States ranged from €118 310 in Luxembourg to €13 270 in Bulgaria, with the highest value almost nine times higher than the lowest one.
(€ per capita)
Source: Eurostat (nama_10_pc) and (enpe_nama_10_gdp)
GINI coefficient
The GINI coefficient, presented in Figure 3, is a measure of income inequality within a population, commonly used to assess disparities in wealth distribution. It quantifies the extent to which the distribution of income or wealth among individuals or households deviates from perfect equality, with higher values indicating greater inequality.
Source: Eurostat (ilc_di12) and Eurostat data collection.
The income inequality measured by the GINI coefficient was relatively low in the EU, at 30.2 in 2021. In Georgia, the GINI coefficient was at 36.4 in 2021, suggesting a slightly higher inequality in wealth distribution in the country than in the EU. The GINI coefficient is not available for Armenia in 2021, but it was 36.3 in 2020, only 0.1 point lower than the 2021 value for Georgia. In 2021, Moldova had a GINI coefficient of 35.6, while Ukraine had a GINI coefficient of 24.4, close to 20 % lower than the EU GINI coefficient. This value suggests a relatively equal distribution of wealth within the population of Ukraine compared with the other ENP-East countries. Data for Azerbaijan is not available.
Energy productivity
Figure 4 presents the energy productivity, expressed in euro of gross value added (GVA) per kg of oil equivalent (€/kgoe), for the EU, Georgia, Armenia and Azerbaijan in 2022. Data for Moldova and Ukraine are not available. Energy productivity is an economic indicator that measures the amount of economic output achieved per unit of energy consumption, and higher values indicate more efficient use of energy in creating economic value.
Armenia's energy productivity is the highest among the ENP-East countries for which data is available, with €3.1 per kgoe in 2021 (2022 data not available). Azerbaijan's energy productivity followed with €2.6 per kgoe in 2022. Georgia had the lowest energy productivity within this group of countries, with €2.3 per kgoe in 2022.
The EU energy productivity was far above that of the ENP-East countries in 2022, with €9.3 per kgoe. This may suggest a higher energy efficiency in the EU or reflect that a larger share of total gross value added is generated by activities that require less energy. Differences in price levels of output may also influence the calculation, although higher prices for output is generally to a certain extent counterbalanced by higher prices of raw materials in the calculation of GVA.
The data presented reflect the energy efficiency and economic structures of these economies, and can be influenced by many factors, including technological advancements, shifts in the industrial base and energy policy.
(€/kgoe)
Source: Eurostat (nrg_ind_ep) and Eurostat data collection.
Enterprises and households with internet access
Figure 5 presents the shares of internet access in enterprises of more than 10 employees and households located in the ENP-East countries and the EU.
In 2022, the share of households with access to the internet in Moldova was the lowest among the ENP-East countries, with 68 %. In comparison, 87 % of enterprises had an internet access in Moldova. In Armenia, 77 % of the households had internet access in 2022. Data on internet access for enterprises is not available for Armenia. In Ukraine, 83 % of households had internet access in 2021 (2022 data not available), while this applied to 85 % of enterprises in 2022. Georgia had the highest share of enterprises with internet access among the ENP-East countries, with 97 %. For households, 88 % had internet access. Azerbaijan was the only country for which the share of internet access was lower for enterprises, at 66 %, than for households, at 88 %. This was the lowest share of enterprises with access to the internet among the ENP-East countries (data for Armenia not available).
In the EU, internet access was at 98 % for enterprises in 2019 (latest data available) and 92 % for households in 2022, reflecting a relatively high internet connectivity.
(% of total)
Source: Eurostat (isoc_ci_in_en2), (isoc_ci_in_h) and Eurostat data collection.
Source data for tables and graphs
Data sources
The data for ENP-East countries are supplied by and under the responsibility of the national statistical authorities of each country on a voluntary basis. The data result from an annual data collection cycle that has been established by Eurostat. These statistics are available free-of-charge on Eurostat's website, together with a range of additional indicators for ENP-East countries covering most socio-economic topics.
Eurostat provides a wide range of demographic data, including statistics on populations at national and regional level, as well as for various demographic events influencing the size, the structure and the specific characteristics of these populations. Eurostat collects data from EU countries and other countries participating in its demography data collection exercise, including the ENP-East countries. The recommended definition is the 'usual resident population' and represents the number of inhabitants on 1 January of the year in question (or, in some cases, on 31 December of the previous year).
The European system of national and regional accounts (ESA) provides the methodology for national accounts in the EU. The national accounts data presented in this article for ENP-East countries were generally collected according to the 2008 System of national accounts (2008 SNA). The European Standard for National Account, ESA 2010, is consistent with the 2008 SNA.
EU statistics on income and living conditions (EU-SILC) is an instrument that aims to collect timely and comparable data on income, poverty, social inclusion and living conditions in the EU, the EU countries and a number of other European countries. The data are generally collected for private households and household members. In the ENP-East countries, statistics on income and living conditions are collected through household surveys such as income and living conditions surveys, household budget surveys, labour force surveys or similar, based on internationally agreed methodologies and recommendations
For EU statistics, the main legislation covering the collection of statistics in relation to energy quantities is Regulation (EC) No 1099/2008 of the European Parliament and of the Council of 22 October 2008 on energy statistics. Since its adoption, it has been amended several times and a consolidated version is available. A summary of the relevant legislation is also available on Eurostat's website, under 'Legislation' on the dedicated section for Energy statistics.
Eurostat's survey on ICT usage in households and by individuals is an annual survey used to benchmark ICT-driven developments. Eurostat's survey on ICT usage in enterprises is also an annual survey and generally covers enterprises with at least 10 persons employed. Note that the activity coverage excludes financial and insurance activities.
Tables in this article use the following notation:
| Value in italics | data value is forecasted, provisional or estimated and is therefore likely to change; |
| : | not available, confidential, or unreliable value; |
| – | not applicable. |
Context
On 2 July 2021, the European Commission and the EU High Representative for Foreign Affairs and Security Policy presented the Eastern Partnership: a Renewed Agenda for cooperation with the EU's Eastern partners. This agenda is based on the five long-term objectives, with resilience at its core, as defined for the future of the Eastern Partnership (EaP) in the Joint Communication Eastern Partnership policy beyond 2020: Reinforcing Resilience – an Eastern Partnership that delivers for all in March 2020. It is further elaborated in the Joint Staff Working Document Recovery, resilience and reform: post 2020 Eastern Partnership priorities, amongst others defining the 'Top Ten Targets for 2025'. The Eastern Partnership's agenda for recovery, resilience and reform is underpinned by an 'Economic and Investment Plan for the Eastern Partnership (EaP): Investing in resilient and competitive economies and societies' (Annex I of the Joint Staff Working Document). More detailed overviews are given in a Factsheet on the Eastern Partnership Joint Communication, presenting the policy objectives and the specific priorities, as well as in a Factsheet on EU-Eastern Neighbourhood flagship projects 2023-2024.
The Joint Declaration of the Eastern Partnership Summit 'Recovery, Resilience and Reform' of 15 December 2021, reaffirmed the strong commitment to a strategic, ambitious and forward-looking Eastern Partnership.
At the Eastern Partnership Foreign Affairs Ministerial meeting of 11 December 2023, the EU, member states and partners declared that they will step up their efforts to implement the Eastern Partnership’s agenda for recovery, resilience and reform, as well as tackling challenges related to the ongoing consequences of the Russian war of aggression against Ukraine for the entire region.
In cooperation with its ENP partners, Eurostat has the responsibility 'to promote and implement the use of European and internationally recognised standards and methodology for the production of statistics, necessary for designing and monitoring policies in important areas'. Eurostat manages and coordinates EU efforts to increase the capacity of the ENP countries to develop, produce and disseminate good quality data according to European and international standards. Additional information on the policy context of the ENP is provided on the website of Directorate-General European Neighbourhood Policy and Enlargement Negotiations (NEAR).
Direct access to
- All articles on non-EU countries
- European Neighbourhood Policy countries — statistical overview — online publication
- Statistical cooperation — online publication
- All articles on the information society and use of ICT
Books
Factsheets
- Basic figures on the European Neighbourhood Policy-East countries — 2023 edition
- Basic figures on the European Neighbourhood Policy-East countries — 2022 edition
- Basic figures on the European Neighbourhood Policy-East countries — 2021 edition
Leaflets
- Basic figures on the European Neighbourhood Policy — East countries — 2020 edition
- Basic figures on the European Neighbourhood Policy — East countries — 2019 edition
- Basic figures on the European Neighbourhood Policy — East countries — 2018 edition
- Basic figures on the European Neighbourhood Policy — East countries — 2016 edition
- Basic figures on the European Neighbourhood Policy — East countries — 2015 edition
- Basic figures on the European Neighbourhood Policy — East countries — 2014 edition
- International trade for the European Neighbourhood Policy — East countries — 2016 edition
- European Neighbourhood Policy-East countries — Statistics on living conditions — 2015 edition
- European Neighbourhood Policy — East countries — Key economic statistics — 2014 edition
- European Neighbourhood Policy — East countries — Labour market statistics — 2014 edition
- European Neighbourhood Policy — East countries — Youth statistics — 2014 edition
- Population and social conditions (enpe_pop)
- Economy and finance (enpe_ecf)
- National accounts (enpe_na)
- GDP, main aggregates and economic indicators (enpe_nama_gdp)
- National accounts (enpe_na)
- Main GDP aggregates (nama_10_ma)
- Population and social conditions (enpe_pop)
- Living conditions (enpe_livcon)
- Income distribution (enpe_incom)
- Living conditions (enpe_livcon)
- ICT usage in households and by individuals (isoc_i)
- ICT usage in enterprises (isoc_e)
- Eastern European Neighbourhood Policy countries (ENP-East) (ESMS metadata file — enpe_esms)
- European External Action Service — European Neighbourhood Policy
- European External Action Service — European Neighbourhood Policy
- Joint Communication JOIN(2020) 7 final: Eastern Partnership policy beyond 2020: Reinforcing Resilience - an Eastern Partnership that delivers for all (18 March 2020)
- Joint Staff Working Document SWD(2021) 186 final: Recovery, resilience and reform: post 2020 Eastern Partnership priorities (2 July 2021)
- Joint Declaration of the Eastern Partnership Summit: 'Recovery, Resilience and Reform' (15 December 2021)
- Directorate-General for Economic and Financial Affairs — Stability and Growth Pact
- European Commission — European semester