Archive:Agri-environmental indicator - intensification - extensification
- Data from 2017. Most recent data: Further Eurostat information, Main tables and Database. Planned article update: September 2019.
This article provides a fact sheet of the European Union (EU) agri-environmental indicator intensification/extensification. It consists of an overview of recent data, complemented by all information on definitions, measurement methods and context needed to interpret them correctly. The intensification/extensification article is part of a set of similar fact sheets providing a complete picture of the state of the agri-environmental indicators in the EU.
The intensity of a farm can be defined as the level of inputs used by the farm per unit of factor of production (in general land). Intensification is defined as the increase in farm intensity, while the extensification describes the opposite trends.
Main indicator:
- Trend in the shares of the agricultural area managed by low, medium and high intensity farm.
Supporting indicator:
- Average inputs expenditures per hectare in constant input prices.
Indicators are broken down by EU group, Member States, and type of farming [1].
Main statistical findings
Key messages
- In the EU-15, there was a small but clear trend towards extensification[2] from 2004 to 2007, whereas there was no clear trend afterwards. For the EU-12 from 2004 to 2007 there was an intensification process, whereas from 2008 to 2013 a more clear extensification trend.
- The trend by Member State can be significantly different from the average of its EU-group (EU-15 or EU-12). In 11 Member States the trend was more or less towards extensification over the period studied. On the other hand, intensification was identified in 7 Member States.
- The average inputs' expenditures per hectare are strongly linked to the type of farming: specialist granivore farms have on average the highest input levels, whereas mixed cropping farms and specialist field crops farms have the lowest input levels. The trend (intensification or extensification) is explained more by the EU-group or country, than by the type of farming.
Assessment
The indicator is studied by:
- EU group (EU-15 or EU-12)
- Member State
- type of farming [3].
The detailed results are annexed in separate excel file. The fact sheet presents the main results, and the series of tables/graphs provide an overall view of the situation. They show information on the main indicator over the period studied, as a trend or in a specific year. Yet, to properly interpret and qualify the trends for the main indicator, it is necessary to look at the average level of intensity in the country/region. Therefore information on the sub-indicator, average level of intensity (average inputs expenditure per hectare in 2010 constant input prices, in €/ha), is presented where relevant.
It should be noted that given the availability of data at the time of preparing this fact sheet, the period studied was 2004-2013 for all countries, except:
- for Bulgaria and Romania: 2007-2013 - for Croatia: only 2013, therefore it was not possible to assess a trend at this stage.
Analysis at EU group level
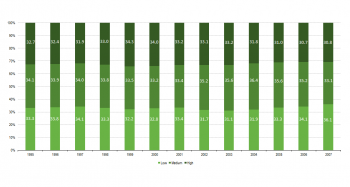
Overall for the EU-15, the shares of UAA managed by low, medium and high intensity farms did not change radically during the period studied (Figure 1). From 2004 until 2008 the share of UAA managed by high intensity farms decreased, very slightly but steadily, from 45% to 42%. From 2009 the share has fluctuated between 43% and 45%, and was 44% in 2013. The share of UAA managed by low intensity farms follows a similar dynamic. It increased slightly from 2004 to 2008 (from 26% to 30%) followed by positive and negative variations over the period. It again reached 30% in 2013. The share of UAA managed by medium intensity farms was more stable over time; varying by about 1 percentage point from one year to another. The share was 29% in 2004, decreasing to 25% in 2012 and increasing to 26% in 2013. Therefore in the EU-15, the trend towards extensification is very slight but clear from 2004 to 2007, whereas there is no clear trend afterwards.
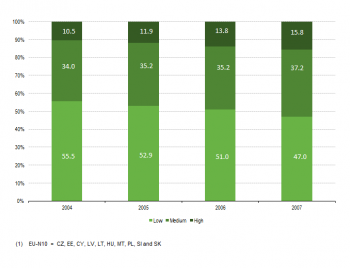
The trend is different for the EU-12: the share of UAA managed by low intensity farms decreased from 38% in 2004 to 35% in 2007 (Figure 2). This was followed by an increase to 44% in 2008 (+9 percentage points in one year), and even 50% in 2011; before declined to 47% in 2013. The share of UAA managed by high intensity farms increased from 22% in 2004 to 28% in 2006, then decreased gradually to 18% in 2013. The share managed by medium intensity farms decreased steadily from 40% in 2004 to 34% in 2011, followed by an increase to 36% in 2013. Therefore, from 2004 to 2007 there is an intensification process, whereas from 2008 to 2013 a more clear extensification trend is seen.
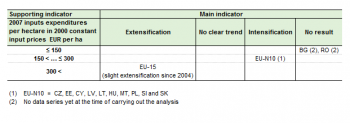
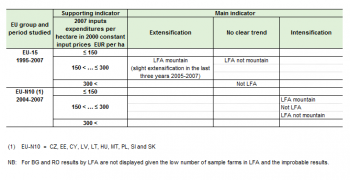
However, the trend should be put in perspective by a measure of the absolute level of "intensity", as mentioned above. In this fact sheet, the inputs expenditures per hectare in 2010 constant input prices (€/ha) are used for this purpose. Table 1 summarizes the results for the EU groups. It shows that in both in EU-15 and EU-12, for the period 2007-2013 no clear trend was visible. As has been described above, there were fluctuations and only shorter periods of clear trends towards intensification or extensification. What it is more significantly different between the two EU groups is the level of the inputs expenditure. For the EU-12 the average is between 150 and 300 €/ha, while for the EU-15 it is higher than 300 €/ha.
Analysis at Member State level
In 2013, between 60% and 80% of the agricultural area of Belgium, Denmark, Germany, Malta, and the Netherlands was managed by high intensity farms, whereas the countries with the highest percentage of agricultural area managed by low intensity farms were Lithuania, Latvia, Portugal and Romania. Mainly medium intensity farms were found in the Czech Republic, Estonia, Hungary and Slovakia with a share of between 40% and 50% of the agricultural area.
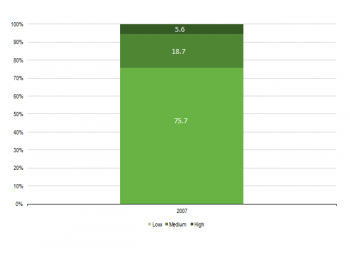
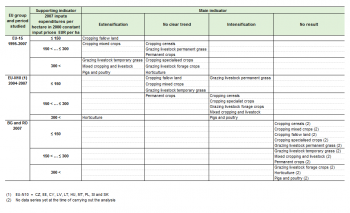
The trend for individual Member States can be significantly different from their EU group average. Extensification (decrease of UAA share managed by highly intensive farms and increase of UAA share managed by low input farms) is observed in 11 Member States over the period studied i.e. 2004-2013 (see Table 2). During this period this trend is particularly clear in Romania, with an increase of 31.5 percentage points of the UAA share managed by low intensity farms, but also in Hungary, Finland, and Poland (increases by around 10 percentage points). In the Czech Republic there was a strong process of intensification, with an increase of almost 18 percentage point of the UAA share managed by high intensity farms, followed by Slovakia and Slovenia, with an increase between 8 and 9 percentage points. In the other countries changes in the share of the UAA managed by low or high intensity farms sometimes went in the same direction, both shares increasing or decreasing, were stable or showed a slight fluctuation so that it was not possible to identify a clear trend.
However, to properly interpret the trend in each country, it is necessary also to have in mind the range of the "intensity" level (Table 2).
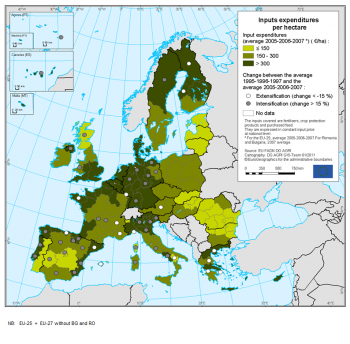
Obviously the average level may hide big differences between regions. Map 1 shows the regional average level of inputs expenditures per hectare and the trend, when available and clearly identifiable. For the map, the trend is assessed by comparing averages in given years (2007-2009 vs 2011-2013), and therefore the overall picture may look a bit different.
Analysis by type of farming
In the EU-28, the share of agricultural area manged by high intensity farms during the period 2004-2013 showed a stable trend for most of the types of farming, with the exception of specialist horticultural farms (Figure 3a). In particular, there is a slight decrease of the main indicator for all the types of farming from 2007 to 2008, followed by a slight increase in 2009. As regards the share of agricultural area manged by medium intensity farms, a fluctuating trend over the period can be observed (Figure 3b), with a particularly dynamic trend for mixed livestock farms and specialist horticultural farms. For intensity farms (Figure 3c) there is an increasing trend of the area managed for several types of farms, including for specialist horticultural farms (thereby confirming an extensification process as showed in Figure 3a), and for mixed livestock farms and specialist permanent crops.
In terms of inputs expenditure by type of farms, Figure 4 shows the relationship between the variation in the inputs expenditure - averages 2007-2009 and 2011-2013 - within the EU-15 group and the EU-12 group for the different farm type, providing at the same time the information on the 2011-2013 average value of expenditure (expressed by the size of the spheres). On average, the specialist granivore farms and the horticultural farms have the highest values of expenditure , whereas mixed cropping farms and specialist field crops farms have the lowest ones.
The variation between the two periods 2007-2009 and 2011-2013 are in general more marked for the EU-12 rather than for the EU-15. For the horticultural farms, there is a decrease in inputs expenditure for both the EU-groups, as well as for the permanent crops farms and the mixed livestock farms. On the opposite, granivore farms register an increase in inputs expenditure in both EU-15 and EU-12.
Data sources and availability
Indicator definition
Intensification is used to describe an increase in farm intensity. It is a complex concept involving monitoring the trend over time of inputs for which consistent data are not systematically available. Therefore the concept had to be simplified for the purpose of this indicator.
In this fact sheet, intensity is estimated by dividing input expenditures per hectare by the input price indexes in the year and country in question. Intensification/extensification is measured by the trend in the shares of the agricultural area managed by low, medium and high intensity farms. The inputs taken into account are fertilisers, pesticides and purchased feed. It allows covering both crop and livestock productions. Water use could not be included because there is no consistent information available. Energy use is not included since it is addressed in another specific AEI and it would have been difficult to interpret the results.
Measurements
Main indicator:
- Trend in the shares of the agricultural area managed by low, medium and high intensity farm.
Supporting indicator:
- Average inputs expenditures per hectare in constant input prices.
Indicators are broken down by EU group, Member States, type of farming and less favoured area (LFA). Please note that for the purpose of this indicator, the type of farming refers to the typology developed under the IRENA project as it is more adapted to study environmental issues than the general typology.
Links with other indicators
The agri-environmental indicator "Intensification/extensification" is linked to the following other indicators:
- AEI 05 - Mineral fertiliser consumption
- AEI 06 - Consumption of pesticides
- AEI 10.1 - Cropping patterns
- AEI 10.2 - Livestock patterns
- AEI 11.1 - Soil cover
- AEI 11.2 - Tillage practices
- AEI 11.3 - Manure storage
- AEI 15 - Gross nitrogen balance
- AEI 16 - Risk of pollution by phosphorus
- AEI 17 - Pesticide risk
- AEI 18 - Ammonia emissions
Data used and methodology
The main data source for this indicator is the Farm Accountancy Data Network (FADN). FADN is a European system of sample surveys conducted every year to collect structural and accountancy data on farms, with the aim of evaluating the impact of the Common Agricultural Policy. It covers only farms above a minimum size. In 2013, FADN farms represented 47 % of the farm population in the Farm Structure Survey , but 94 % of Utilised Agricultural Area. The rules applied aim to provide representative data from three dimensions: region, economic size and type of farming. FADN is the only source of micro-economic data that is harmonised, i.e. applies the same book-keeping principles in all EU countries.
The complementary source used for this indicator is the database on price indices of the means of agricultural production from Eurostat. For further information on this database:
fix link
Methodology on input levels per ha
Farms are classified into intensity categories according to an estimate of inputs' volume per hectare of Utilised Agricultural Area (UAA). The inputs considered are fertilisers, pesticides and other crop protections and purchased feed. It allows covering both crop and livestock productions.
Fertilisers' expenditure (purchased fertilisers and soil improvers[4] ) is divided by the fertilisers' price index in the country of the same year in order to estimate the volume used. Similarly, crop protection expenditure (plant protection products, traps and baits, bird scarers, anti-hail shells, frost protection[5]) is divided by the pesticides' price index in the country of the same year. Purchased feed cost[6] is also divided by the feed price index in the country of the same year. The indices used are available from the Eurostat database[7] . The result is thus expressed in "constant 2010 inputs prices € per ha". The method allows not only deducting inflation, but also the inputs' prices fluctuation. Thus it allows approaching the trend in volume of inputs used per hectare. However, it does not capture differences of inputs' prices between countries and the differences of prices within each category of inputs (for example between a pesticide A and a pesticide B). Therefore it does not give the exact volume of inputs used for a year in a country.
But to properly interpret and qualify the trends for the main indicator, it is necessary to look at the average level of intensity in the country/region. Intensification in a country with very low intensity does not mean the same for the environment than intensification in a country with high intensity. That is the purpose of the supporting indicator, average inputs expenditures per hectare in constant input prices. It is not the ideal measurement of intensity; however it is the best estimate that we can obtain from the available data for now.
It should be underlined that Member States do not all have euro and that changes in the exchange rate may explain some differences between Member States.
For the denominator, the total Utilised Agricultural Area (UAA) has been chosen, which does not include common land. The area of common land used by the farm is actually very difficult to estimate. This can have an impact on the results for Spain, Greece, the United Kingdom and Bulgaria in particular. The area used by the farm may be underestimated. It means that the ratio of inputs per hectare may be overestimated and therefore the share of area managed by medium and high intensity farms in these countries. At farm level, when the UAA is null, which can happen in certain very intensive livestock farms with only buildings and no agricultural area, inputs are divided by the other area of the holding[8] (ground occupied by buildings).
Finally it should be underlined that the potential environmental damage is not always proportionate to the volume or expenditures of inputs: for example, one litre of a certain pesticide might be more damaging for the environment than 5 litres of another one. Therefore the results should be interpreted with care.
Classification of farms according to their intensity
Each farm is classified according to the level of input use per hectare. The thresholds have been set in such a way that the EU-15 UAA is equally divided into the three categories for the first year of the analysis, which is 2004 for the EU-15. If it is higher than 295 constant €/ha, the farm is qualified as "high". When it is below 125 constant €/ha, it is classified as "low". Otherwise, it is "medium". These levels should not be interpreted to represent the boundaries of what is extensive and intensive farming. They are only set in order to study the trends of shares in UAA managed by farms of different categories of intensity. The same thresholds are used for each EU group, country, and type of farming and it allows comparing the trends between them.
Typology of farms
For this fact sheet, we have we have used the typology of farms as in the FADN Types of Farming (General TF) under Regulation (EC) 1242/2008. It is described below:
General TF
- Specialist field crops
- Specialist horticulture
- Specialist permanent Crops
- Specialist grazing livestock
- Specialist granivore
- Mixed cropping
- Mixed livestock
- Mixed crops-livestock
Context
Intensification is an important restructuring process that has characterised European agriculture for several decades[9]. Intensification is in here understood as an increase in agricultural input use per hectare of land, which usually leads to an increase in the level of production per unit of land, livestock unit and agricultural working unit. Intensification often goes together with an increase in efficiency in the use of inputs during the agricultural production process. If the yield increase grows more than the use of fertilisers, pesticides and water for irrigation then improved crop varieties, better management and technological development have made the utilisation of inputs more efficient. However, intensification may nevertheless result in negative externalities to the environment.
The proposed indicators are used as a “proxy” of agricultural intensification. The total value of inputs (in this analysis the costs of fertilisers, pesticides, and feedstuff) in constant national input prices purchased by the holding as a whole is only a proxy indicator, in absence of data about trends in the volumes of inputs used in specific production activities undertaken by a holding. Furthermore, the overall “intensity” of a farming system is the result of very diverse parameters including a wide range of farm (and field) management practices. Thus, for instance, the “intensity” of a livestock farm is the result of the input use (fertilisers, concentrate feed, etc.), livestock patterns (the type of animal reared), cropping patterns (the composition of the forage system, pastures or maize), stocking density, and management practices (waste, use of manure…). Some of these processes are covered by other indicators.
The process of intensification has been driven by several factors. In the period just after the Second World War an important driver has been the decline of the agricultural labour force that stimulated the introduction of labour saving technologies and continuous technological development.[10][11][12][13] In the last decades, the main driver for intensification has been the need for economic efficiency gains in farming, supported by price support and Common agricultural policy (CAP). However, recent CAP reforms have led to farm income support that is largely de-coupled from production, which minimises policy incentives for further intensification.
Policy relevance and context
The primary role of agriculture is to supply food. Given that demand worldwide will continue rising in the future, the EU should be able to contribute to world food demand. Therefore it is essential that EU agriculture maintains its production capacity and improves it while respecting EU commitments in international trade and Policy Coherence for Development. EU agriculture finds itself today in a considerably more competitive environment, as the world economy is increasingly integrated and the trading system more liberalized. This trend is expected to continue in the coming years. This represents a challenge for EU farmers, but also offers an opportunity for EU food exporters. Therefore, it is important to continue to enhance the competitiveness and productivity of the EU agriculture sector. Favourable in the medium-term, the perspectives for agricultural markets are expected nonetheless to be characterised by greater uncertainty and increased volatility. On the other hand, agriculture and forestry play a key role in producing public goods, notably environmental such as landscapes, farmland biodiversity, climate stability and greater resilience to natural disasters such as flooding, drought and fire. At the same time, some farming practices have the potential to put pressure on the environment, leading to soil depletion, water shortages and pollution, and loss of wildlife habitats and biodiversity. The challenge ahead is to continue to meet the demand for food while at the same time reduce the pressures on the environment. The policy is currently addressing this challenge through the cross-compliance system for direct payments but also more and more consistently through instruments like the agri-environment measures.
Agri-environmental context
Some of the characteristics of the intensification process are for example an increase in the use of chemical inputs (fertilisers and crop protection), machinery, water and energy. In general these changes have led to a higher pressure on the environment, for example, through increased application of nitrogen and pesticides (see the relevant agri-environmental indicators).
The intensification process often coupled with improved efficiency has been a key response of farmers in the drive for participating in the economic progress of society at large. As other commercial activities, agriculture is aimed principally at production, which relies on the availability of natural resources and, in exploiting these resources, places environmental pressure on them. Intensification has therefore had overall a negative impact on the state of the farmed environment in the European Union in terms of pollution of soil, water and air and damage done to certain eco-systems.[14] On the other hand, intensification in most agricultural areas was also accompanied with extensification of agricultural land use or even complete abandonment of land in other areas.[15][16] This process is also linked with important environmental impacts which are connected, such as landscape change and lack of grassland management, which are generally undesirable.[17]
See also
- Agri-environmental indicators (online publication)
Further Eurostat information
Publications
- Agriculture, forestry and fishery statistics — 2016 edition
- Agriculture, fishery and forestry statistics - 2014 edition
- Environmental statistics and accounts in Europe - 2010 edition
- Food: from farm to fork statistics - 2011 edition
Database
- Agriculture, see:
- Economic Accounts for Agriculture (aact)
- Economic Accounts for Agriculture (aact_eaa)
- Economic accounts for agriculture - indices: volume, price, values (aact_eaa05)
- Economic Accounts for Agriculture (aact_eaa)
- Economic Accounts for Agriculture (aact)
- Agricultural Production System (aei_ps)
- Farm input consumption (source: FADN) (aei_ps_inp)
- Agricultural Production System (aei_ps)
Dedicated section
Source data for tables, figures and maps (MS Excel)
Other information
- Commission Communication COM(2006) 508 - Development of agri-environmental indicators for monitoring the integration of environmental concerns into the common agricultural policy
- Agri-Environmental Indicators, see:
- Corresponding IRENA Fact sheet 15
External links
- Publications:
- Database:
- Other external links:
- European Commission
- DG Agriculture and Rural Development
Notes
- ↑ Please note that for the purpose of this indicator, the type of farming refers to the typology TF8 of the FADN.
- ↑ In this note, a decrease in the share of area managed by high intensity farms together with an increase (or a stability) in the share of area managed by low intensity farms qualifies for extensification, the contrary for intensification. In a given region or Member State, an increase in the share of UAA managed by low intensity farms may very well happen together with an increase in the UAA managed by high intensity farms. Such a case will qualify for "no clear trend". Cases where the shares of UAA in the three intensity classes remain fairly stable or on the contrary vary a lot during the period studied will also qualify for "no clear trend".
- ↑ For the analysis of the type of farm was used the aggregation of crops under the general typology from FADN TF8.
- ↑ Variable SE295 in FADN. Variables are defined in the document RICC 882 Definitions of variables used in FADN standard results, available from the website http://circa.europa.eu/Public/irc/agri/rica/library?l=/information_documentatio/basic_definitions/definitions_variables/_EN_1.0_&a=d
- ↑ Variable SE300 in FADN.
- ↑ Variables F64 to F67 in FADN. Farm return variables are explained in the document RICC 1256 Farm Return Data Definitions available from the website: http://circa.europa.eu/Public/irc/agri/rica/library?l=/information_documentatio/basic_definitions/ricc_1256_2008pdf/_EN_1.0_&a=d
- ↑ Price indices of the means of agricultural production, input: base 2000=100 (annual) (apri_pi00_ina)
- ↑ Variable K182AA in FADN
- ↑ European Commmission (1999) Agriculture, Environment, Rural Development: Facts and Figures - A Challenge for Agriculture
- ↑ Clout, H. (1972), Rural geography. An introductory survey. Oxford: Pergamon.
- ↑ Hoekveld, G.A., R.B. Jobse, J. van Weesep; F.M. Dieleman (1973), Geografie van stad en platteland in de westerse landen. Roermond: Romen.
- ↑ Yruela, M.P (1995), Spanish rural society in transition. Sociologia Ruralis 35, p. 276-296.
- ↑ CEAS and EFNCP, (2000), The environmental impact of dairy production in the EU: practical options for the improvement of the environmental impact. Final report for DGXI. Centre for European Agricultural Studies and The European Forum on Nature Conservation and Pastoralism.
- ↑ Poiret, M. (1999), Crop trends and environmental impacts. In: CEC, Agriculture, Environment, Rural Development: Facts and Figures - A Challenge for Agriculture.
- ↑ Baldock, D., G. Beaufoy, F. Brouwer and F. Godeschalk (1996) Farming at the margins; abandonment or redeployment of agricultural land in Europe. London/The Hague, Institute for European Environmental Policy (IEEP) and Agricultural Economics Research Institute (LEI).
- ↑ MacDonald, D. et al. (2000), Agricultural abandonment in mountain areas of Europe: Environmental consequences and policy response. Journal of Environmental Management, 59, p. 47-70.
- ↑ MacDonald, D. et al. (2000), Agricultural abandonment in mountain areas of Europe: Environmental consequences and policy response. Journal of Environmental Management, 59, p. 47-70.
