- Data from September 2013. Most recent data: Further Eurostat information, Main tables and Database.
This article is part of a set of statistical articles based on the Eurostat publication Agriculture, forestry and fishery statistics pocketbook. It presents statistics on rural economic development in the European Union (EU).
(% of total population) - Source: Eurostat (urt_gind3) and (demo_r_gind3)
(% of total population) - Source: Eurostat (demo_r_pjangroup) and (demo_pjangroup)
(% of the EU-27 average, EU-27=100) - Source: Eurostat (demo_r_pjanaggr3)
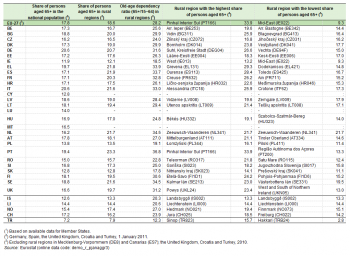
(%) - Source: Eurostat (demo_r_pjanaggr3)
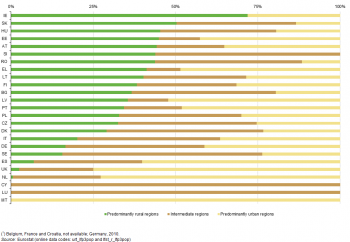
(% of active population) - Source: Eurostat (urt_lfp3pop) and (lfst_r_lfp3pop)
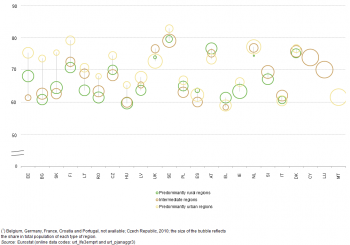
(%) - Source: Eurostat (urt_lfe3emprt) and (urt_pjanaggr3)
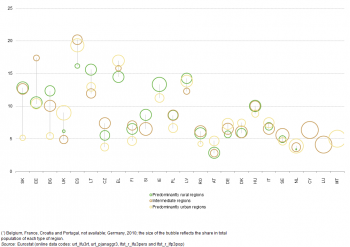
(%) - Source: Eurostat (urt_lfu3rt), (urt_pjanaggr3), (lfst_r_lfu3pers) and (lfst_r_lfp3pop)
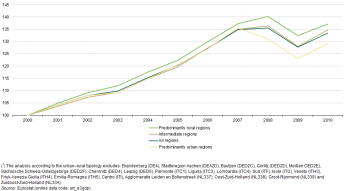
(GDP), by urban-rural typology, EU-27, 2000–10 (1)
(2000=100) - Source: Eurostat (urt_e3gdp)
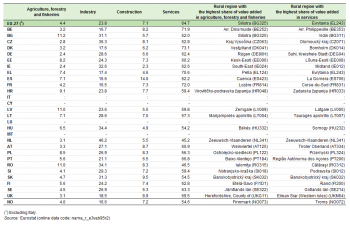
(% share of total value added) - Source: Eurostat (nama_r_e3vab95r2)
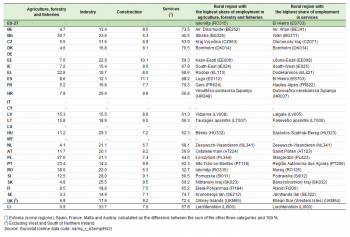
(% share of total employment) - Source: Eurostat (nama_r_e3emp95r2)
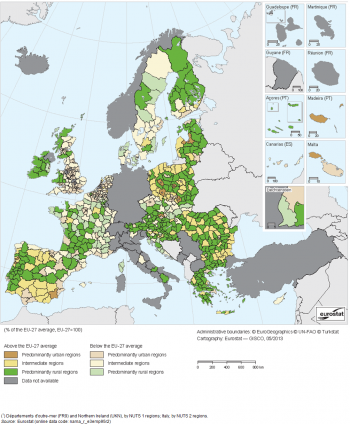
(% of the EU-27 average, EU-27=100) - Source: Eurostat (nama_r_e3emp95r2)
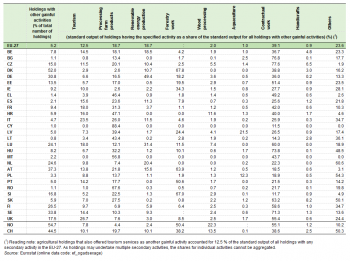
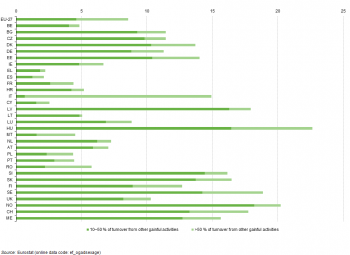
(% of standard output for all agricultural holdings) - Source: Eurostat (ef_ogadsexage)
Main statistical findings
Many of the European Union’s (EU’s) rural areas face a common challenge, as their capacity to create high-quality, sustainable jobs has fallen behind that of urban areas. Generally, incomes are lower in rural regions than in towns or cities and there are fewer job opportunities and those jobs that are available tend to be in a narrower range of economic activities. These differences between regions have, in some cases, resulted in land abandonment and considerable outward flows of rural populations. This article highlights the structure of rural populations, developments within rural labour markets, and an analysis of the primary economic activity in rural areas, namely, agriculture and forestry.
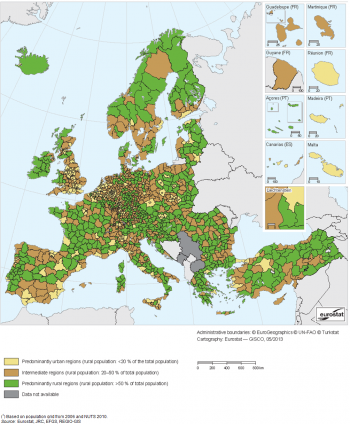
More than half (51.3 % in 2012) of the EU’s land area is within regions classified as being predominantly rural; these areas were inhabited by 112.1 million people, more than one fifth (22.3 %) of the EU-27’s population. Just under two fifths (38.7 %) of the area and more than one third (35.3 %) of the EU’s population were living in intermediate regions in 2012, while predominantly urban regions made up just one tenth (10.0 %) of the land area but accounted for more than two fifths (42.4 %) of the population. Map 1 shows which regions fall into each of the three types of region that are identified by the urban–rural typology. It should be noted that as population levels and population density change over time regions can move from one type to another, which can also happen if regional boundaries change.
Focus on the population in predominantly rural regions
Land abandonment — the cessation of agricultural activities on a given area of land — is closely linked to population dynamics. Many rural areas in mountainous or peripheral regions of the EU have seen their local populations decline due to the outward migration of younger persons, which may be linked to a lack of economic and social opportunities. As populations age, the average age of farmers has increased, while low birth rates have resulted in relatively few young persons being born and subsequently being available to take over family farms. An analysis of population dynamics is therefore important in the context of highlighting potential socioeconomic issues that may impact upon agriculture and rural regions.
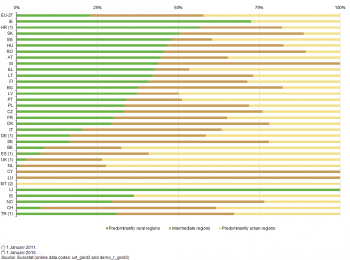
A summary of the distribution of the EU population between the three types of regions identified under the urban–rural typology as of the start of 2012 is presented in Figure 1. Although the average share of the population in predominantly rural regions was 22.3 % in the EU-27, the proportion for most of the Member States was higher; the EU-27 average was influenced by low shares in some of the largest Member States, notably the United Kingdom (2.9 % of the population living in predominantly rural regions, 1 January 2011), Spain (7.4 %, 1 January 2011), Germany (16.4 %, 1 January 2011) and Italy (20.2 %) — as well as to a lesser extent by the Netherlands (0.6 %), Belgium (8.6 %) and Sweden (16.2 %). Of the five largest (in population terms) EU Member States, France was the only one where the share of the population living in predominantly rural regions (29.9 %) was above the EU-27 average.
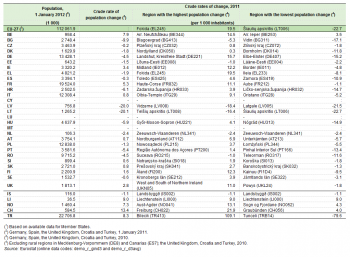
Table 1 shows that France had by far the largest population in predominantly rural regions, a total of 19.5 million persons as of 1 January 2012, equivalent to 17.4 % of the EU-27 total. Germany, Poland, Italy and Romania had the next largest populations in predominantly rural regions and together with France these five Member States were home to 60.5 % of the EU-27’s population found to be living in predominantly rural regions.
The highest share of the population living in predominantly rural regions as of 1 January 2012 was recorded in Ireland (72.4 %). A relatively high proportion of the population lived in predominantly rural regions in many of the central and eastern European countries that joined the EU since 2004, ranging from close to one third of the total population in the Czech Republic and Poland to more than one half in Slovakia (50.3 %) and Croatia (56.7 %); Austria, Greece, Finland and Portugal also recorded in excess of one third of their respective populations living in predominantly rural areas.
Population change
Predominantly rural regions experienced growth in 2011 in nine EU Member States (as well as in the United Kingdom in 2010); most of these were EU-15 Member States, although the population of predominantly rural regions also grew in Slovakia and Slovenia. The strongest population growth in predominantly rural regions was recorded in Belgium (7.9 per thousand) and France (5.3 per thousand). By contrast, the sharpest declines in population numbers for predominantly rural regions were recorded in Lithuania (-20.1 per thousand) and Latvia (-20.0 per thousand), followed at about half this rate by Bulgaria (-9.9 per thousand). Among the EU-15 Member States, Portugal recorded the fastest decline in its population living within predominantly rural regions, down 5.4 per thousand, ahead of Germany (2010) where the population fell by 4.5 per thousand.
The relatively sharp declines in rural populations recorded in some of the EU Member States point to issues of farmland abandonment (in some countries coming after a long process of land restitution) driven by structural and socioeconomic factors. This development is also reflected in the relatively large reductions in agricultural labour input in these countries (see the section on agricultural labour input in the article on agricultural accounts and prices for more details).
Population structure
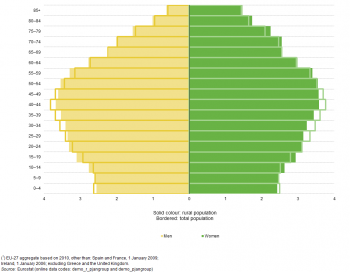
It is projected that consistently low birth rates and higher life expectancy will transform the shape of the EU-27’s age pyramid in the coming decades (see Figure 2 for the situation on 1 January 2010). Probably the most important change will be the marked transition towards a much older population structure and this development is already becoming apparent in several EU Member States. As a result, the proportion of people of working age in the EU-27 is shrinking while the relative number of those retired is expanding. The share of older persons in the total population will likely increase in the coming decades, as a greater proportion of the post-war baby-boom generation reaches retirement. This will, in turn, lead to an increased burden on those of working age to provide for the social expenditure required by the ageing population for a range of related services.
This development towards an ageing population is already apparent insofar as proportionately fewer people of working age and proportionally more people aged 65 and above are living in rural areas. In 2012, the proportion of older people aged over 65 years living in predominantly rural regions of the EU-27 was 18.6 %, compared with an average of 17.8 % across all regions.
These structural changes are important because farmland abandonment is more likely to occur when: the farming population is old (closer to retirement); there is a shrinking proportion of working age persons to take over farms, and; when real estate/land prices are weak and there is low investment in the farm. These issues were considered in the European Commission’s 2013 CAP reform and have resulted in a range of initiatives being proposed to help and attract young farmers, to promote social inclusion, poverty reduction and economic development in rural areas.
Across the EU-27, the 10 regions with the highest shares of persons aged 65 or over included eight that were predominantly rural regions, one intermediate region (Dessau-Roßlau, Kreisfreie Stadt in Germany) and one predominantly urban region (Trieste in Italy) — see Map 2. The predominantly rural regions with the highest shares of persons aged 65 or over were concentrated in the centre of Portugal, with one other, northern Portuguese region (Alto Trás-os-Montes), two regions in mainland Greece (Grevena and Evrytania) and one in north western Spain (Ourense). The highest share for any region in 2012 was 33.9 % — that is one in every three people being over 65 years old — in the rural Portuguese region of Pinhal Interior Sul. By contrast, the only predominantly rural region among the 10 regions with the lowest share of persons aged 65 or more in the population was the Irish Mid-East region, with a share of 9.3 %.
Table 2 shows that the share of persons aged 65 or more in the population in predominantly rural regions was above the national average in each of the EU Member States except for Belgium and Poland. The largest (in percentage point terms) differences between the shares for rural and national populations were observed for the Netherlands (5.5 percentage points), Spain (4.9), Portugal (3.8), France (3.2) and the United Kingdom (3.0).
Table 2 shows that Portugal had the biggest range between rural regions in relation to the share of persons aged 65 or more in the population. There was a 20.6 percentage point gap between Pinhal Interior Sul (33.9 % of the population aged 65 or more) and the Região Autónoma dos Açores (13.3 %). Differences in excess of 10 percentage points were also observed between the highest and lowest shares among rural regions in Greece, Spain, Germany, France and the United Kingdom.
Old-age dependency ratios — calculated for the purposes of this publication as the percentage ratio of persons aged 65 or more to persons aged 15–64 — for the rural regions of the EU Member States ranged from a high of 36.8 % in the rural regions of Portugal (meaning that there were a little less than three working age persons for every person aged 65 or more) to 17.8 % in Slovakia.
Focus on the labour market in predominantly rural regions
Economically active population
The distribution of the economically active population by type of region was very similar to the distribution of the population as a whole. As such, the weights of predominantly rural regions in the economically active population aged 25 years or over and in the total population were very close. Figure 3 shows the share of the active population in predominantly rural regions varied considerably from country to country: in the Netherlands, the United Kingdom and Spain predominantly rural regions accounted for less than 10 % of the economically active population, while at the other end of the scale, predominantly rural regions in Ireland accounted for over 70 % of the economically active population.
Employment and unemployment
Employment rates for persons aged 20–64 in the three different types of regions identified by the urban–rural typology are presented in Figure 4. In half of the EU Member States for which data are available for 2011 and which have at least two types of regions, predominantly rural regions generally had a lower employment rate than the other types of regions. In seven EU Member States intermediate regions had the lowest employment rates, while in Greece, Spain and Austria predominantly rural regions had a higher employment rate than for either intermediate or predominantly urban regions.
In several central and eastern EU Member States the difference between the employment rate in predominantly rural regions and predominantly urban regions was particularly high, notably in Bulgaria (12.8 percentage points difference), as well as Slovakia (10.9), Finland (8.4), Estonia (7.3), Lithuania (7.1), Hungary (5.7) and Romania (6.6). In most of the remaining Member States the differences between the employment rates for predominantly rural regions and those for intermediate regions were less pronounced, while employment rates were very homogenous for all types of regions in Denmark, Spain, Italy and Poland.
Figure 5 presents unemployment rates in the three different types of regions in 2011 (German data are for 2010). The highest unemployment rate for predominantly rural regions was recorded in Spain, at 16.2 %, while double-digit rural unemployment rates were also observed in Bulgaria, Estonia, Ireland, Greece, Latvia, Lithuania, Hungary and Slovakia.
In Denmark, Germany, Greece, Spain and the Netherlands, rural unemployment rates were lower than in the other two types of region. Only Ireland and some central and eastern EU Member States recorded higher unemployment rates in predominantly rural regions than in the other types of regions. By contrast, predominantly urban regions observed the highest unemployment rates in some western and southern Member States. The highest differences between unemployment rates in the different types of regions were recorded in Bulgaria, Estonia and Slovakia.
Focus on the economy in predominantly rural regions
In 2010, predominantly urban regions accounted for approximately 54.3 % of GDP within the EU-27, while intermediate regions contributed around 29.2 % and predominantly rural regions the remaining 15.3 %. Compared with 10 years earlier this gap between predominantly rural regions and predominantly urban regions closed slightly, as the share accounted for by predominantly urban regions fell 1.2 percentage points while the shares of the two other types of regions increased by 0.6 percentage points each.
Figure 6 shows how GDP in the three types of regions developed between 2000 and 2010; note that this data is presented in current prices and so is not adjusted for the impact of inflation. As noted above, measured in absolute terms the urban–rural gap in GDP remained significant, but narrowed slightly during the last decade. Between 2000 and 2007, GDP growth in predominantly rural regions slightly outpaced that in the two other types of region. A major change in developments occurred in 2008 as the impact of the financial and economic crisis was particularly strongly felt in predominantly urban regions where GDP fell on average by 3.4 %; in 2008 intermediate regions (1.0 %) and predominantly rural regions (2.2 %) continued to experience growth. In 2009, the downturn intensified with all three types of region experiencing a reduction in output, although the contraction was slightly deeper for intermediate regions (-6.2 %) and predominantly urban regions (-6.1 %) than it was for predominantly rural regions (-5.5 %). In 2010, all types of regions returned to growth, albeit less than the falls experienced in 2009, ranging from 3.5 % growth for predominantly rural regions to 5.0 % growth for predominantly urban regions and 5.3 % growth for intermediate regions.
Over the period 2000–10, average economic growth in the EU-27 for predominantly rural regions was 3.2 % per year, ahead of intermediate regions (3.0 %) and predominantly urban regions (2.6 %). It can therefore be concluded that the development of GDP in predominantly rural regions was stronger than for either of the other types of regions and that it was somewhat less volatile during the financial and economic crisis.
Focus on agriculture in rural regions
The importance attached to the structure and composition of rural economies reflects their diversity and is a consequence of the scale of diversification from and within primary activities such as agriculture, forestry and fisheries. Employment challenges across the EU’s rural areas are related, at least in part, to the diversity of local economies.
Services have been the major driver of growth within the EU during recent decades. However, their share of regional GDP (note that data are not available for the vast majority of Italian regions) was much lower in 2010 in predominantly rural regions (64.7 %) than in intermediate regions (68.7 %) or predominantly urban regions (78.6 %). By contrast, the shares of other economic activities were higher within predominantly rural regions — 23.8 % for industry, 7.1 % for construction and 4.4 % for agriculture, forestry and fisheries — than for the two other types of regions. Services contributed more than half of total value added in predominantly rural regions in all of the Member States in 2010, except for the Netherlands and Romania, both of which had relatively large industrial sectors, while Romania’s agriculture, forestry and fisheries sector was one of the largest (in terms of its contribution to total value added) — see Table 3. In four Member States, the share of services in total value added was over 70.0 % in predominantly rural regions, reaching 73.1 % in Denmark.
While agriculture, forestry and fisheries was the smallest of the four economic activities presented in Table 3 for predominantly rural regions across the EU, this situation was not repeated in all of the Member States. In the predominantly rural regions of Bulgaria, Estonia, Ireland, Greece, Latvia, Lithuania, Poland and Romania, the contribution of agriculture, forestry and fisheries to total value added in 2010 was greater than that of construction; this was also the case in Croatia. The highest contributions of agriculture, forestry and fisheries to value added in predominantly rural regions were recorded in Bulgaria (11.2 %), Latvia and Romania (both 11.0 %). By contrast, agriculture, forestry and fisheries contributed as little as 2.4 % of total value added in the predominantly rural regions of Germany and Ireland.
Agricultural, forestry and fisheries labour force
In 2010, the regular agricultural labour force in the EU-27 was around 25.0 million people, very many of them working on a part-time and/or seasonal basis. The agricultural labour input in the EU-27 in 2012 was estimated at 10.1 million annual working units: one annual working unit is equivalent to one person working full-time for a whole year. The level of labour input in 2012 was around 25 % lower than it had been 10 years earlier, an average reduction of 2.9 % per annum. The largest overall reductions in agricultural employment over this 10-year period were in Slovakia (-58.9 %) and Estonia (-56.2 %), while agricultural labour input also fell by 30.0 % or more in Bulgaria, Latvia, Romania, the Czech Republic, Hungary, Sweden, Greece and Denmark, as well as in Norway. The only EU Member States that reported an increase in their agricultural labour input over this period were Malta (14.0 %) and Ireland (4.6 %).
Table 4 presents a similar analysis to that in Table 3 but focused on employment; it should be noted that this analysis is for 2009 and that data are not available for either Germany or Italy (and hence no EU aggregate has been produced). Again services dominated the analysis, providing employment for more than half the workforce in predominantly rural regions in all Member States except for Poland, Bulgaria and Romania. The employment share of agriculture, forestry and fisheries in predominantly rural regions tended to be higher than the equivalent value added share, although this was not the case in Estonia or Sweden. In some of the Member States the difference between the value added and employment contributions were particularly large, notably in Romania, Bulgaria, Poland, Portugal and Greece, where the difference was more than 10 percentage points; the employment shares of agriculture, forestry and fisheries in the predominantly rural regions of these Member States were so high that they were greater than the shares recorded for either industry or construction, and in the case of Romania the employment share of agriculture, forestry and fisheries in predominantly rural regions was also higher than that recorded for services.
By contrast, agriculture, forestry and fisheries provided less than 5.0 % of employment in the predominantly rural regions of Sweden, the Netherlands, Denmark, Belgium and Slovakia. Agriculture, forestry and fisheries contributed 4.4 % to the rural economy’s total value added in 2010 (excluding nearly all Italian regions) and 15.6 % of rural employment in 2009 (excluding Germany and nearly all Italian regions). Looking from another perspective, predominantly rural regions accounted for 42.4 % of the added value in agriculture, forestry and fisheries across the EU and for 54.9 % of employment in this sector; this underlines not only the importance of the agriculture, forestry and fisheries sector for predominantly rural regions but also the importance of predominantly rural regions for the agriculture, forestry and fisheries sector.
Map 3 presents more detailed information on the relative importance of agriculture, forestry and fisheries in regional employment. For the EU-27 as a whole, agriculture, forestry and fisheries provided 5.21 % of employment in 2012, down from 5.37 % in 2009 (the year for which regional data are presented in the map). Unsurprisingly, employment in this sector is particularly concentrated in predominantly rural regions. Among the 750 regions in the map some 325 were predominantly rural regions, and among these 264 had a higher employment share for agriculture, forestry and fisheries than the EU-27 average. By contrast, there were only 12 (out of 188) predominantly urban regions and 95 (out of 237) intermediate regions with an above average employment share in agriculture, forestry and fisheries.
The highest shares of agriculture, forestry and fisheries in total employment at the NUTS level 3 were mainly in Romania: Ialomita had the highest share (63.6 %) while seven other Romanian regions had shares over 50.0 %. Following on from these regions were Silistra in Bulgaria (49.4 %) and Alto Trás-os-Montes in Portugal (47.8 %), before four more Romanian regions. The highest shares of agriculture, forestry and fisheries in employment among intermediate regions were 45.0 % and 44.0 % in the Romanian regions of Bacau and Iasi, the 17th and 19th highest shares respectively. Among predominantly urban regions the highest share was 26.2 % in the Polish region of Krakowski, which was the 74th highest share. The lowest share of agriculture, forestry and fisheries among predominantly rural regions was 0.5 % in the Spanish island region of El Hierro. In 12 regions there was no employment in agriculture, forestry and fisheries, 10 of which were predominantly urban regions and two were intermediate regions (Swindon and Plymouth in the United Kingdom); nine of these regions with no employment in agriculture, forestry and fisheries were in the United Kingdom and the other was the Danish capital city region of Byen København.
Agricultural secondary activities
Whilst the share of agriculture, forestry and fisheries in rural economies has declined, the importance of diversification in rural economies has grown. In the EU-27 as a whole around 5.2 % of farms had at least one other source of income (referred to as other gainful activities) — see Table 5. This share ranged from less than 5.0 % in Italy, Poland, Malta, Spain, Greece, Bulgaria, Romania, Cyprus and Lithuania (where it was just 0.8 %) to more than one third in Sweden, Austria and Denmark (where it reached 52.0 %), while among those Member States that joined the EU in 2004 or 2007 the highest proportions of agricultural holdings with other gainful activities were recorded in Slovenia (16.8 %), the Czech Republic (15.0 %) and Estonia (13.5 %). The overall EU-27 average is strongly influenced by the low proportion of agricultural holdings in Italy, Poland and Romania that had other gainful activities, while each of these three Member States had a very high overall number of holdings — together they accounted for well over half (58.2 %) of the 12.0 million holdings across the EU-27; note that many of these were very small in size and employed the equivalent of less than a single, full-time person.
When considered in terms of their economic weight (based on standard output), agricultural holdings that undertake secondary activities were more important than suggested by a simple count, as they generated 18.9 % of agricultural standard output in the EU-27 in 2010. In some Member States, the relative importance of secondary activities was quite different whether measured in terms of the number of holdings or their output, for example: while only 1.1 % of holdings in Bulgaria and Romania had a secondary activity, those that did accounted for 13.5 % and 9.6 % respectively of total standard output, while in Lithuania those agricultural holdings with secondary activities (0.8 % of the total) generated 7.4 % of standard output.
Table 5 gives an indication of the various types of secondary gainful activities that were practised by agricultural holdings in 2010. Note that the shares indicated in the table do not show the relative importance of the secondary activity, but the overall importance of the holdings that undertake that activity among all holdings with secondary activities. For example, agricultural holdings that also offered tourism services accounted for 12.5 % of the standard output of holdings with any secondary activity in the EU-27. As holdings may undertake multiple secondary activities the shares for individual activities cannot be aggregated. Particularly common secondary activities included contractual work, forestry, the processing of farm products and renewable energy production.
As noted above, 18.9 % of all standard output in the EU-27 was generated by agricultural holdings with secondary activities. Figure 7 gives further analysis of this figure, and shows that a total of 8.6 % of all standard output was generated by holdings where secondary activities generated at least 10 % of turnover, among which 4.0 % of all standard output was generated by holdings where secondary activities generated more than half of turnover. Hungary had the highest proportion of standard output generated by holdings where at least 10 % of turnover was from secondary activities, while Italy had by far the highest proportion of standard output generated by holdings where secondary activities generated more than half of turnover.
Data sources and availability
Eurostat’s regional statistics are the basis for the information presented in this article. For most regional analyses, data are collected at a specific regional level (of the NUTS classification). By contrast, the statistics presented here have been produced by first classifying the full set of NUTS level 3 regions according to the extent that they are urban or rural: this classification is known as the urban–rural typology.
The latest classification exercise was carried out in 2012 and featured three important changes compared with the previous exercise (conducted in 2010):
- the introduction of the NUTS 2010 classification;
- the availability of a more accurate population grid;
- a re-evaluation of the presence of major cities, using a harmonised list of cities from the Urban Audit.
The typology uses a three-step approach to determine urban or rural areas for NUTS level 3 regions, namely: identify rural populations at the level of the 1 km² grid cells; classify NUTS level 3 regions according to the share of population for each type of grid cell; and then adjust the classification based on the presence of cities.
For grid cells to be considered as urban they should fulfil two conditions: a population density of at least 300 inhabitants per km² and a minimum population of 5 000 inhabitants in contiguous (neighbouring or adjoining) cells above the density threshold; all remaining cells are considered as rural. Having established which grid cells fall into which category, the next step is to classify the NUTS level 3 regions into one of three groups:
- predominantly rural regions: where the rural population accounts for 50 % or more of the total population;
- intermediate regions: where the rural population accounts for between 20 % and 50 % of the total population;
- predominantly urban regions: where the rural population accounts for less than 20 % of the total population.
Those NUTS 3 regions which are smaller than 500 km² are combined, for classification purposes, with one or more of their neighbours. The results are then checked against a final criterion: namely, the size of any cities within each particular region. A region classified as predominantly rural becomes intermediate if it contains a city of more than 200 000 inhabitants which represents at least 25 % of the region’s total population. A region classified as intermediate becomes predominantly urban if it contains a city of more than 500 000 inhabitants representing at least 25 % of the regional population total.
Context
Rural development is an important policy area, covering areas such as: farming and forestry; land use; the management of natural resources; and economic diversification in rural communities. Rural areas are important to the European economy insofar as they provide a wide range of foodstuffs and raw materials. Furthermore, rural areas are often places of natural beauty and offer a wide range of recreational activities, while forested areas provide one means of combating climate change.
See also
- Territorial typologies (background article)
- Urban-rural typology (background article)
Further Eurostat information
Data visualisation
Publications
- Ageing in the European Union: where exactly? - Statistics in focus 26/2010
- Agriculture, forestry and fishery statistics - 2013 edition (Pocketbook)
- Eurostat regional yearbook 2013 - Chapter 15 (Statistical book)
- Eurostat regional yearbook 2012 - Chapter 14 (Statistical book)
- Eurostat regional yearbook 2011 - Chapter 16 (Statistical book)
- Eurostat regional yearbook 2010 - Chapter 15 (Statistical book)
- The economy of EU rural regions - Statistics in focus 30/2012
Database
- Demography statistics by urban-rural typology (urt_demo)
- Economic accounts by urban-rural typology (urt_eco)
- Labour market statistics by urban-rural typology (urt_lmk)
Dedicated section
Methodology / Metadata
Source data for tables, figures and maps (MS Excel)
External links
- European Commission — Rural development policy
- Council Regulation 1698/2005 of 20 September 2005 on support for rural development by the European Agricultural Fund for Rural Development (EAFRD)
- Commission Regulation 1974/2006 of 15 December 2006 laying down detailed rules for the application of Council Regulation 1698/2005 on support for rural development by the European Agricultural Fund for Rural Development (EAFRD)

