Archive:Road freight vehicle statistics - lorries, road tractors and trailers
- Data from June 2013. Most recent data: Further Eurostat information, Main tables and Database.
This article describes the development in passenger cars stocks and new registration in the European Union (EU), focusing in particular on passenger cars powered by so-called ‘alternative fuels’.
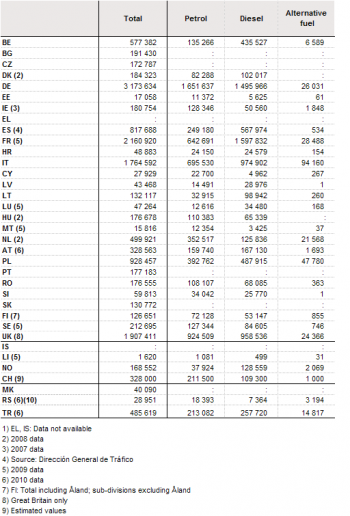
Despite an increase between 2009 and 2011, passenger cars powered by alternative fuels, including hybrid cars, only made up a marginal share of the fleet of passenger cars in the EU in 2011. Also among new registered passenger cars, the share of cars powered by alternative fuels was low.
Overall, the passenger car fleet in the EU member states has increased steadily since 2005. The highest number of cars per inhabitant was recorded in Luxembourg, Italy and Latvia. In 2011, the highest shares of old passenger cars were found in Lithuania, Latvia, Romania and Cyprus.
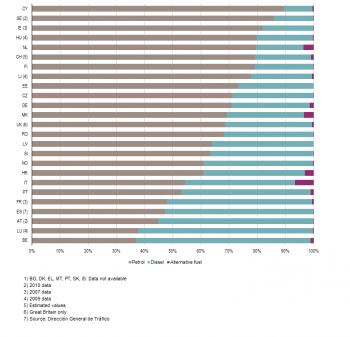
Preferences with regards to petrol or diesel powered passenger cars vary across the EU member states; amongst the member states for which recent data are available, cars with petrol powered engines make up the majority of registered passenger cars in half of the countries, whereas diesel powered passenger cars dominate in the other half. Medium sized petrol and diesel engines dominated the passenger car fleet in most EU member states; however, in Hungary and Romania the smallest engines dominated.

Main statistical findings
Preferences for petrol or diesel powered engines vary across member states, while alternative fuels still play a marginal role
The preferences for whether a new passenger car should be powered by a petrol or diesel engine vary across EU member states. In around than half of the member states for which detailed 2011 data are available, new passenger cars powered by diesel engines outnumbered new petrol powered cars. In these member states as a whole, diesel powered cars made up 57.5% of new registered passenger cars, while petrol powered cars made up 39.7% and cars powered by alternative fuels (LPG, natural gas, electricity and other alternative fuels) made up only 2.8% in 2011. One reason for the differences in preferences between member states regarding petrol or diesel powered cars is national taxation systems, both with respect to the fuel type of the vehicle’s engine and with respect to direct taxation on the respective fuel.
The highest share of diesel powered cars among new registered passenger cars was registered in Lithuania, where it made up for 74.9% of new passenger cars in 2011. High shares of diesel powered cars were also noted amongst the new registration in Spain (69.5%) and Latvia (66.7%) in 2011. In earlier years, high shares of new registrations of diesel powered passenger cars have also been observed in France, Luxembourg and Denmark; however 2011 data are not available for these countries.
In contrast, petrol powered passenger cars dominated new registrations in Cyprus (81.3%), Estonia (66.7%), Romania (61.2%), Finland (57.0%), Slovenia (56.9%) and Germany (52.0%) in 2011. High shares of petrol powered cars have in previous years also been observed in the new registrations in the Netherlands (72.5%), Ireland (71.0%), Hungary (62.5%) and Sweden (59.9%); however, recent data are not available for these countries.
In the EU member states and EFTA countries for which reliable recent data are available, a slight increase in the share in the new registrations of passenger cars powered by alternative fuels (including hybrids) can generally be observed in the period from 2009 to 2011, although at a marginal level. The share of registration of new passenger cars powered by alternative fuel fluctuates in several countries. One of the reasons behind this is the variety of government incentives to stimulate the share of cars with lower emissions, and when these incentives are introduced, adjusted and stopped. These incentives e.g. tax reductions, subsidies or specific privileges such as access to lanes reserved for public transport, free parking, etc. Another main influence is the number and variety of passenger car models offered with engines powered by alternative fuels, as well as the prices of such models.
Luxembourg, Italy and Cyprus record the highest numbers of passenger cars per inhabitant
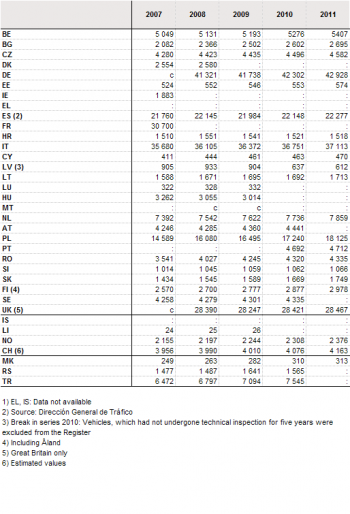
Not surprisingly, in 2011 the highest number of registered passenger cars was registered in Germany. Thereafter followed Italy, France (2007 data) and the United Kingdom. Over the five year period from 2007 to 2011, there was strong growth in the number of registered passenger cars in several member states. The highest growth was recorded in Bulgaria (29.4%), followed by Romania (22.4%), Slovakia (22.0%) and Cyprus (14.4%).
Two member states recorded a decline in the number of registered passenger cars over the period observed: these were Hungary with a fall 7.6% from 2006 to 2008, and Latvia where the slump of 32.3% is mainly due to a change in register procedures since 2010. Consequently, Latvian data for 2010 and 2011 cannot be directly compared to previous years.
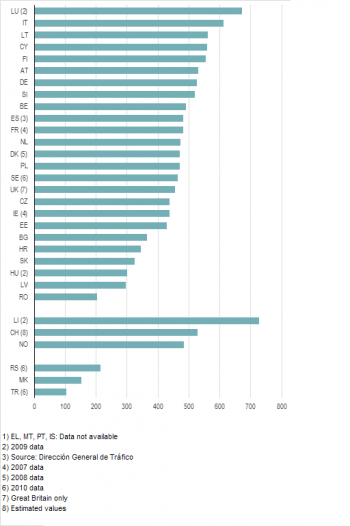
Amongst the EU member states, EFTA countries and EU enlargement countries, the highest ‘motorisation rates’ were recorded in small countries, Italy and Germany. Lichtenstein (728 passenger cars per 1000 inhabitants) and Luxembourg (672 cars) lead the list (both 2009 data); for both countries, this figure may be influenced e.g. by cross-border workers (i.e. not inhabitants) using company cars registered in the country.
Amongst the member states, a particularly low motorisation rate is recorded in Romania (202 cars), despite a growth in the number of registered cars of 22.4% over the last five years. However, the motorisation rate is still substantially lower in the enlargement countries such as Turkey (104 cars) and the former Yugoslav republic of Macedonia (152 cars).
Passenger cars with medium-sized petrol engines popular in northern member states; smaller sized petrol engines preferred in many eastern member states
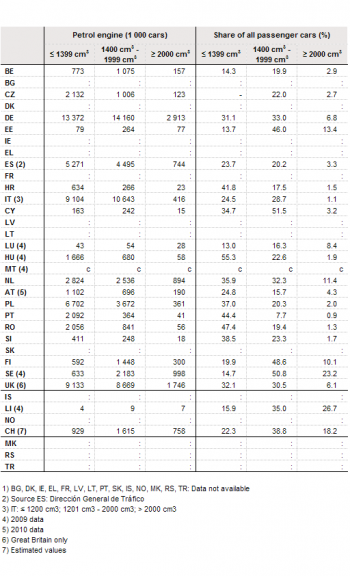
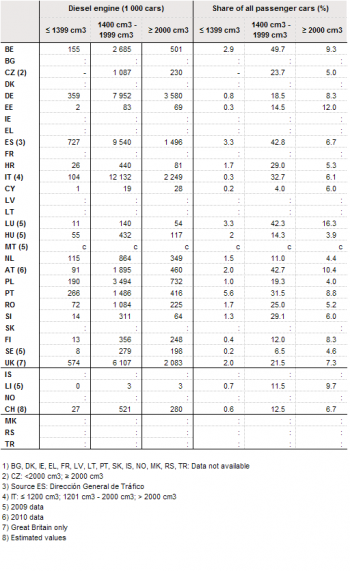
In 10 of the 23 member states for which detailed information is available, the majority of passenger cars were powered by a petrol engine. In Hungary (55.3%, 2009 data) and Romania (47.4%) passenger cars with small petrol engines made up around half of all passenger cars. In the northern member states Sweden (50.8%, 2009 data) and Finland (48.6%) medium sized petrol engines powered about half of the passenger cars. Medium sized petrol motors also powered around half of all passenger cars in Cyprus (51.5%) and Estonia (46.0%).
Large petrol engines can be found in passenger cars in particular in Lichtenstein, Sweden (both 2009 data) and Switzerland. Cars with large engines, whether petrol or diesel fuelled, make up more than a third of all passenger cars in Lichtenstein, more than a quarter in Sweden and around a quarter in Estonia, Switzerland and Luxembourg.
Overall, passenger cars with small engines usually use petrol as fuel; small diesel engines can be found in relatively few passenger cars across the EU. In countries where diesel powered passenger cars dominate, medium sized engines dominate. This is the case for the countries with the highest overall share of diesel powered passenger cars, Luxembourg and Belgium, as well as in the other countries where diesel cars make up more than half of overall passenger cars (Austria and Spain). In Estonia, large diesel engines power 12.0% of the passenger cars, almost at the same level as the medium sized diesel engines (14.5%), although diesel powered cars make up only a quarter of all passenger cars in the country.
Despite efforts across Europe to increase the share of cars with low emissions, the shares of passenger cars powered by alternative fuels remained very low in most member states in 2011. The main exceptions were Poland (16.4%), Italy (6.6%) and the Netherlands (3.5%). With the exception of Belgium, Germany, Croatia and Portugal, the shares for low emission passenger cars in the total passenger car fleet below 1.0%. However, the accuracy of the data on passenger cars powered by alternative fuels is uncertain.
Oldest passenger car fleets in eastern member states
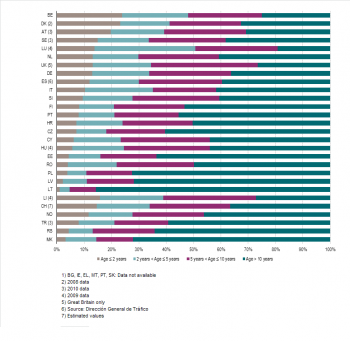
Several member states reported a larger share of ‘old’ passenger cars (5 years or older) than the EU enlargement countries for which these data are available (Former Yugoslav Republic of Macedonia and Turkey). The member states with the highest shares (more than two thirds of the fleet) of older passenger cars included the three Baltic States (Estonia, Latvia and Lithuania), Romania, Cyprus, Croatia, Portugal, Poland, Hungary, the Czech Republic, Finland, Italy and the United Kingdom.
Generally, the shares of old passenger cars are higher in the member states that joined the EU since 2004 than in the other member states. Interestingly, in the EFTA countries the shares of old passenger cars almost match that of these mainly eastern EU member states. In contrast, the share of the newest passenger cars (less than 2 years old) is highest in Belgium, Denmark (2008 data), Austria and Sweden (2010 data).
In 2008 and 2009, a number of countries had in place programmes supporting purchases of new cars with low emissions while scrapping the owners’ old car. The general aims of these programmes were the renewal of the passenger car fleet with lower emission cars, while simultaneously stimulating the economy. These programmes have had a certain influence on the age composition of passenger cars in individual countries. Such programmes were set up in almost half of the member states; in this context, one should take note of the reference year when analysing these data.
Data sources and availability
Data source
The Eurostat/ITF/UNECE Common Questionnaire on Inland Transport.
Definitions
All definitions used are taken from the Eurostat/UNECE/ITF Illustrated Glossary for Transport Statistics, currently in its 4th edition. This glossary can be found on Eurostat’s website.
- Goods road vehicle
- Road vehicle designed, exclusively or primarily, to carry goods. Included are:
- Light goods road vehicles with a gross vehicle weight of not more than 3 500 kg, designed exclusively or primarily, to carry goods, e.g. vans and pick-ups
- Heavy goods road vehicles with a gross vehicle weight above 3 500 kg, designed, exclusively or primarily, to carry goods
- Road tractors
- Agricultural tractors permitted to use roads open to public traffic.
- Goods road motor vehicle
- Any single road motor vehicle designed to carry goods (e.g. a lorry), or any coupled combination of road vehicles designed to carry goods, (i.e. lorry with trailer(s), or road tractor with semi-trailer and with or without trailer).
- Lorry / truck
- Rigid road motor vehicle designed, exclusively or primarily, to carry goods.
- Road tractor
- Road motor vehicle designed, exclusively or primarily, to haul other road vehicles which are not power-driven (mainly semi-trailers). (Agricultural tractors are excluded.)
- Trailer
- Goods road vehicle designed to be hauled by a road motor vehicle (excludes agricultural trailers and caravans.)
- Semi-trailer
- Goods road vehicle with no front axle designed in such way that part of the vehicle and a substantial part of its loaded weight rests on a road tractor.
- Road train
- Goods road motor vehicle coupled to a trailer. Articulated vehicle (road tractor coupled to a semi-trailer) with a further trailer attached is included.
- Load capacity
- Maximum weight of goods declared permissible by the competent authority of the country of registration of the vehicle.
- Gross vehicle weight (Legally permissible maximum weight)
- Total of the weight of the vehicle (or combination of vehicles) including its load when stationary and ready for the road declared permissible by the competent authority of the country of registration. This includes the weight of the driver and the maximum number of persons permitted to be carried.
- Unladen vehicle weight
- Weight of vehicle (or combination of vehicles) excluding its load when stationary and ready for the road. The unladen weight may include driver and fuel, dependent on national practice.
- Cylinder capacity
- The cylinder capacity of the engine as certified by the competent authority of the country of registration.
- Motor energy
- The principal type of motor energy used by the vehicle as certified by the competent authority of the country of registration. For hybrid or dual-fuelled vehicles adapted for using more than one type of motor energy (e.g. LPG and petrol, or electricity and diesel, etc.), the principal type of motor energy should be, where possible, an alternative fuel.
- Alternative fuel
- A type of motor energy other than the conventional fuels petrol and diesel. Alternative fuels include electricity, LPG, natural gas (NGL or CNG), alcohols, mixtures of alcohols with other fuels, hydrogen, biofuels (such as biodiesel), etc. (This list is not exhaustive.) Alternative fuels do not include unleaded petrol, reformulated petrol or city (low-sulphur) diesel.
Context
The Common Questionnaire on Inland Transport is a joint project of Eurostat, the International Transport Forum (ITF) and the United Nations Economic Commission for Europe (UNECE). The data are provided on a voluntary basis by a large number of countries, both within and outside the European Union. Data is collected from reliable sources, but data collection methodologies are not harmonised at EU level. Comparability across countries is restricted as the classifications used in the national vehicle registers are not harmonised. Vehicles registers may exclude taxis, pick-up and vans, and may also exclude very old vehicles. This article covers data provided by the EU Member States, the European Free Trade Association (EFTA) countries and EU enlargement countries.
See also
- Transport introduced
- Road freight transport statistics
- Road freight transport by vehicle characteristics
- Stock of vehicles at regional level
- Manufacture of motor vehicles, trailers and semi-trailers statistics - NACE Rev. 2
- Motor trades statistics - NACE Rev. 2
- Sustainable development - transport
Further Eurostat information
Data visualisation
- Regional Statistics Illustrated - select statistical domain 'Transport' (top right)
Publications
- Energy, transport and environment indicators - Pocketbook - 2013 edition
- Europe in figures - Eurostat yearbook 2013, chapter 10: Transport
- Decline in European road freight transport in 2011 reflecting the economic climate - Statistics in focus 38/2012
- Slow recovery in road freight transport in 2010 - Statistics in focus 15/2012
- Six years of road freight growth lost to the crisis - Statistics in focus 12/2011
Main tables
- Transport statistics, see:
- Road transport (t_road)
Database
- Transport statistics, see:
- Road transport (road)
- Road transport equipment - Stock of vehicles (road_eqs)
- Road transport equipment - New registration of vehicles (road_eqr)
Dedicated section
Methodology / Metadata
- Vehicle stocks: road_eqs_esms
- New vehicles: road_eqr_esms
- Eurostat/UNECE/ITF Illustrated Glossary for Transport Statistics, 4th edition
Source data for tables, figures and maps (MS Excel)
Other information
- White paper COM(2011) 144 final Roadmap to a single European transport area – towards a competitive and resource efficient transport system
- Handbook on statistics on road traffic - Methodology and experience (UNECE, 2007)
External links
- International Transport Forum (ITF) - Statistics
- United Nations Economic Commission for Europe (UNECE) - Transport statistics
Notes
[[Category:<Infrastructure and means>|Road freight vehicle statistics - lorries, road tractors and trailers]] [[Category:<Road>|Road freight vehicle statistics - lorries, road tractors and trailers]]
[[Category:<Statistical_article>|Road freight vehicle statistics - lorries, road tractors and trailers]]
[[Category:<Transport>|Road freight vehicle statistics - lorries, road tractors and trailers]]