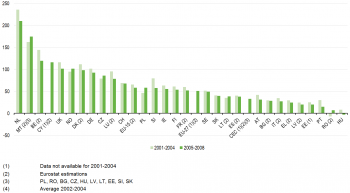
Data from March 2012. Most recent data: Further Eurostat information, Main tables and Database.
This background article contains a fact sheet of the agri-environmental indicator (AEI) gross nitrogen balances. Together with other fact sheets, it provides an overview of the state of the agri-environmental indicators in the European Union (EU).
Indicator definition
Potential surplus of nitrogen on agricultural land (kg N/ha/year).
Measurements
Main indicator:
Potential surplus of nitrogen on agricultural land (kg N/ha/year).
Links with other indicators
- AEI 5 - Mineral fertilizer consumption
- AEI 10.1 - Cropping patterns
- AEI 10.2 - Livestock patterns
- AEI 18 - Ammonia emissions
- AEI 19 - Greenhouse gas emissions
And influences:
- AEI 27.1 - Water quality – Nitrate pollution
Main findings
Key messages
- In most countries the average Gross Nitrogen Surplus (GNS) per ha between 2005 and 2008 was lower than between 2001 and 2004 (Figure 1). Exceptions were CZ, LT, MT, PL, RO and NO. Data for CY and EE were not available for 2001-2004.
- The average GNS 2005-2008 is higher in EU-15 (58 kg N per ha) than in the Central and East European Countries (CEC)[1] (33 kg N per ha).
Main warnings
- Climatic conditions have a big impact on the balance through the impact on yield and therefore N output. Climate and weather conditions are beyond the control of the farmer. To dampen the effect of weather conditions results on the nutrient balance are presented as an average for a certain period.
- All references to area in this fact sheet based on data from the nutrient balances relate to the reference area. At the moment the reference area is based on the land-use statistics in Eurostat, and consists of arable land, land under permanent crop and permanent grassland. Note that this area is not equal to the UAA, as the UAA also includes area under glass and kitchen gardens. Some countries have excluded certain extensive areas from the reference area as well.
- Due to methodological issues or missing data balances have been estimated by Eurostat for: MT, BE, DK, CY, IT, ES, LU, FR, LT, LV, BG, RO, EL. The results of these countries can only be regarded as a rough indication of the GNS.
- The quality and accuracy of the estimated GNS per ha is depending on the quality and accuracy of underlying data and coefficients used. As methodologies (especially with regards to the coefficients) and data sources used in countries vary substantially the balances are only consistent within a country across time. The Gross Nitrogen Balances are not consistent across countries, which means that data cannot be compared between countries.
- There are several actions ongoing to improve the methodology and data of the Gross Nitrogen Balances, such as a revision of the Handbook by the end of 2012, tender on excretion coefficients and grasslands in 2012 and grants in 2012 to improve crop coefficients.
Context
Introduction
The Gross Nitrogen Balance (GNB-N) lists nitrogen inputs to agricultural soils and nitrogen outputs removed from the soil. The main result from the GNB-N is the Gross Nitrogen Surplus (GNS) which is calculated as the difference between total N inputs and total N outputs. The GNS can also be expressed in kg N per ha, by dividing the surplus by the reference area. The GNB-N provides insight into links between agricultural nitrogen use and losses of nitrogen to the environment. A persistent surplus indicates potential environmental problems, such as ammonia emission (contributes to acidification, eutrophication and atmospheric particulate pollution), nitrate leaching (resulting in pollution of drinking water and eutrophication of surface waters) or nitrous oxide emissions (a potent greenhouse gas). A persistent deficit indicates the risk of decline in soil fertility.
The GNB-N can only indicate the potential risk to the environment as the actual risk depends on many factors including climate conditions, soil type and soil characteristics, management practices such as drainage, tillage, irrigation etc.
Further Eurostat information
Publications
Main tables
- Title(s) of second level folder (if any)
- Title(s) of third level folder (if any)
Database
- Title(s) of second level folder (if any)
- Title(s) of third level folder (if any)
Dedicated section
Methodology / Metadata
<link to ESMS file, methodological publications, survey manuals, etc.>
- Name of the destination ESMS metadata file (ESMS metadata file - ESMS code, e.g. bop_fats_esms)
- Title of the publication
Source data for tables, figures and maps (MS Excel)
Other information
<Regulations and other legal texts, communications from the Commission, administrative notes, Policy documents, …>
- Regulation 1737/2005 (generating url [http://eur-lex.europa.eu/LexUriServ/LexUriServ.do?uri=CELEX:32005R1737:EN:NOT Regulation 1737/2005]) of DD Month YYYY on ...
- Directive 2003/86/EC (generating url [http://eur-lex.europa.eu/LexUriServ/LexUriServ.do?uri=CELEX:32003L0086:EN:NOT Directive 2003/86/EC]) of DD Month YYYY on ...
- Commission Decision 2003/86/EC (generating url [http://eur-lex.europa.eu/LexUriServ/LexUriServ.do?uri=CELEX:32003D0086:EN:NOT Commission Decision 2003/86/EC]) of DD Month YYYY on ...
<For other documents such as Commission Proposals or Reports, see EUR-Lex search by natural number>
<For linking to database table, otherwise remove: {{{title}}} ({{{code}}})>
External links
- United Nations Environment Programme (UNEP) - Global Programme of Action for the Protection of the Marine Environment from Land-based Activities (GPA) - Global Partnership on Nutrient Management
See also
Notes
- PL, RO, HU, BG, LT, LV, EE, CZ, SI, SK ↑
- Mark A. Sutton, Oene Oenema, Jan Willem Erisman, Adrian Leip, Hans van Grinsven &amp;amp;amp; Wilfried Winiwarter. Too much of a good thing. Nature, Volume: 472, Pages: 159–161, 2011 ↑
- Mark A. Sutton, et al (eds). The European Nitrogen Assessment, Cambridge, 2011 ↑
- Sutton M.A. et al. Our Nutrient World. The challenge to produce more food &amp; energy with less pollution. Key Messages for Rio+20. Centre for Ecology &amp; Hydrology, 2012. ↑
[[Category:<Subtheme category name(s)>|Statistical article]] [[Category:<Statistical article>|Statistical article]]

