Archive:Employment content in EU exports - an analysis with FIGARO data
Data extracted in June 2021.
Planned article update: July 2022.
Highlights
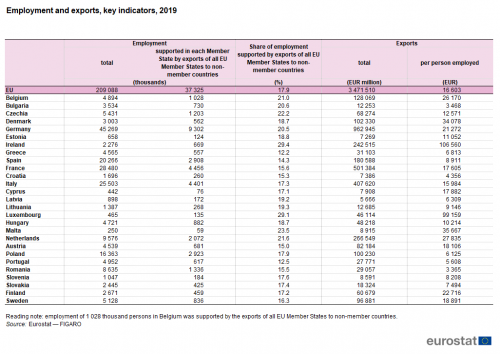
In 2019, the employment of 37 million people in the EU was supported by exports to non-member countries, equivalent to just over one in six of the 209 million persons employed in the EU.
As a share of total employment, the employment in each of the EU Member States that was supported by exports from any of the EU Member States peaked at nearly 3 in 10 in Luxembourg (29.1 %) and Ireland (29.4 %).
Germany was by far the largest ‘contributor’ of export-supported employment resulting from spillover effects: in 2019, 951 000 persons employed in EU Member States other than Germany were supported by German exports.
Manufacturing exports supported 22.6 million persons employed in the EU in 2019, 60.5 % of all export-supported employment. Just over half (53.9 %) of the employment supported by manufacturing exports was within manufacturing itself.
Share of employment in each Member State supported by the exports of all Member States to non-member countries, 2019
The production of goods and services is based on inputs which may have been sourced domestically or globally. The final value of a product may well reflect value that has been added in many stages through the combination of factors of production, including employment. The employment input may have been located in many different countries.
An analysis of the employment content of exports of goods and services can provide more information on international trade relations. The aim of this article is to provide an indication of the relationship between [Glossary:Employment|employment]] and trade in the European Union (EU), by analysing the employment content of EU exports at a detailed industry [1] level.
The article aims to give an overview of the data compiled using the FIGARO tables — full International and global accounts for research in input-output analysis — and the Leontief input-output model (Miller and Blair, 2009). For more information, see the Data Sources and Context sections below.
Full article
Whole economy — all industries combined
Number and share of persons employed
The number of persons employed in the EU or in individual EU Member States that are supported by exports includes not only employment in enterprises that are directly exporting, but also in other enterprises which provide goods or services that support the production of exported goods and services; in other words, employment in upstream enterprises is also included. This may concern employment in enterprises in the same industry as the exporter or in a different one (depending, in part, how detailed an activity classification is used). Equally, exports by enterprises in one Member States may support value added in the same Member State or in a different one.
It should be noted that, regardless of whether presenting data for the EU as a whole or for individual EU Member States, all references to exports in this article concern exports to non-member countries, in other words extra-EU exports; trade between Member States is not considered.
In 2019, the employment of 37 million people was supported by exports to non-member countries. In relative terms, this export-supported employment was 17.9 % of total employment (209 million), equivalent to just over one in six persons employed across the EU.
In absolute terms, Germany was the EU Member State with the highest level of employment supported by exports from any of the EU Member States: in 2019, the employment of 9.3 million people in Germany was supported by exports from the EU, including exports from Germany itself. The level of export-supported employment in Germany was more than the combined level of export-supported employment in France (4.5 million) and Italy (4.4 million), which had the second and third highest levels (see Table 1). As a share of total employment, the employment in each of the EU Member States that was supported by exports from any of the EU Member States ranged from around one in eight persons employed in Greece (12.2 %) and Portugal (12.5 %) to nearly 3 out of every 10 in Luxembourg (29.1 %) and Ireland (29.4 %).
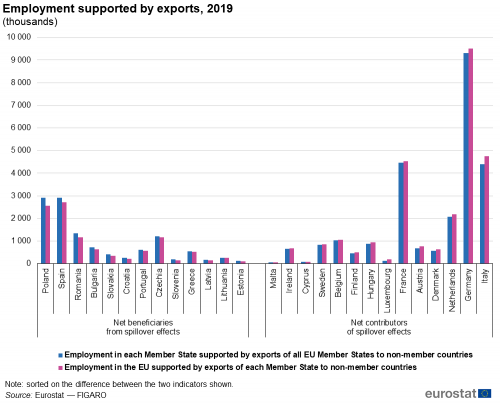
As well as the export-supported employment indicator shown in Table 1, a second indicator has been compiled, which shows the level of employment anywhere in the EU that is supported by the exports from a particular EU Member State. Figure 1 compares these two indicators. The figure has been ranked on the difference between the two indicators.
The EU Member States on the left-hand side of the figure are ones that benefit more (in employment terms) from exports from other Member States than the employment they support in other Member States through their own exports: in other words, they are net beneficiaries from cross-border spillover effects (see Box 1 for an explanation of domestic and spillover effects). For example, employment of 2.9 million persons in Poland was supported by exports from any of the EU Member States (including from Poland), whereas 2.6 million persons were employed across the EU (some of which were in Poland) and supported by exports from Poland; the difference was 367 000 persons employed. All three Baltic Member States were net beneficiaries from spillover effects, as were all of the eastern Member States except for Hungary, as well as Greece, Portugal and Spain.
The EU Member States on the right-hand side of Figure 1 are those that benefit less in employment terms from exports from other Member States than the employment they support in other Member States through their own exports: these Member States are therefore net contributors of cross-border spillover effects. For example, employment of 4.4 million persons in Italy was supported by exports from any of the EU Member States (including from Italy), whereas 4.7 million persons were employed across the EU (some of which were in Italy) and supported by exports from Italy; the difference was 346 000 persons employed. All three Nordic Member States were net contributors of spillover effects, as were all of the western Member States, as well as Malta, Cyprus, Italy and Hungary.
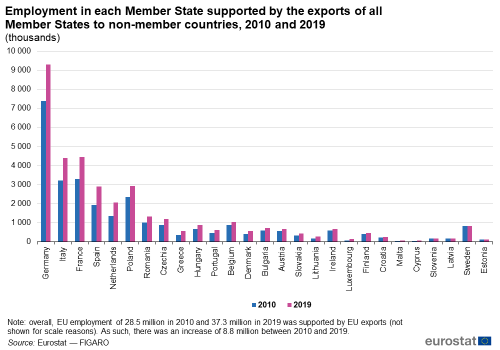
Figure 2 focuses on export-supported employment within each EU Member State (supported by exports from anywhere in the EU). All EU Member States except for Estonia recorded an increase in export-supported employment between 2010 (which was during the recovery from the global financial and economic crisis) and 2019 (just before the COVID-19 crisis).
The share of export-supported employment in total employment in the EU increased from 14.6 % in 2010 to 17.9 % in 2019. Overall, export-supported employment in the EU increased by 8.8 million during this period. Just over one fifth of the increase (1.9 million persons employed; 21.8 % of the EU total) was located in Germany, with the next largest increases in Italy (1.2 million persons employed; 13.5 % of the EU total), France (1.2 million persons employed; 13.3 % of the EU total) and Spain (1.0 million persons employed; 11.2 % of the EU total).
In relative terms, the largest increases in export-supported employment between 2010 and 2019 were in Malta (up 89.0 %), Luxembourg (73.8 %) and Greece (60.9 %), while increases of more than 50.0 % were also observed in Lithuania, the Netherlands and Spain.
Domestic and spillover effects
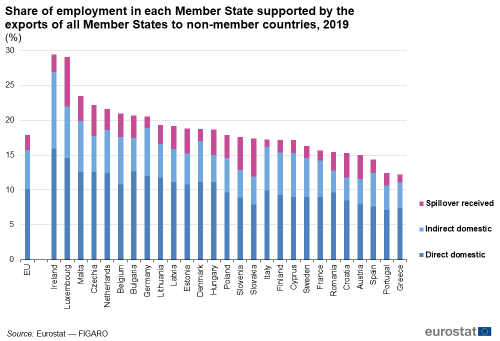
The share of export-supported employment within each EU Member State can be divided up into two parts — the domestic effect and the spillover effect received — with a further division of the domestic effect between direct and indirect effects: see Box 1 for more information. The share of total employment in each Member State that is supported by these effects is presented in Figure 3.
Box 1: What are domestic and spillover effects?
The spillover received effect reflects the employment in a given EU Member State that is supported by the exports of other Member States. For example, it includes employment in a Member State engaged in the production of intermediate inputs to be used in other Member States’ exports to non-member countries.
The domestic effect is employment in a given EU Member State that is supported by its own exports. This employment may be:
- in the same industry as the one that exported the goods or services — direct, or
- in another industry — indirect.
As such, the indirect domestic effect is effectively an industrial spillover effect within a single EU Member State — it is employment in a particular industry that is supported by the exports of a different industry (within the same Member State).
In this article, the analysis splitting the domestic effect into a direct and indirect effect has been based on an analysis of the economy dividing it into 21 different industries (the section level of the EU’s activity classification called NACE). Examples of industries at this level of detail are manufacturing, distributive trades, or information and communication services. If a more detailed level of classification would be used, then the direct domestic effect would be smaller and the indirect domestic effect would be larger. For example, it is common for manufactured goods to pass through several stages of processing (each resulting in an intermediate good) before being completed (typically as a capital or consumer good). If the final good is exported by the manufacturing industry, export-supported employment in upstream manufacturing processes in the same Member State would be considered as being supported by the direct domestic effect when manufacturing is considered as being just one industry; if the analysis is done at a finer level of detail, with manufacturing divided up into several industries, some of the upstream employment may be in manufacturing industries that are different from the exporting manufacturing industry, and would therefore be considered as being supported by the indirect domestic effect.
For example, dividing the whole economy into 64 different industries, manufacturing is divided into 19 divisions (or regroupings of divisions). In 2017 in Germany, exports from one of these, the manufacture of motor vehicles, trailers and semi-trailers, supported 185 400 persons employed in other manufacturing activities within Germany. This employment is considered as part of the direct domestic effect when analysing the economy in 21 industries (as all of manufacturing is considered to be one industry), but part of the indirect domestic effect when analysing the economy in 64 industries.
The direct domestic effect accounted for 10.2 % of total employment in the EU in 2019, while the indirect domestic effect accounted for 5.5 % and the spillover received effect 2.1 % (see Figure 3).
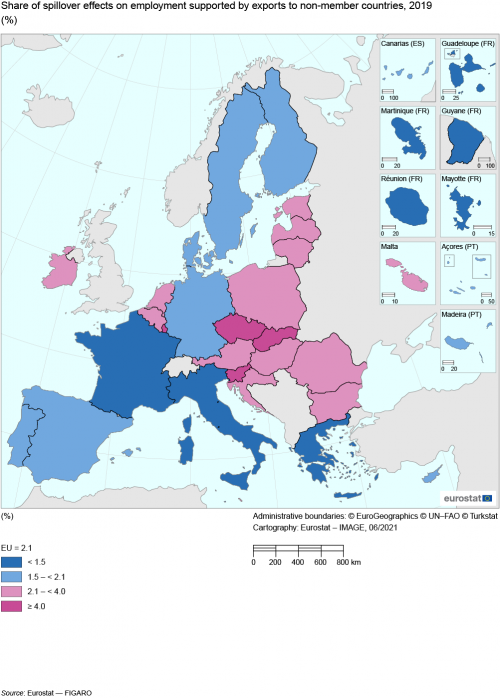
Among the EU Member States, the largest contributions to total employment of the direct domestic effect were in Ireland (16.0 %) and Luxembourg (14.6 %), while this effect contributed less than 10.0 % of employment in 14 EU Member States, with the lowest contribution observed in Portugal (7.1 %). The largest contribution to total employment of the indirect domestic effect was also in Ireland (10.9 %), followed by Luxembourg (7.4 %) and Malta (7.3 %), while the smallest contribution was in Romania (3.1 %). The largest contribution to total employment of the spillover received effect was in Luxembourg (7.1 %), followed by Slovakia (5.5 %), while the smallest contributions were in Greece and Italy (both 1.1 %) — see Map 1.
The direct domestic effect — in other words, employment in an industry in a specific EU Member State that is supported by exports from that same industry in that same Member State — accounted for 56.9 % of all export-supported employment across the EU in 2019. The direct domestic effect was the largest effect in all EU Member States, accounting for more than half of export-supported employment except in Slovakia (where the share was 45.7 %). More than three fifths of export-supported employment was due to the direct domestic effect in Greece (60.5 %), Lithuania (60.9 %), Bulgaria (61.3 %) and Romania (62.4 %).
The indirect domestic effect accounted for 31.1 % of all export-supported employment in the EU in 2019. This was the second largest effect (among the three shown in Figure 3) in all EU Member States except for Croatia, Slovenia and Slovakia (where the spillover received effect was larger). The indirect domestic effect accounted for one fifth to two fifths of export-supported employment in all Member States: the lowest share was 20.3 % in Romania while the highest was 37.1 % in Ireland.
The spillover received effect accounted for 12.0 % of all export-supported employment in the EU in 2019. The spillover received effect accounted for 6.3 % of export-supported employment in Italy and also less than 10.0 % in Germany, Ireland, Greece, Denmark and France. As such, the spillover received effect was relatively small in each of the three largest EU Member States. The spillover received effect accounted for one fifth to one quarter of export-supported employment in Czechia, Austria, Croatia and Luxembourg, 26.9 % in Slovenia and 31.5 % in Slovakia.
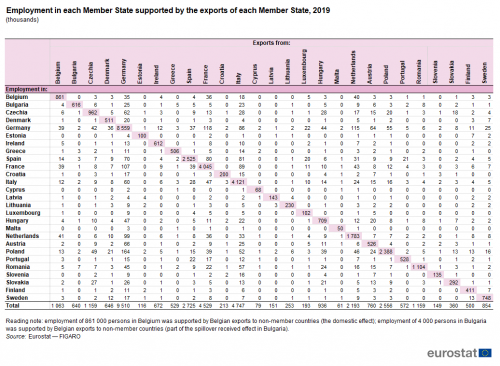
Export-supported employment from the domestic and spillover received effects are shown in absolute values in Table 2. Such employment from the domestic effect is shown in the shaded cells running in a diagonal line from the top left to the bottom right of the table.
Clearly the largest level of export-supported employment resulting from the domestic effect was in Germany, where 8.6 million persons employed were supported by Germany’s own exports, with the next largest domestic effects observed in Italy (4.1 million) and France (4.0 million).
The single largest spillover effect between any pair of countries was the 164 000 persons employed in Poland in 2019 who were supported by German exports. Three other country pairings had spillover effects that concerned more than 100 000 persons employed: 118 000 persons employed in Germany who were supported by French exports; 115 000 persons employed in Germany who were supported by Dutch exports; 107 000 persons employed in France who were supported by German exports.
Germany was by far the largest contributor of export-supported employment resulting from spillover effects: 951 000 persons employed in 2019 in EU Member States other than Germany were supported by German exports. As noted above, 164 000 of these were in Poland and 107 000 in France, while the Netherlands (99 000), Spain (70 000), Austria (66 000), Czechia (62 000) and Italy (60 000) all had more than 50 000 persons employed who were supported by German exports. For comparison, the next highest contributors were Italy (626 000 persons employed in other Member States), France (484 000) and the Netherlands (410 000). The high figure for the Netherlands may reflect, among other factors, the large distributive trades industry in the Netherlands and the fact that the port of Rotterdam — the largest maritime port within the EU in terms of the quantity of freight handled — is located in the Netherlands.
Industries
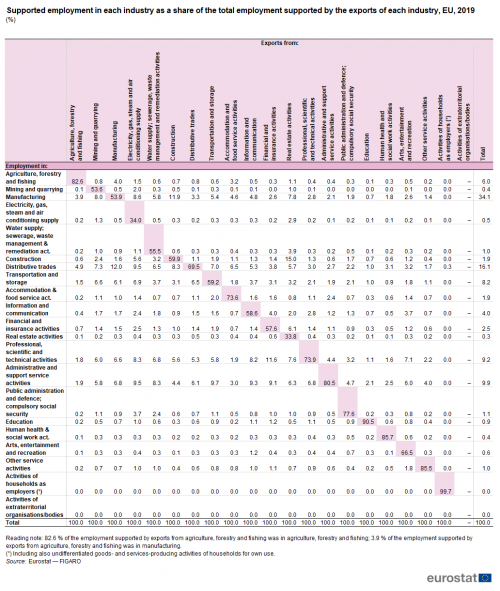
Whereas Table 2 focused on employment in EU Member States that was supported by exports from themselves (domestic effect) or other Member States (spillover effect), Table 3 provides a similar analysis for industries. This presentation reveals the extent to which employment in specific industries is dependent on exports from the same industry or from other (downstream) industries. Unlike Table 2, Table 3 does not show absolute values of the number of persons employed, presenting instead shares. The shares in each column sum to 100.0 %: each column shows the distribution (among employing industries) of employment that is supported by exports from a specific industry.
The share of export-supported employment within the same industry as the export industry is shown in the shaded cells running in a diagonal line from the top left to the bottom right of the table. The highest share [2] was observed for education: in 2019, 90.5 % of all employment in the EU that was supported by exports from the education industry was in the education industry itself; the 20 other industries accounted for the remaining 9.5 % of employment supported by exports from the education industry, with the administrative and support service activities industry the largest beneficiary (2.1 %) of export-supported employment from industrial spillover effects.
By contrast, two industries had shares along this diagonal that were below half. For employment supported by exports from the water supply, sewerage, waste management and remediation activities industry, 34.0 % was in the same industry, and close to one tenth was in each of distributive trades (9.5 %), administrative and support service activities (9.5 %), manufacturing (8.6 %), and professional, scientific and technical activities (8.3 %). For employment supported by exports from the real estate activities industry, 33.8 % was in the same industry, 15.0 % was in construction, 7.8 % in manufacturing and 7.6 % in professional, scientific and technical activities (which includes, among others, the activities of notaries, architectural and engineering services).
Based on these percentage shares, the single largest industrial spillover effect between any pair of industries was the 15.0 % noted above for employment in construction supported by exports from the real estate industry. Three other industry pairings had industrial spillover effects where the shares were more than one tenth of employment supported by exports from a particular industry: 12.0 % of the employment supported by manufacturing exports was in distributive trades; 11.9 % of the employment supported by construction exports was in manufacturing; 11.6 % of the employment supported by exports of the financial and insurance activities industry was in the professional, scientific and technical activities industry.
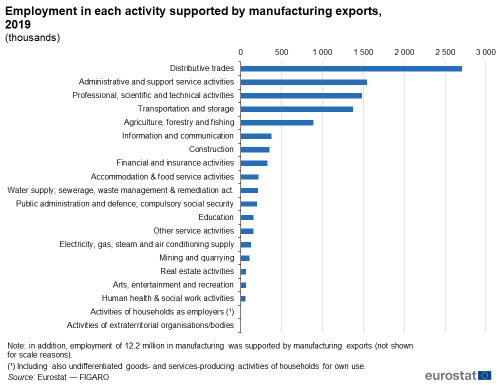
In absolute terms, the picture is somewhat different, as manufacturing exports alone supported 22.6 million persons employed in the EU in 2019, equivalent to three fifths (60.5 %) of all export-supported employment in the EU; 12.2 million of this total were employed within manufacturing itself, with the remaining 10.4 million representing the industrial spillover effect within the remaining 20 industries. The eight largest industry pairings for export-supported employment resulting from industrial spillover effects all concerned employment in industries outside the manufacturing industry itself that was supported by manufacturing exports. For example, 2.7 million persons employed in distributive trades were supported by manufacturing exports, as were 1.5 million persons in administrative and support service activities, 1.5 million persons in professional, scientific and technical activities, and 1.4 million persons in transportation and storage (see Figure 4).
The largest pairing of industrial spillover effects that did not involve manufacturing was the 261 000 persons employed in transportation and storage who were supported by exports from distributive trades.
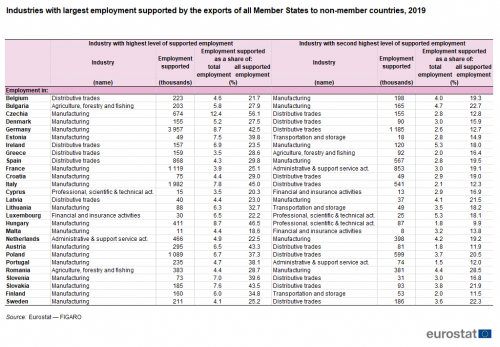
Table 4 identifies for each of the EU Member States which two industries had the highest level of export-supported employment. In 17 of the Member States, manufacturing had the highest level of export-supported employment in 2019, while there were seven more where manufacturing had the second highest level. Greece, Cyprus and Luxembourg were the exceptions where manufacturing was not one of the two industries with the highest level of export-supported employment. The next most common industry was distributive trades, which had the highest level of export-supported employment in five Member States and the second highest in 10 more.
Five other industries appear in Table 4, each three times: administrative and support service activities (France, the Netherlands and Portugal); agriculture, forestry and fishing (Bulgaria, Greece and Romania); financial and insurance activities (Cyprus, Luxembourg and Malta); professional, scientific and technical activities (Cyprus, Luxembourg and Hungary); transportation and storage (Estonia, Lithuania and Finland).
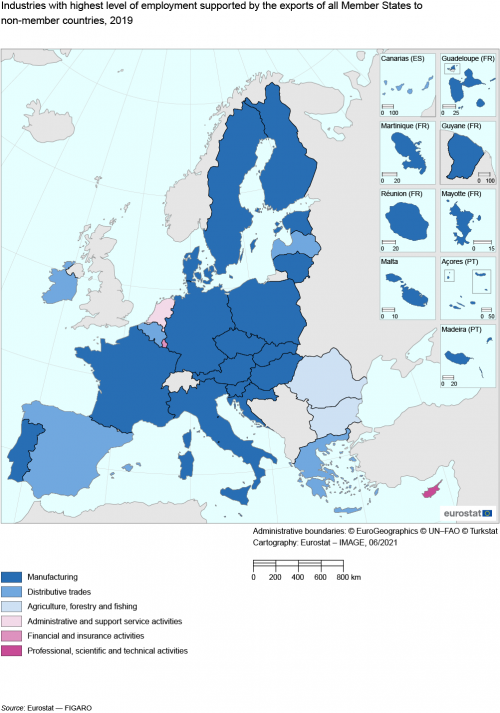
Earlier in this article it was noted that there are large industrial spillover effects from manufacturing exports, in the sense that a considerable number of persons employed in other industries are supported by exports from the manufacturing industry. Despite this large contributor effect, in most of the EU Member States — including the three largest ones — manufacturing still had the highest level of employment supported by exports (from any industry), as can be seen from Map 2.
Source data for tables and graphs
![]() Employment content in EU exports: tables and figures
Employment content in EU exports: tables and figures
All FIGARO data for employment are available from the following files:
Data sources
The FIGARO tables are based on two key inputs.
1. A full set of national supply, use and input-output tables that are:
- based on the ESA 2010 methodology;
- very closely aligned with data sent by EU Member States in accordance with the ESA 2010 programme and that meet the quality criteria for official statistics.
In the absence of official national tables submitted by the EU Member States, Eurostat estimates these based on supply and use tables at basic prices and valuation matrices.
2. A balanced view of trade flows, involving trade for each EU Member State with its trade partners within the EU (intra-EU trade) and with non-member countries (extra-EU trade).
Concerning trade data, compiling a single balanced trade flow from two sets of bilateral trade flows (one provided by the exporting territory and one by the importer) requires the implementation of a methodology to remove trade asymmetries, among other kinds of imputations.
Frequency and availability
The aim is to produce FIGARO tables every year.
FIGARO data are available for the years 2018 and 2019 with an analysis of the whole economy in 21 different industries. A more detailed dataset, with the whole economy divided into 64 different industries, is currently available for the years from 2010 to 2017.
More information
For more information, please refer to the FIGARO dedicated section.
Context
Partners
The FIGARO tables result from a collaborative project between Eurostat and the European Commission’s Joint Research Centre.
The FIGARO tables contribute to the OECD’s global inter-country input-output tables published under the TiVA initiative, which considers the value added by each country in the production of goods and services that are consumed worldwide.
Purpose
The FIGARO tables provide the first official inter-country supply, use and input-output data for the EU. They are a tool for analysing the social, economic and environmental effects of globalisation in the EU. These may be analysed through studies on competitiveness, growth, productivity, employment, environmental footprint and international trade (for example, analyses of global value chains).
The tables are used to evaluate EU policies and assess the position of the EU (or the euro area or individual EU Member States) in the world.
More information
For more information, please refer to:
Notes
- ↑ The terms industry/industries are used in this article as synonyms for activity/activities, in the sense of the activities listed in the NACE classification.
- ↑ Leaving aside the small and somewhat atypical industry of activities of households as employers and undifferentiated goods- and services-producing activities of households for own use.
Direct access to
- Data can be accessed through the dedicated section as csv files and Rdata files.
