Archive:Extra-EU trade in manufactured goods
Data from April 2021
Planned update: April 2022
Highlights
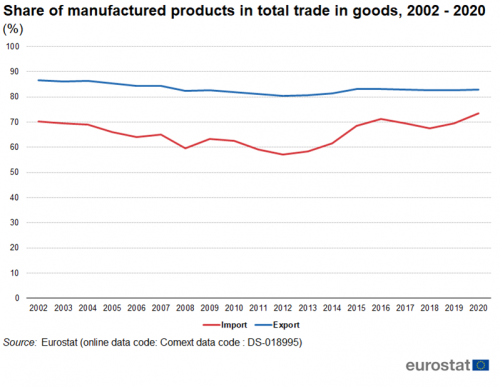
In 2020, manufactured goods made up 83 % of all EU exports and 74 % of EU imports.
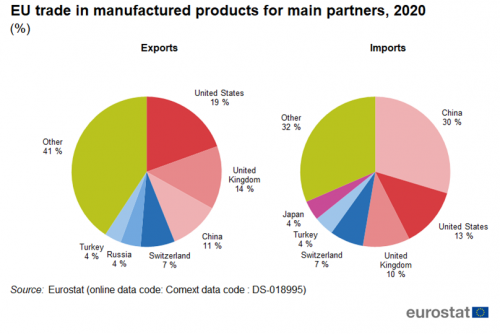
The United States, the United Kingdom and China were the main EU trading partners for manufactured goods in 2020.
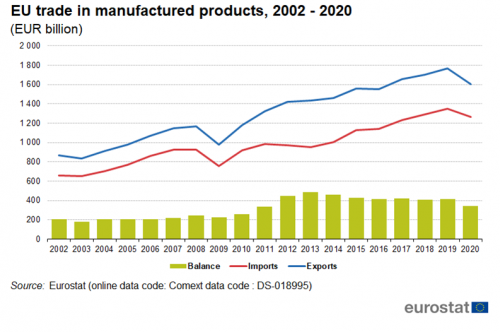
EU-27 imports, exports and trade balance in manufactured products, 2002-2019
This article focuses on the structure and evolution of the European Union (EU) international trade in manufactured goods: imports and exports at EU level.
This article is part of an online publication providing recent statistics on international trade in goods, covering information on the EU's main partners, main products traded, specific characteristics of trade as well as background information.
Full article
The Standard international trade classification (SITC) distinguishes four main groups (sections) of manufactured goods:
- chemicals (SITC 5);
- manufactured goods classified chiefly by material (SITC 6);
- machinery and vehicles (SITC 7);
- miscellaneous manufactured articles (SITC 8).
Categories 6 and 8 are often grouped together as 'other manufactured goods'. This grouping is also used in this article.
Manufactured goods dominate international trade
The share of manufactured goods in total exports of goods was 87 % in 2002 (Figure 1). It had had its lowest value in 2012 at 80 % then gradually recovered, standing at 83 % in 2020. There was more fluctuation in the share of manufactured goods in total imports of goods. It was 70 % in 2002. It had its lowest value in 2012 at 57 % and peaked in 2020 at 74 %. These fluctuations in the share of imports are closely correlated to price developments of energy products.
Between 2002 and 2019, exports of manufactured goods increased from EUR 865 billion to EUR 1 764 billion (Figure 2). Due to the Covid-19 pandemic exports fell to EUR 1 602 billion in 2020. Imports of manufactured goods increased from EUR 662 billion in 2002 to EUR 1 347 in 2019 but then fell to EUR 1 262 billion in 2020. In this period, the trade balance increased from EUR 204 billion in 2002 to EUR 340 billion in 2020. It had its lowest value of EUR 182 billion in 2003 and peaked in 2013 at EUR 483 billion.
The United States was the largest export partner for manufactured goods in 2020 with a share of 19 %, followed by the United Kingdom (14 %) and China (11 %). The top six partners accounted for 59 % of total exports of manufactured goods. China was the largest import partner for manufactured goods in 2020 with a share of 30 %, followed by the United States (13 %) and the United Kingdom (10 %). The top six partners accounted for 68 % of total imports of manufactured goods.
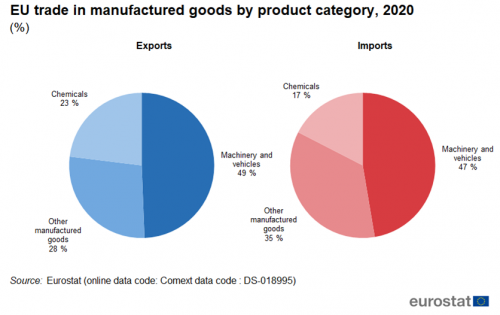
Within manufactured goods, machinery and vehicles was the largest group, both in exports (49 %) and imports (47 %). In both cases other manufactured goods was the second largest group (28 % in exports and 35 % in imports) followed by chemicals (23 % in exports and 17 % in imports).
In the next three paragraphs these three groups are discussed in more detail.
Road vehicles largest category in exports of machinery and vehicles
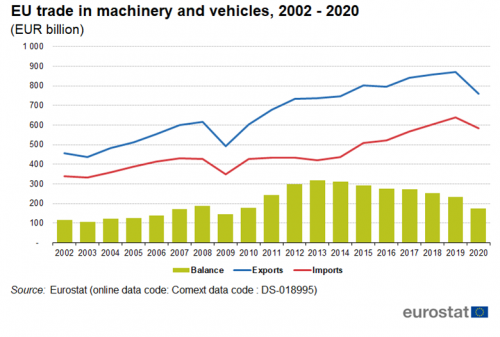
Between 2002 and 2019, exports of machinery and vehicles increased by from EUR 455 billion to EUR 871 billion but then fell to EUR 759 billion (Figure 5). Imports between 2002 and 2019 increased from EUR 338 billion to EUR 638 billion but then fell to EUR 585 billion. There was a trade surplus throughout the whole period. It had its lowest value of EUR 106 billion in 2003 and peaked in 2013 at EUR 317 billion. It gradually declined to EUR 234 billion in 2019 and then fell sharply to EUR 174 billion in 2020.
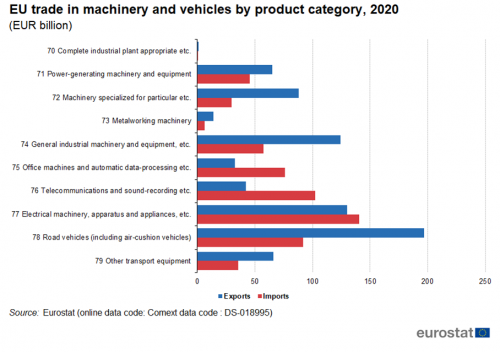
The largest category in exports of machinery and vehicles was road vehicles with 26 % (Figure 6). It was followed by electrical machinery and parts thereof (17 %) and general industrial machinery and equipment and (16 %). The largest category in imports of machinery and vehicles was electrical machinery and parts thereof with 24 %. It was followed by telecommunications and sound-recording with (17 %) and road vehicles (16 %).
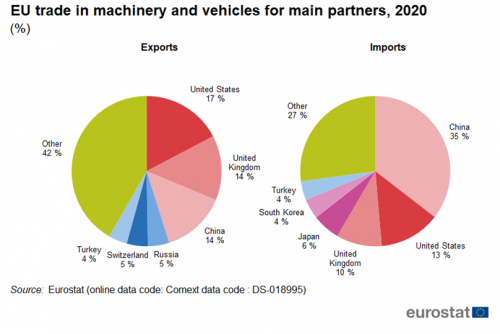
The United States was the largest export partner for machinery and vehicles in 2020 with a share of 17 %, followed by the United Kingdom and China (both 14 %) (Figure 7). The top six partners accounted for 58 % of total exports of machinery and vehicles. China was the largest partner for imports of machinery and vehicles in 2020 with a share of 35 %, followed by the United States (13 %) and the United Kingdom (10 %). The top six partners accounted for 73 % of total imports of machinery and vehicles.
China accounts for almost a third of the imports of other manufactured goods
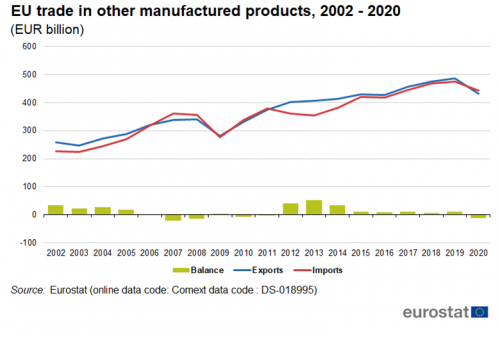
Between 2002 and 2019, exports of other manufactured goods increased from EUR 259 billion to EUR 486 billion before dropping to EUR 432 billion in 2020 (Figure 8). Between 2002 and 2019, imports of other manufactured goods increased from EUR 226 billion to EUR 474 billion before falling to EUR 444 billion in 2020. The trade balance fluctuated considerably between 2002 and 2020. In 2002 it was EUR 33 billion, it dropped to lowest value of EUR -21 billion in 2007 and peaked in 2013 at EUR 52 billion. From 2019 to 2020 it went from a surplus of EUR 12 billion to a deficit of EUR 12 billion.
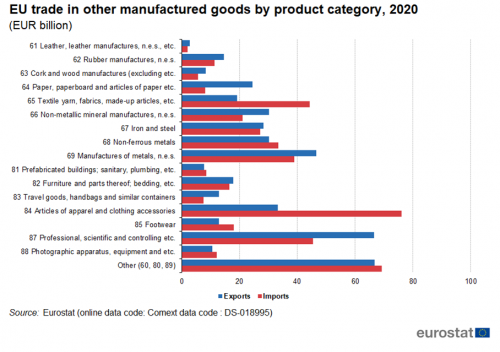
The largest categories in exports of other manufactured goods were miscelaneous manufactured articles and professional, scientific and controlling equipment, each with 15 % (Figure 9). The largest category in imports of other manufactured goods was articles of apparel and clothing accesories with 17 %, followed by miscelaneous manufactured articles with 16%.
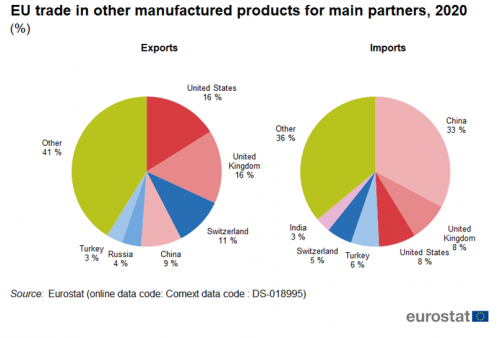
The United States and the United Kingdom were the largest export partners for other manufactured goods in 2020 with a share of 16 % each (Figure 10). The top six partners accounted for 59 % of total exports of other manufactured goods. China was the largest import partner for other manufactured goods in 2020 with a share of 33 %. The top six partners accounted for 64% of total imports of other manufactured goods.
Despite the Covid-19 crisis, exports of chemicals grew in 2020
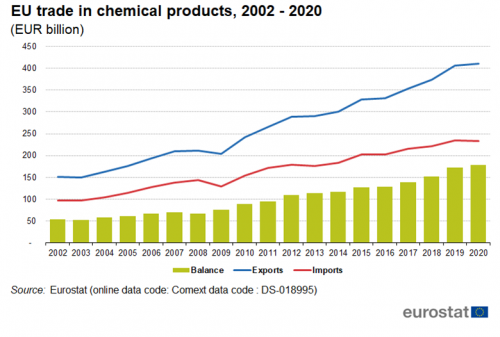
Between 2002 and 2019, exports of chemicals increased from EUR 151 billion to EUR 407 billion and despite the Covid-19 crisis increased to EUR 411 billion in 2020 (Figure 15). Between 2002 and 2019 imports of chemicals increased from EUR 97 billion to EUR 236 billion and only fell slightly in 2020 to EUR 233 billion. Between 2002 and 2020, the trade balance increased from EUR 54 billion to a peak of EUR 178 billion in 2020.
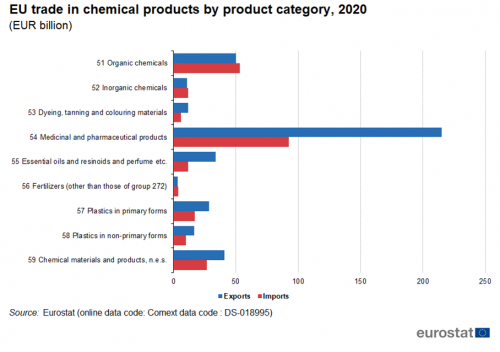
The largest category in exports of chemicals was medicinal and pharmaceutical products with 52 % (Figure 12). It was followed by organic chemicals with 12 %. The largest category in imports of chemicals was also medicinal and pharmaceutical products with 40 %. Again it was followed by organic chemicals with 23 %.
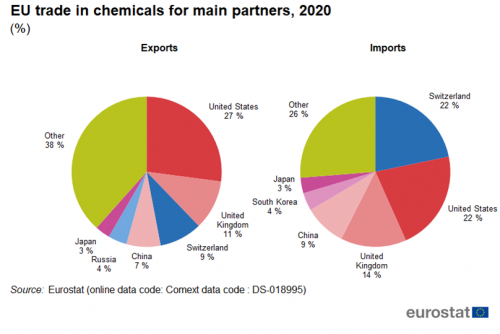
The United States was the largest export partner for chemicals in 2020 with a share of 27 %, followed by the United Kingdom with 11 % (Figure 13). The top six partners accounted for 62 % of total exports of chemicals. Switzerland and the United States were the largest import partners for chemicals in 2020, each with a share of 22 %. The top six partners accounted for 74 % of total imports of chemicals.
Product categories
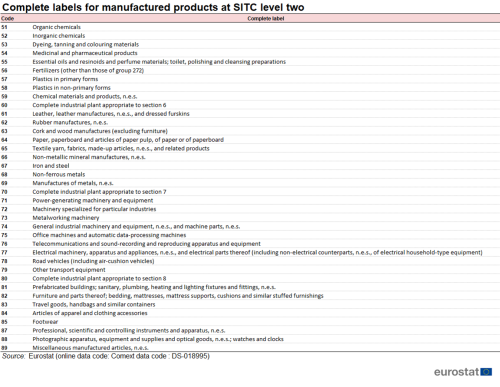
Some of the labels in Figures 7, 11, 12 and 16 have been shortened for graphical reasons. The complete label for each category is shown in the table below.
Source data for tables and graphs
Data sources
EU data come from Eurostat’s COMEXT database. COMEXT is the Eurostat reference database for international trade. It provides access not only to both recent and historical data from the EU Member States but also to statistics of a significant number of third countries. International trade aggregated and detailed statistics disseminated from Eurostat website are compiled from COMEXT data according to a monthly process. Because COMEXT is updated on a daily basis, data published on the website may differ from data stored in COMEXT in case of recent revisions.
EU data are compiled according to community guidelines and may, therefore, differ from national data published by Member States. Statistics on extra-EU trade are calculated as the sum of trade of each of the 27 Member States with countries outside the EU. In other words, the EU is considered as a single trading entity and trade flows are measured into and out of the area, but not among Member States within the EU.
The United Kingdom is considered as an extra-EU partner country for the EU for the whole period covered by this article. However, the United Kingdom was still part of the internal market until the end of the transitory period (31 December 2020), meaning that data on trade with the United Kingdom are still based on statistical concepts applicable to trade between the EU Member States. Consequently, while imports from any other extra-EU trade partner are grouped by country of origin, the United Kingdom data reflect the country of consignment. In practice this means that the goods imported by the EU from the United Kingdom were physically transported from the United Kingdom but part of these goods could have been of other origin than the United Kingdom. For this reason, data on trade with the United Kingdom are not fully comparable with data on trade with other extra-EU trade partners.
Unit of measure
Trade values are expressed in billions (109) of euros. They correspond to the statistical value, i.e. to the amount which would be invoiced in case of sale or purchase at the national border of the reporting country. It is called a FOB value (free on board) for exports and a CIF value (cost, insurance, freight) for imports.
Context
The EU is the world's biggest exporter of manufactured goods, and is a global market leader for high-quality products. Thanks to some of its key assets such as chemicals, pharmacy products, motor vehicles and non-electrical machinery, the European Union has a substantial trade surplus for manufactured products.
Direct access to
- International trade data (t_ext)
- International trade long-term indicators (t_ext_lti)
- International trade short-term indicators (t_ext_sti)
- International trade data (ext)
- International trade long-term indicators (ext_lti)
- International trade short-term indicators (ext_sti)
- International trade detailed data (detail)
- International trade in goods statistics - background
- International trade in goods (ESMS metadata file — ext_go_agg_esms)
- User guide on European statistics on international trade in goods
- Regulation (EC) No 471/2009 of 6 May 2009 on Community statistics relating to external trade with non-member countries
- Summaries of EU Legislation: Extrastat: statistics relating to trade with non-EU countries
- Regulation (EU) No 92/2010 of 2 February 2010 implementing Regulation (EC) No 471/2009, as regards data exchange between customs authorities and national statistical authorities, compilation of statistics and quality assessment
- Regulation (EU) No 113/2010 of 9 February 2010 implementing Regulation (EC) No 471/2009 , as regards trade coverage, definition of the data, compilation of statistics on trade by business characteristics and by invoicing currency, and specific goods or movements.
