Archive:Farm structure statistics
- Data from December 2015. Most recent data: Further Eurostat information, Main tables and Database. Planned article update: April 2019.
(hectares)
Source: Eurostat (ef_kvaareg)

(%)
Source: Eurostat (ef_lflegaa) and (ef_lfwtime)
(%)
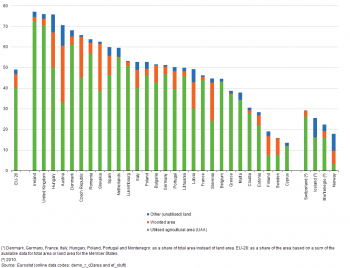
Source: Eurostat (demo_r_d3area) and (ef_oluft)
(% share of utilised agricultural area)
Source: Eurostat (ef_oluft)
The structure of agriculture in the Member States of the European Union (EU) varies as a function of differences in geology, topography, climate and natural resources, as well as the diversity of regional activities, infrastructure and social customs. The survey on the structure of agricultural holdings, also known as the farm structure survey (FSS), helps assess the agricultural situation across the EU, monitoring trends and transitions in the structure of agricultural holdings, while also modelling the impact of external developments or policy proposals.
This article presents some statistics from the most recent farm structure survey that was conducted in 2013 and in several cases compares these with results from the census in 2009 or 2010 and the previous farm structure survey in 2007. It should be noted that some methodological and legislative changes occurred between the 2007 and 2009 or 2010 surveys.
Main statistical findings
The size of agricultural holdings
In 2013, there were 10.8 million agricultural holdings within the EU-28. An analysis by economic size shows that among these there were 6.5 million (or 59.8 %) that had a standard output in excess of EUR 2 000. The utilised agricultural area (UAA) in the EU-28 was almost 175 million hectares (some 40.0 % of the total land area), giving an average size of 16.1 hectares per agricultural holding.
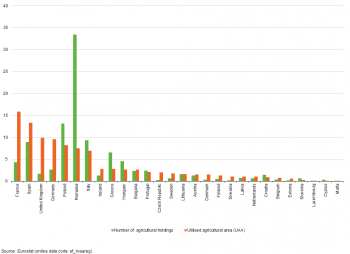
In terms of utilised agricultural area, France and Spain had the largest share of the EU-28’s agricultural land, with 15.9 % and 13.3 % shares respectively, while the United Kingdom and Germany had shares just under 10.0 % — see Figure 1. By contrast, the largest number of agricultural holdings was in Romania (3.6 million), where one third (33.5 %) of all the holdings in the EU-28 were located. Poland had the second highest share of agricultural holdings (13.2 %), some way ahead of Italy (9.3 %) and Spain (8.9 %).
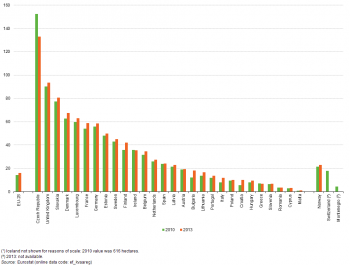
The difference between the shares in terms of the number of holdings or the utilised agricultural area (as shown in Figure 1) reflects the average size of agricultural holdings, which is shown Figure 2. By far the largest average size of agricultural holdings in any of the EU Member States in 2013 was the 133 hectares recorded for the Czech Republic, with the second highest average recorded in the United Kingdom at 94 hectares. Six Member States reported average sizes below 10.0 hectares, with the smallest averages in Romania, Cyprus and Malta.
The average size of agricultural holdings in the EU-28 increased from 14.4 hectares per holding in 2010 to 16.1 hectares per holding in 2013, resulting from an 11.5 % fall in the number of holdings and a 0.7 % fall in the utilised agricultural area. Most of the EU Member States recorded an increase in the average utilised agricultural area per holding between 2010 and 2013 with the Czech Republic recording the only substantial fall; there were smaller reductions recorded in Greece and Ireland.
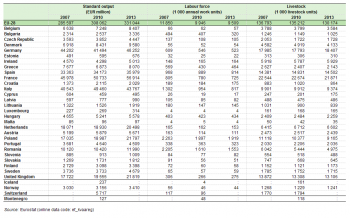
As well as determining the size of farms in terms of their agricultural area, economic size can be determined by reference to the standard output, in other words, the value of agricultural output at farm-gate prices. Based on this measure, agricultural output in the EU-28 increased (in current price terms) between 2007 and 2010 by 7.9 % and by a further 7.5 % between 2010 and 2013 (see Table 1). In most of the EU Member States, growth was reported between these pairs of years, although there were falls in excess of 10.0 % between 2007 and 2010 in Greece and Cyprus and between 2010 and 2013 in Italy; there were smaller reductions between 2007 and 2010 in Germany and Ireland (while in Sweden output was more or less unchanged), and between 2010 and 2013 in Croatia, Austria and Portugal. Growth above 20.0 % was observed in seven Member States between 2007 and 2010 and in four Member States between 2010 and 2013, with Latvia the only Member State to record such a level of growth in both periods.
The farm labour force
The total farm labour force in the EU-28 was the equivalent of 9.5 million annual working units in 2013, of which 8.7 million (92 %) were regular workers (see Figure 3). The overall change in the EU-28’s farm labour force during the period 2007–13 was a fall of 2.3 million annual work units (AWU), equivalent to a reduction of 19.8 %. Between 2007 and 2013, the farm labour force fell in nearly all of the EU Member States, the notable exceptions being Ireland, Hungary and Malta where the labour force increased. In percentage terms, the largest falls were recorded in Slovakia, Italy, Cyprus and Bulgaria, all of which saw their respective labour forces contract by at least one third.
Regular workers made up more than four fifths of the farm labour force in each of the EU Member States, with their share lowest in Spain at 81 %, while in Latvia practically all members of the farm labour force were regular workers. Among regular workers, the division between full-time and other workers varied greatly between the EU Member States. Full-time regular workers made up more than half of the farm labour force in 11 Member States, peaking at nearly three quarters (74 %) in Luxembourg. By contrast, the share of full-time regular workers in the farm labour force was between one quarter and one fifth in Austria, Croatia and Lithuania, this share falling as low as 7 % in Romania.
Livestock units
The EU-28's livestock herd was 130 million livestock units (LSU) in 2013. The total number of livestock in the EU-28 decreased between 2007 and 2013 by 6.6 million LSU, equivalent to a fall of 4.8 % (see Table 1). A total of 21 EU Member States recorded a fall in livestock numbers between these years, with reductions that were close to 30 % in Cyprus and Malta. Among the seven EU Member States with a higher number of livestock in 2013 than in 2007, the increases recorded were less than 1.0 % in Ireland, Portugal and Spain, either side of 2.0 % in Finland and Germany, and peaked at just less than 3.0 % in Luxembourg and the Netherlands.
Agricultural land use
Utilised agricultural area accounted for two fifths (40.0 %) of the total land area of the EU-28 in 2013, with a further 9.0 % of the land belonging to agricultural holdings, either in the form of wooded areas (6.7 %) or other land not used for agriculture (2.3 %) — see Figure 4. The proportion of the land area that was utilised agricultural area rose to nearly three quarters (72.5 %) in Ireland and was more than two thirds of the total (70.5 %) in the United Kingdom; by contrast, the utilised agricultural area accounted for less than one tenth of the land area in Sweden (7.5 %) and Finland (7.4 %). These two Nordic Member States were the only EU Member States where wooded areas belonging to agricultural holdings accounted for a higher share of the land area than that used for agricultural purposes.
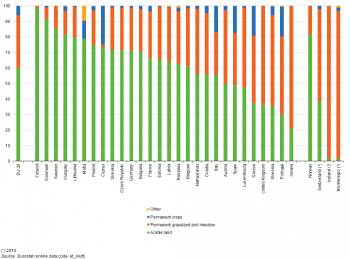
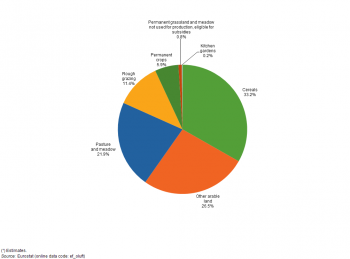
Arable land (which includes land for cereals and other arable land) accounted for three fifths (59.8 %) of the utilised agricultural area in the EU-28 in 2013 (see Figure 5), with permanent grassland and meadow (which is composed of pasture, meadow and rough grazing) accounting for just over one third (34.2 %). Permanent crops, such as vineyards, olive trees and orchards, accounted for a 5.9 % share, with the remaining 0.2 % mainly attributed to kitchen gardens.
The relative importance of arable land varied greatly between the EU Member States, with its share of the utilised agricultural area ranging from 35.6 % in Slovenia to 81.6 % in Hungary, with the Nordic Member States of Sweden (85.1 %), Denmark (91.5 %) and Finland (98.5 %) above this range and Portugal (30.2 %) and Ireland (21.0 %) below it. The share of permanent grassland and meadow, associated with livestock rearing (notably dairy and sheep farming), exceeded 50 % in Luxembourg, Slovenia, the United Kingdom and Ireland, while it was below 2 % in Cyprus, Finland and Malta. Permanent crops accounted for more than 10 % of the utilised agricultural area in the southern Member States associated with the growing of grapes, olives and citrus fruit, with their highest share being recorded in Cyprus (25.0 %).
Figure 6 presents a more detailed analysis of agricultural land use in the EU-28. More than half of all arable land was given over to cereals, which accounted for one third (33.2 %) of the total utilised agricultural area in 2013. Permanent grassland and meadow was predominantly pasture and meadow, which had a 21.9 % share of the total utilised agricultural area, compared with shares of 11.4 % for rough grazing and 0.8 % for permanent grassland and meadow not used for production, but eligible for subsidies.
Data sources and availability
A comprehensive farm structure survey is carried out by EU Member States every 10 years (the full scope being the agricultural census) and intermediate sample surveys are carried out three times between these basic surveys. The EU Member States collect information from individual agricultural holdings, covering:
- land use;
- livestock numbers;
- rural development (for example, activities other than agriculture);
- management and farm labour input (including age, sex and relationship to the holder).
Survey data are aggregated to different geographic levels (countries, regions, and for basic surveys also districts) and arranged by size class, area status, legal status of holding, objective zone and farm type.
In preparation for the 2010 survey a new legal basis was developed: Regulation (EC) 1166/2008 of the European Parliament and of the Council of 19 November 2008 on farm structure surveys and the survey on agricultural production methods.
The basic unit underlying the survey is the agricultural holding, a technical-economic unit under single management engaged in agricultural production. Until 2007, the farm structure survey covered all agricultural holdings with a utilised agricultural area (UAA) of at least one hectare (ha) and those holdings with a UAA of less than one hectare if their market production exceeded certain natural thresholds. Under the new legislation, the minimum threshold for agricultural holdings changed from one hectare to five hectares for the 2010 survey. The new five hectare threshold was adopted in the Czech Republic, Germany and the United Kingdom. In Luxembourg, the threshold was changed to three hectares, in Sweden to two hectares, and in the Netherlands the threshold was of a minimum of EUR 3 000 of standard output (see below for more details).
The new legislation also changed the coverage of the survey from 99 % of the standard gross margin to 98 % of the UAA (excluding common land) and 98 % of the livestock. Common land (land shared by several holdings) is not included in the UAA in the case of Bulgaria, Germany, France, Greece, Ireland, Hungary, Slovenia and the United Kingdom. In all other countries it either does not exist or has been included in the survey.
The standard output of an agricultural product (crop or livestock) is the average value of agricultural output at farm-gate prices, in euro per hectare or per head of livestock. There is a regional coefficient for each product based on an average value over five years. Until 2007, the farm structure survey used the standard gross margin to classify agricultural holdings by type of farming and by economic size but this was replaced by the concept of standard output for the 2010 census. It should be noted that the standard output excludes direct payments.
The farm labour force is made up of all individuals who have completed their compulsory education (having reached school-leaving age) and who carried out farm work on the holding under survey during the 12 months up to the survey day. The figures include holders, even when not working on the holding, whereas their spouses are counted only if they carry out farm work on the holding. The holder is the natural person (sole holder or group of individuals) or the legal person (for example, a cooperative or other institution) on whose account and in whose name the holding is operated and who is legally and economically responsible for the holding — in other words, the entity or person that takes the economic risks of the holding; for group holdings, only the main holder (one person) is counted. The regular farm labour force covers the family labour force and permanently employed (regular) non-family workers. One annual work unit (AWU) corresponds to the work performed by one person who is occupied on an agricultural holding on a full-time basis. Full-time means the minimum hours required by the national provisions governing contracts of employment. If these provisions do not explicitly indicate the number of hours, then 1 800 hours are taken to be the minimum (225 working days of eight hours each).
Context
Rural development policy aims to improve: competitiveness in agriculture and forestry; the quality of the environment and countryside; life in rural areas; and the diversification of rural economies. As agriculture has modernised and the importance of industry and more recently services within the economy has increased, so agriculture has become much less important as a source of jobs. Consequently, increasing emphasis is placed on the role farmers can play in rural development, including forestry, biodiversity, the diversification of the rural economy to create alternative jobs and environmental protection in rural areas.
The common agricultural policy (CAP) has been frequently reformed in an attempt to modernise the sector and make it more market-oriented. After almost two years of negotiations between the European Commission, the European Parliament and the Council, a political agreement on the reform of the CAP was reached on 26 June 2013. The agreement was designed to lead to far-reaching changes: making direct payments fairer and greener, strengthening the position of farmers within the food production chain, and making the CAP more efficient and more transparent, while providing a response to the challenges of food safety, climate change, growth and jobs in rural areas, thereby helping the EU to achieve its Europe 2020 objectives of promoting smart, sustainable and inclusive growth. In December 2013, the latest reform of the CAP was formally adopted by the European Parliament and the Council. The farm structure survey continues to be adapted with the aim of trying to provide timely and relevant data to help analyse and follow these developments.
See also
- 2007 farm structure survey — includes links to articles for the EU, for individual EU Member States as well as EFTA countries
- 2010 agricultural census — includes links to articles for the EU, for individual EU Member States as well as EFTA countries
- Agri-environmental indicators
- Farm structure survey (FSS)
Further Eurostat information
Publications
- Agriculture, forestry and fishery statistics — 2013 edition (Pocketbook)
- Agriculture, fishery and forestry statistics — Main results — 2010–11 — 2012 edition (Pocketbook)
- Agricultural statistics — Main results 2008–09 (Pocketbook)
- Agriculture — Main statistics 2005–2006 (Pocketbook)
Main tables
- Agriculture (t_agri), see:
- Farm structure: historical data (1990-2007) (t_ef)
Database
- Agriculture (agri), see:
- Farm structure (ef)
- Farm structure - 2008 legislation (from 2005 onwards) (ef_main)
- Key farm variables (ef_kv)
- Overview - Farm land use (ef_olu)
- Overview - Farm livestock (ef_ols)
- Overview - Farm labour force (ef_olf)
- Farm land use - Arable land (ef_ala)
- Farm land use - Permanent crops, other farmland, irrigation (ef_po)
- Farm livestock and fodder crops (ef_lsf)
- Farm labour force (ef_lf)
- Other gainful activities and support for rural development (ef_oga)
- Farm management and practises (ef_mp)
- Survey on agricultural production methods (SAPM, 2010) (ef_pm)
- Farm structure - 1998 legislation (1990-2007) (ef_historic)
- Farm structure - 2008 legislation (from 2005 onwards) (ef_main)
Dedicated section
Methodology / Metadata
- Farm structure (ESMS metadata file — ef_esms)
- Farm structure — Methodology of Community surveys
- National methodological reports
Source data for tables, figures and map (MS Excel)
Other information
Main legislation
- Regulation 1166/2008 of the European Parliament and of the Council on farm structure surveys and the survey on agricultural production methods (farm structure survey from 2010 onwards)
- Regulation No 378/2014 of the European Parliament and of the Council of 3 April 2014 amending Regulation (EC) No 1166/2008 as regards the financial framework for the period 2014-2018
- Commission Regulation No 715/2014 of 26 June 2014 amending Annex III to Regulation (EC) No 1166/2008 of the European Parliament and of the Council on farm structure surveys and the survey on agricultural production methods, as regards the list of characteristics to be collected in the farm structure survey 2016
Implementing legislation
- Commission Regulation 1200/2009 implementing Regulation 1166/2008 on farm structure surveys and the survey on agricultural production methods (farm structure survey from 2010 onwards)
- Commission Regulation 2015/1391 amending Regulation (EC) No 1200/2009
Related and older legislation
- Commission Regulation 1242/2008 establishing a Community typology for agricultural holdings (standard output typology)
- Council Regulation 571/88 of 29 February 1988 on the organization of Community surveys on the structure of agricultural holdings between 1988 and 1997
- Commission Decision 85/377/EEC of 7 June 1985 establishing a Community typology for agricultural holdings
External links
