- Data from December 2013, most recent data: Further Eurostat information, Main tables.

Source: Eurostat (tag00057)

Source: Eurostat (tag00057)
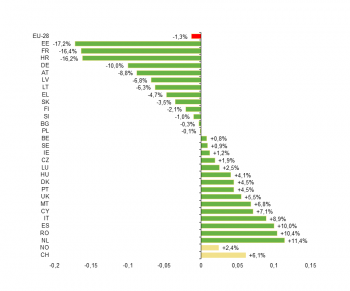
According to first estimates, real agricultural income per worker in the European Union (EU) has decreased by 1.3 % in 2013, following a increase of 0.3 % in 2012. This decline results from a reduction in real agricultural income (-2.1 %), together with a fall in agricultural labour input (-0.9 %). These estimates for the EU are based on data supplied by the national authorities in the Member States.
Main statistical findings
First estimates for 2013: down by 1.3 % on the previous year
The decrease in EU-28 real agricultural income in 2013 is mainly the result of higher increase in real terms in input costs producer prices (-10.5 %), than in the value of the outputof the agricultural sector at producer prices (+0.1 %).
Real agricultural income per worker in 2013 is estimated to have risen in fifteen Member States and to have fallen in thirteen (see Figure 1). The largest falls are expected in Estonia (-17.2 %), France (-16.4 %) and Croatia (-16.2 %), and the highest rises in the Netherlands (+11.4 %), Romania (+10.4 %) and Spain (+10.0 %).
In 2013, the value of EU agricultural output at producer prices is estimated to have increased by 0.1 %, mainly due to a increase in real terms in the value of animal output (+1.5 %) and a decrease in the value of crop production (-1.1 %).
- Declining crop prices: In crop production, the decrease in value is due to a decline in prices (-3.7 %), while the volume is expected to increase (+2.7 %). Volumes fell for olive oil (-30.6 %), sugar beet (-4.5 %), fresh vegetables (-1.7 %) and plant & flowers (-1.1 %), but rose for potatoes (+1.1 %), cereals (+6.1 %), oilseeds (+6.6 %), fruits (+6.9 %) and wine (+7.2 %). Prices declined for oilseeds (-15.4 %), cereals (-13.7 %), sugar beet (-2.9 %) and plants & flowers (-1.8 %), while they rose for fresh vegetables (+1.1 %), fruits (+2.3 %), wine (+2.8 %), potatoes (+15.2 %) and olive oil (+20.5 %).
- Increase in prices for animal production: The increase in the value of animal production is due to an increase in prices (+1.6 %) while volume remained stable. Volumes fell for sheep & goats (-2.2 %), cattle (-0.9 %) and pigs (-0.7 %), but rose for milk (+0.1 %), poultry (+0.9 %) and eggs (+3.7 %). Prices fell for eggs (-17.2 %) and sheep & goats (-2.7 %), while they rose for cattle (+0.8 %), pigs (+1.7 %), poultry (+2.7 %) and milk (+5.8 %).
- Increasing input costs: EU-28 agricultural input costs (intermediate consumption) are estimated to have risen by 0.8% in real terms, mainly due to an increase in value for feedingstuffs (+1.0 %), maintenance of materials (+2.0 %) and seeds & planting stocks (+2.5 %).
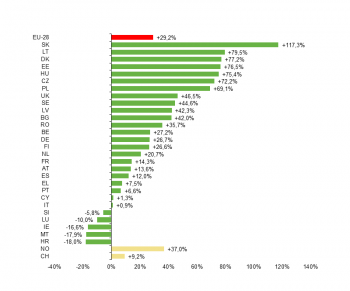
Between 2005 and 2013, EU-28 real income per worker is estimated to have increased by 29.2 %. On average, agricultural labour input in the EU-28 has fallen by 20.8 % since 2005 (see Figure 2).
Data sources and availability
Estimated results for agricultural income and labour input are submitted by Member States for the year in question by the end of November the same year and by the end of February the following year. Final data are submitted in September, nine months after the end of the year.
Context
The economic accounts for agriculture (EAA) provide detailed information on income in the agricultural sector. The purpose is to analyse the production process of the agricultural industry and the primary income generated by this production. The accounts are therefore based on the industry concept. The EAA accounts are detailed data on value of output (producer prices and basic prices), intermediate consumption, subsidies and taxes, consumption of fixed capital, rent and interests, capital formation etc. The values are in current as well as in constant prices.
Agricultural labour input (ALI) and unit values (UV) are an integrated part of the overall concept of the economic accounts for agriculture.
The economic accounts for agriculture are a satellite account of the European system of accounts (ESA 2010), providing complementary information and concepts adapted to the particular nature of the agricultural industry. Although their structure very closely matches that of the national accounts, their compilation requires the formulation of appropriate rules and methods.
Regulation 138/2008 of 5 December 2003 on the economic accounts for agriculture in the Community (OJ L33, 05.02.2004) sets the legal basis for establishing a harmonised methodology for the compilation of the EAA (consolidated version). This Regulation has been amended by Regulations 306/2005 of 24 February 2005, 909/2006 of 20 June 2006, 212/2008 of 7 March 2008 and 1137/2008 of 22 October 2008.
See also
Further Eurostat information
Publications
- Employment in the agriculture sector down by 25% between 2000 and 2009 - Eurostat Newsrelease 66/2010, 7 May 2010
- EU-28 real agricultural income per worker down by 1.3% - Eurostat Newsrelease 193/2013, 13 December 2013
- EU Agricultural Income down 11.6% in 2009 - Statistics in focus 18/2010, 7 May 2010
Main tables
- Agriculture (t_agri), see:
- Economic Accounts for Agriculture (t_aact)
Database
- Agriculture, see:
- Economic Accounts for Agriculture (aact)
Dedicated section
Methodology / Metadata
- Economic Accounts for Agriculture (aact) (ESMS metadata file)
Source data for tables and figures (MS Excel)
Other information
- legal basis: Regulation 138/2003 of 5 December 2003 on the economic accounts for agriculture in the Community
- amending Regulations:
- Regulation 306/2005 of 5 December 2003 on the economic accounts for agriculture in the Community
- Regulation 909/2006 of 20 June 2006 amending Annexes I and II to Regulation 138/2004 on the economic accounts for agriculture in the Community
- Regulation 212/2008 of 7 March 2008 amending Annex I to Regulation 138/2004 on the economic accounts for agriculture in the Community
- Regulation 1137/2008Regulation (EC) No 1137/2008 of the European Parliament and of the Council of 22 October 2008.
