Tutorials
Log in
Statistics Explained
menu
search
search
Navigation
Main page
Statistical themes
Glossary
Categories
Statistics 4 beginners
Tutorials
Help
Eurostat home
Education corner
Online publications
Regional yearbook
Sustainable development
Full list
Tools
User contributions
Logs
View user groups
Special pages
search
Navigation
Main page
Statistical themes
Glossary
Categories
Statistics 4 beginners
Tutorials
Help
Eurostat home
Education corner
Online publications
Regional yearbook
Sustainable development
Full list
Tools
User contributions
Logs
View user groups
Special pages
Navigation
Main page
Statistical themes
Glossary
Categories
Statistics 4 beginners
Tutorials
Help
Eurostat home
Education corner
Online publications
Regional yearbook
Sustainable development
Full list
Tools
User contributions
Logs
View user groups
Special pages
Uploads by Vysnave
This special page shows all uploaded files.
File list
Items per page:
20
50
100
250
500
Search for media name:
Username:
Include old versions of files
Go
First page
Previous page
Next page
Last page
Date
Name
Thumbnail
Size
Description
Versions
14:44, 19 December 2022
Forests forestry and logging statistics 20 12 2022.xlsx
(
file
)
120 KB
1
14:16, 19 December 2022
Figure 4 Employment per area of forest, 2000 and 2020 (persons employed 1 000 ha).png
(
file
)
67 KB
1
13:01, 19 December 2022
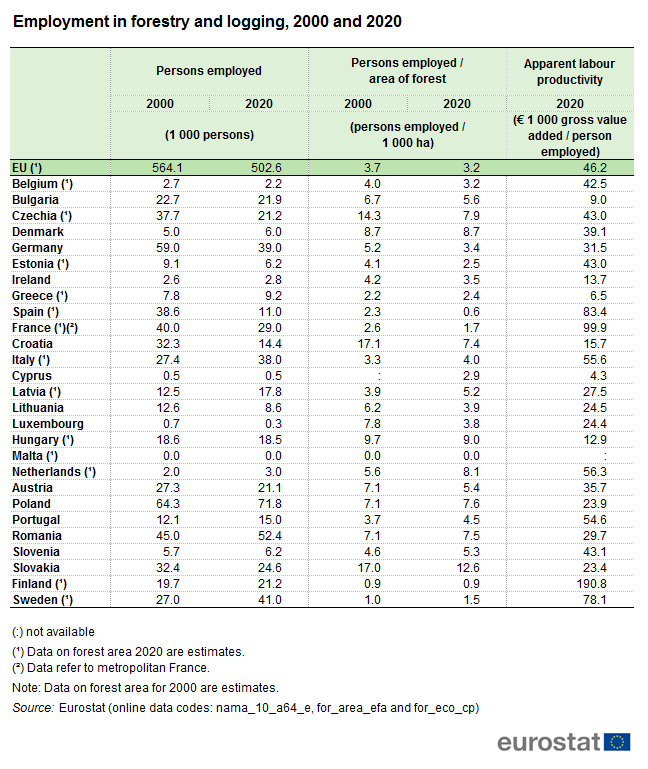
Table 2 Employment in forestry and logging, 2000 and 2020.png
(
file
)
58 KB
1
11:27, 19 December 2022
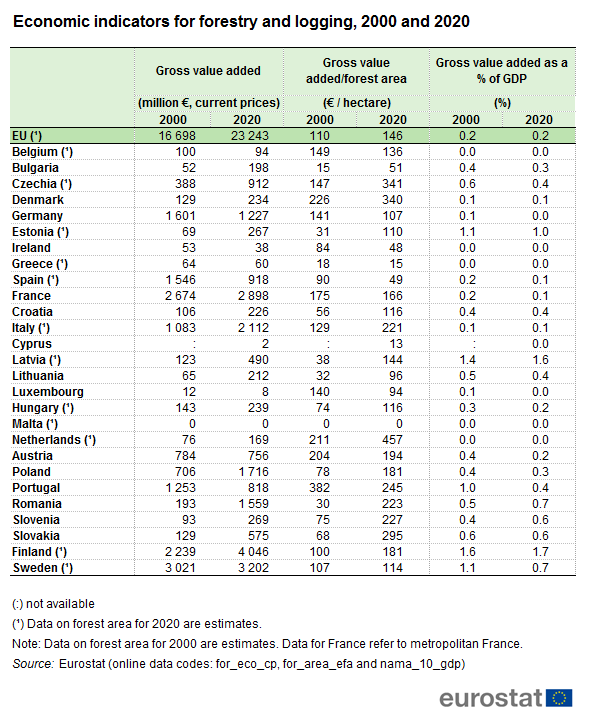
Table 1 Economic indicators for forestry and logging, 2000 and 2020.png
(
file
)
57 KB
1
10:36, 19 December 2022
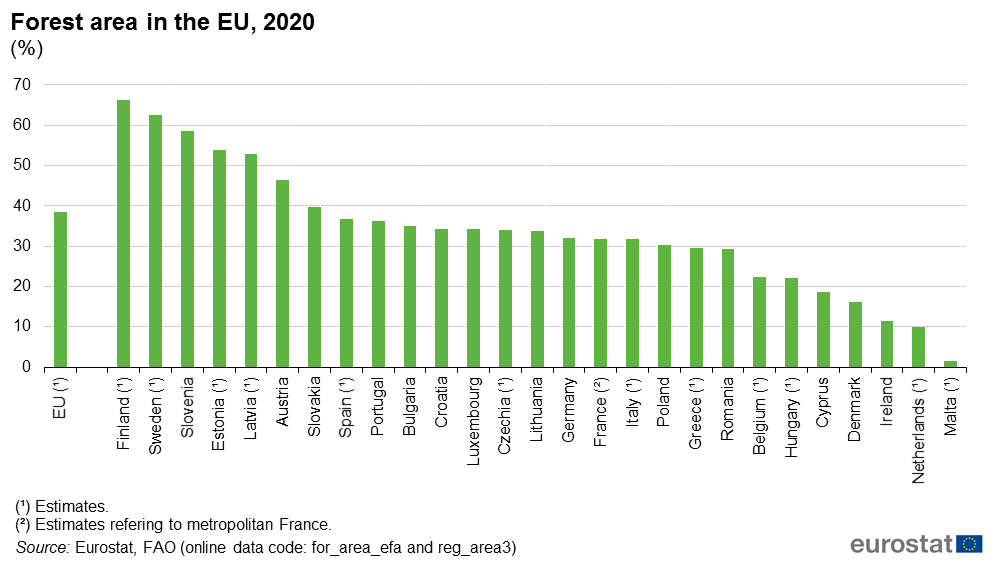
Figure 1 Forest area in the EU, 2020 (%).png
(
file
)
57 KB
1
16:54, 18 December 2022
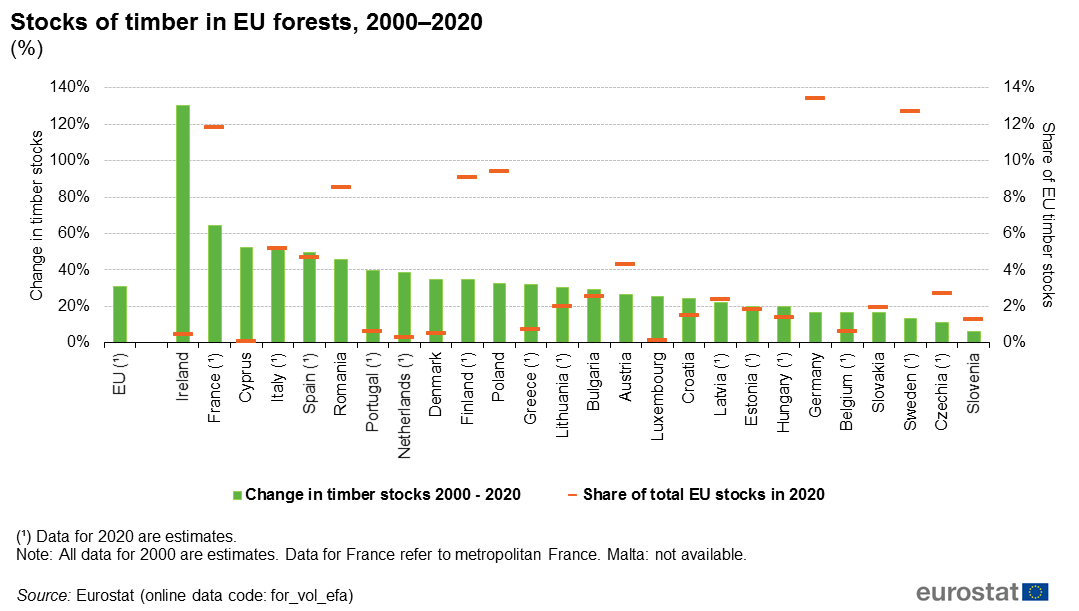
Figure 2 Stocks of timber in EU forests, 2000–2020 (%).png
(
file
)
60 KB
1
15:27, 18 December 2022
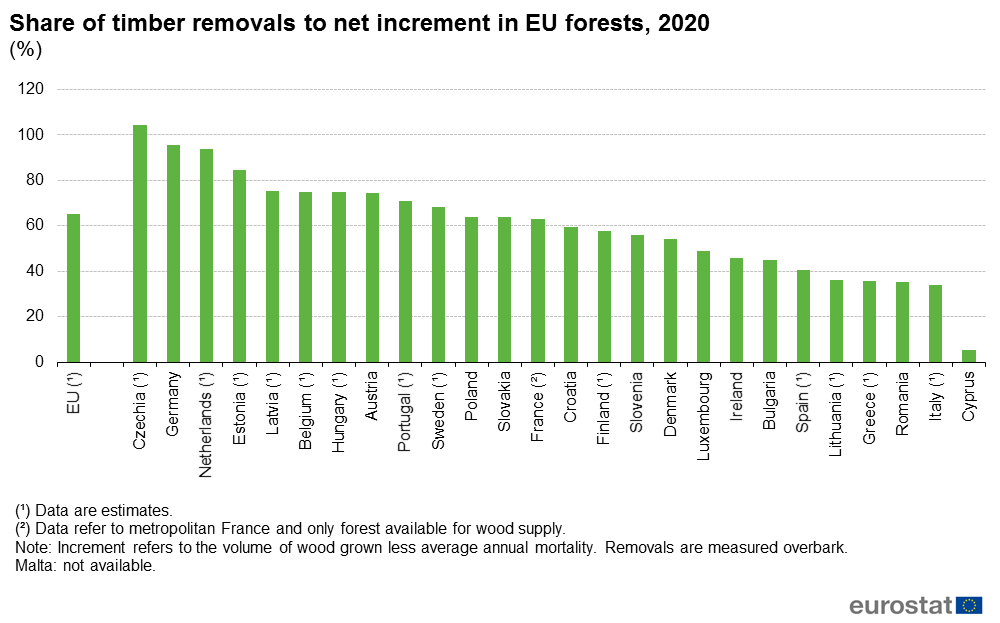
Figure 3 Share of timber removals to net increment in EU forests, 2020 (%).png
(
file
)
67 KB
1
15:52, 28 February 2022
Biodiversity 2022 03 04.xlsx
(
file
)
79 KB
1
15:50, 28 February 2022
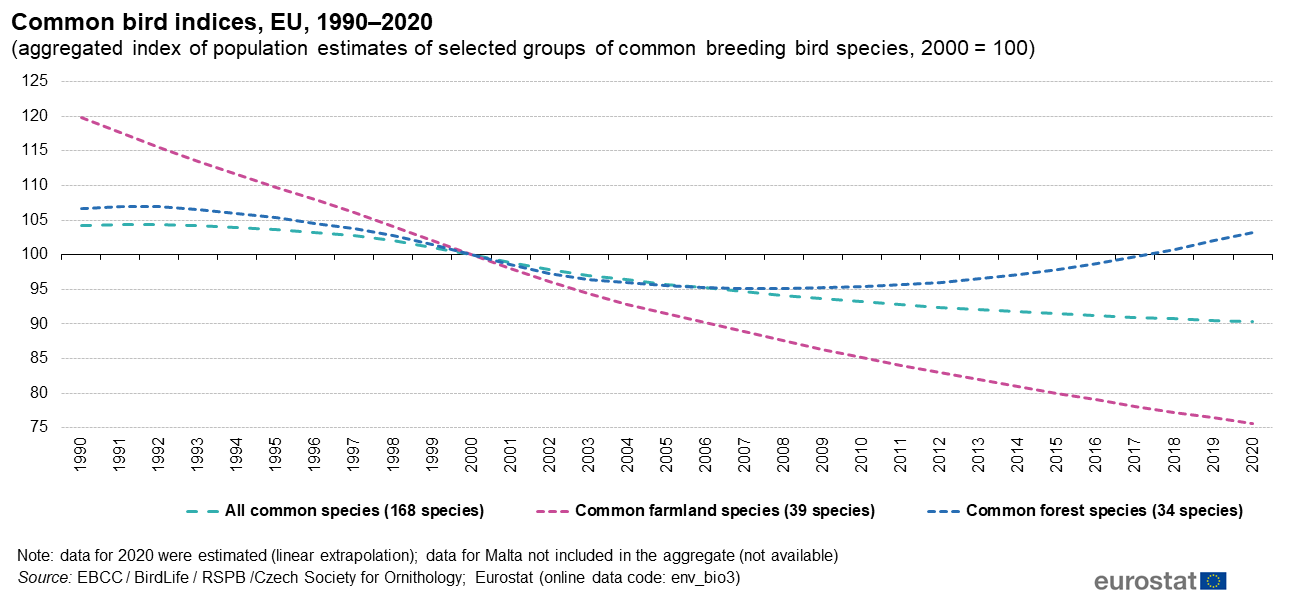
Common bird indices, EU, 1990–2020 (2000 = 100).png
(
file
)
64 KB
1
17:26, 21 December 2021
Forests forestry and logging statistics 20 12 2021.xlsx
(
file
)
135 KB
4
17:25, 21 December 2021
Figure 4 Forestry and logging gross value added per area of forest, 2000 and 2019 (€ hectare, current prices).png
(
file
)
71 KB
2
17:00, 20 December 2021
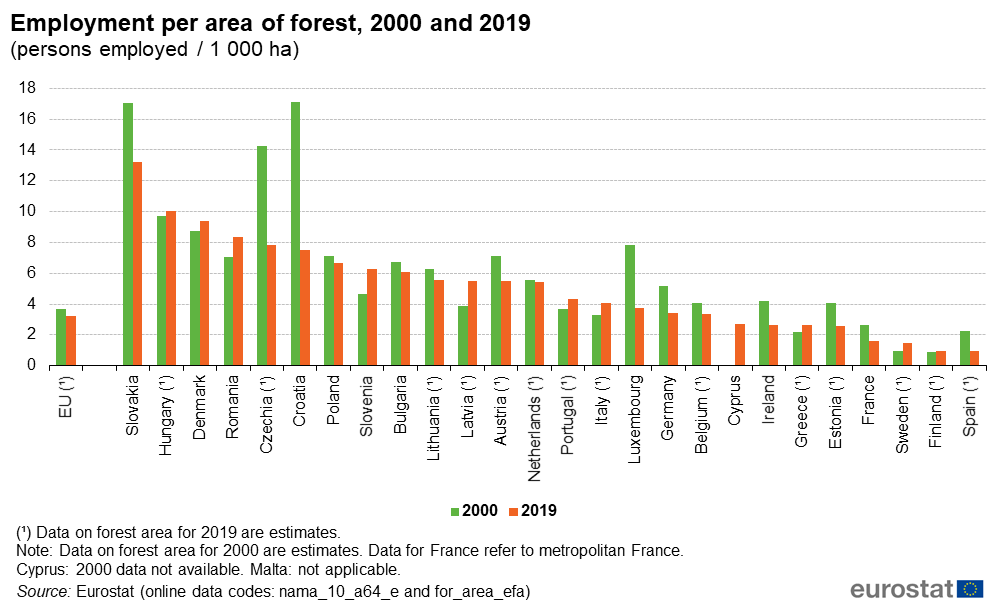
Figure 5 Employment per area of forest, 2000 and 2019 (persons employed 1 000 ha).png
(
file
)
67 KB
null
1
17:00, 20 December 2021
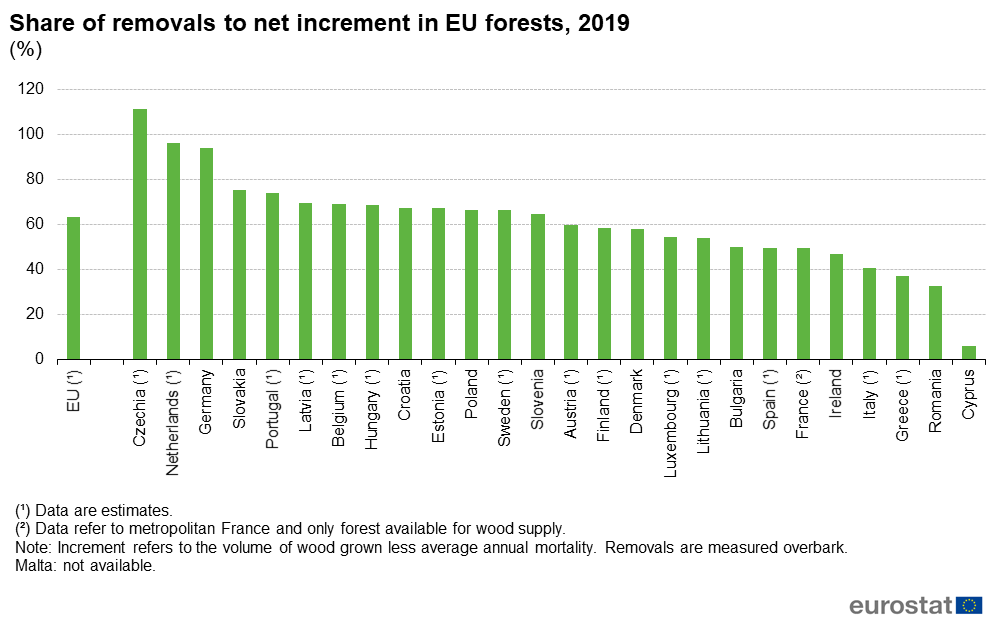
Figure 3 Share of removals to net increment in EU forests, 2019 (%).png
(
file
)
68 KB
null
1
11:41, 17 December 2021
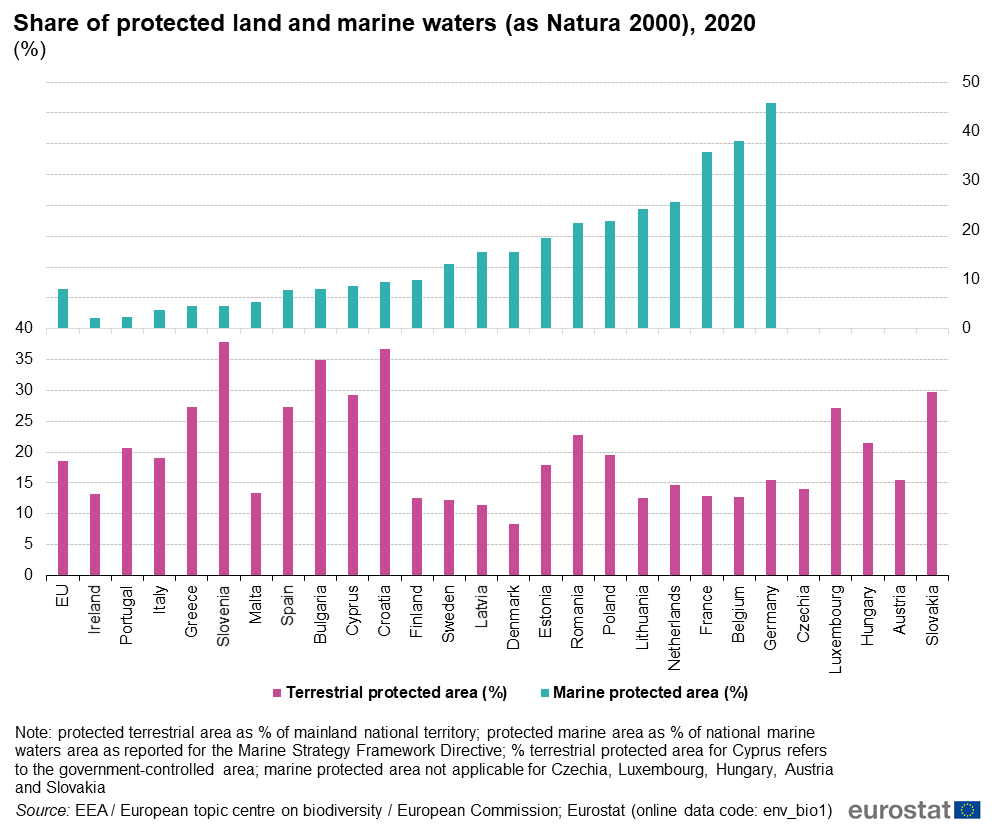
Figure 2 Share of protected land and marine waters (as Natura 2000), 2020.png
(
file
)
78 KB
2
15:38, 16 December 2021
Figure 3 Natura 2000 protected marine area in the EU and Member States (MS).png
(
file
)
64 KB
null
1
15:38, 16 December 2021
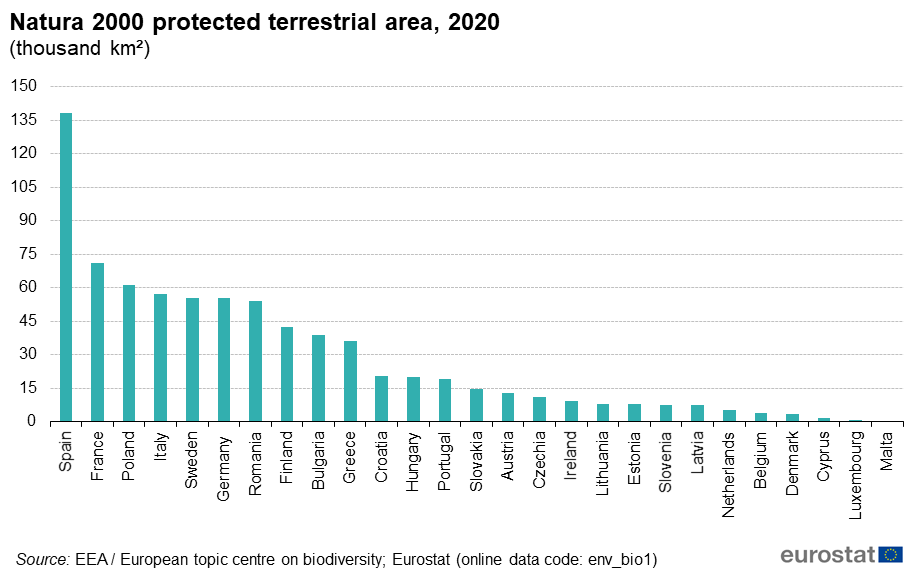
Figure 1 Natura 2000 protected terrestrial area, 2020.png
(
file
)
45 KB
null
1
11:41, 11 December 2021
Wood products production and trade 09 12 2021 update.xlsx
(
file
)
199 KB
2
11:38, 11 December 2021
Figure 5 Employment in wood-based industries, EU-27, 2000–2020.png
(
file
)
79 KB
1
18:07, 9 December 2021
Wood products production and trade 09 12 2021.xlsx
(
file
)
196 KB
1
17:51, 9 December 2021
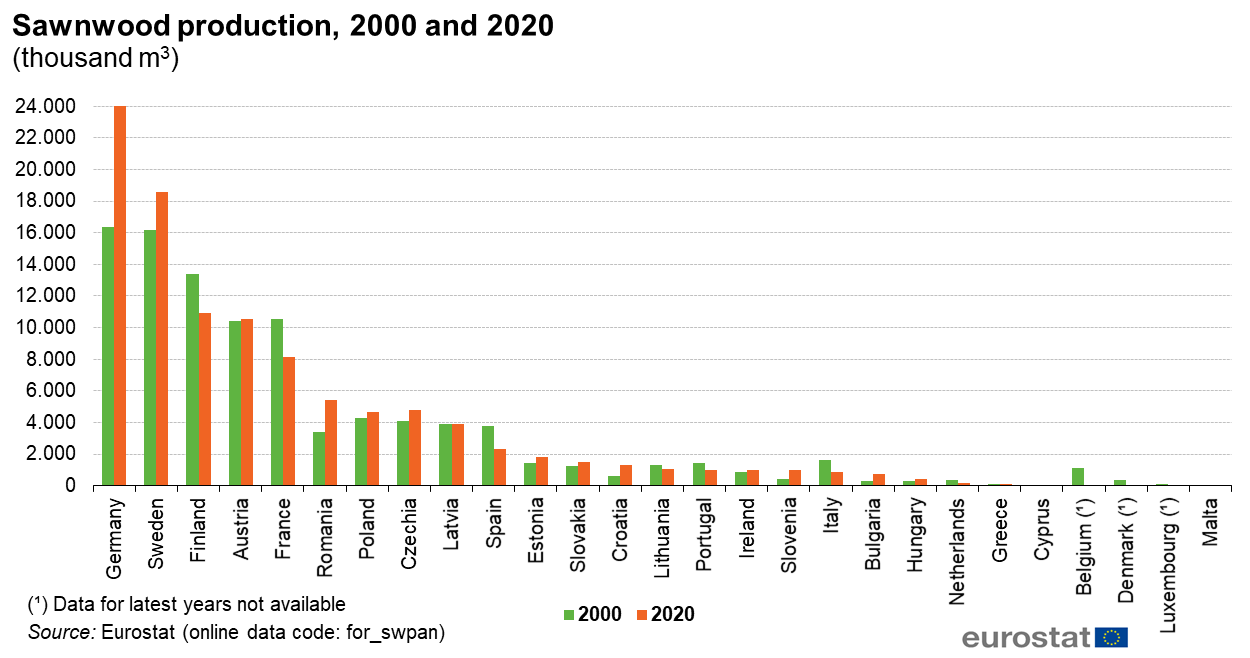
Figure 4 Sawnwood production, 2000 and 2020.png
(
file
)
65 KB
null
1
11:53, 22 April 2021
Biodiversity 2021 04 22.xlsx
(
file
)
78 KB
1
10:48, 22 April 2021
Figure 4 Common bird indices, EU, 1990–2019 (2000 = 100).png
(
file
)
63 KB
1
10:40, 22 April 2021
Figure1 Natura 2000 protected terrestrial area, 2019.png
(
file
)
48 KB
2
19:45, 27 March 2021
Forests forestry and logging statistics 27 03 2021.xlsx
(
file
)
118 KB
1
13:22, 16 December 2020
Figure 4 Output of forestry and logging by type, 2018.png
(
file
)
57 KB
3
13:20, 16 December 2020
Forests forestry and logging statistics 11 12 2020.xlsx
(
file
)
118 KB
3
13:19, 16 December 2020
Figure 5 Employment per area of forest, 2000 and 2018.png
(
file
)
62 KB
2
13:19, 16 December 2020
Figure 3 Forestry and logging gross value added per area of forest, 2000 and 2018.png
(
file
)
68 KB
3
13:17, 16 December 2020
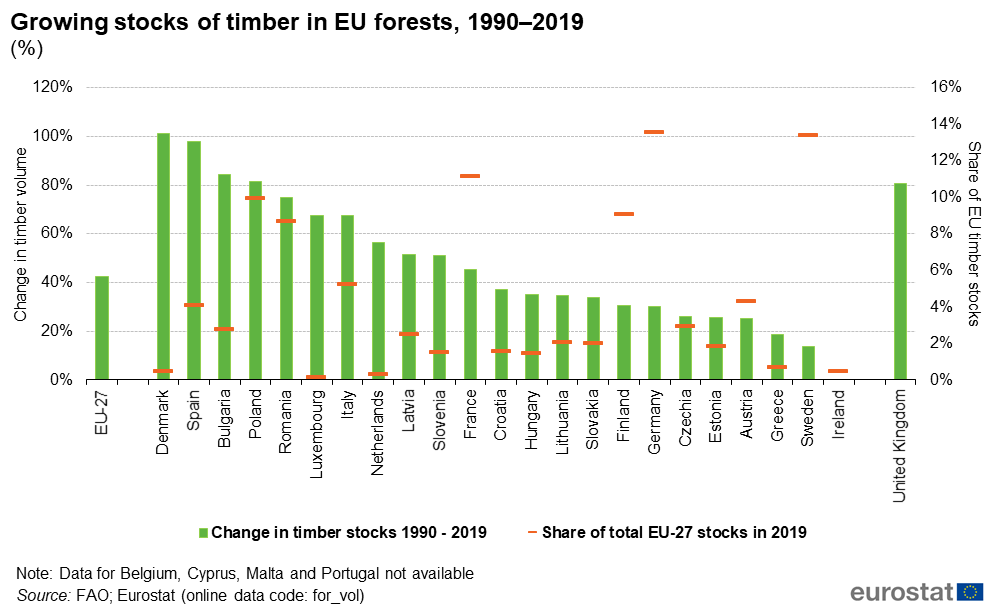
Figure 2 Growing stocks of timber in EU forests, 1990–2019 (%).png
(
file
)
65 KB
2
13:16, 16 December 2020
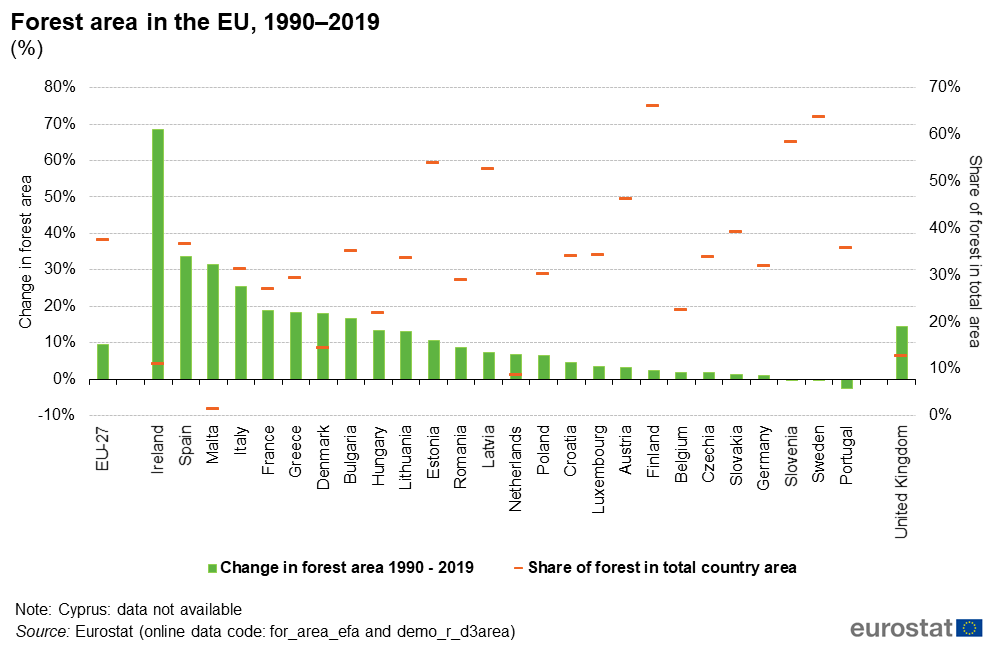
Figure 1 Forest area in the EU, 1990–2019 (%).png
(
file
)
59 KB
2
17:53, 14 December 2020
Wood products production and trade 11 12 2020.xlsx
(
file
)
191 KB
2
17:50, 14 December 2020
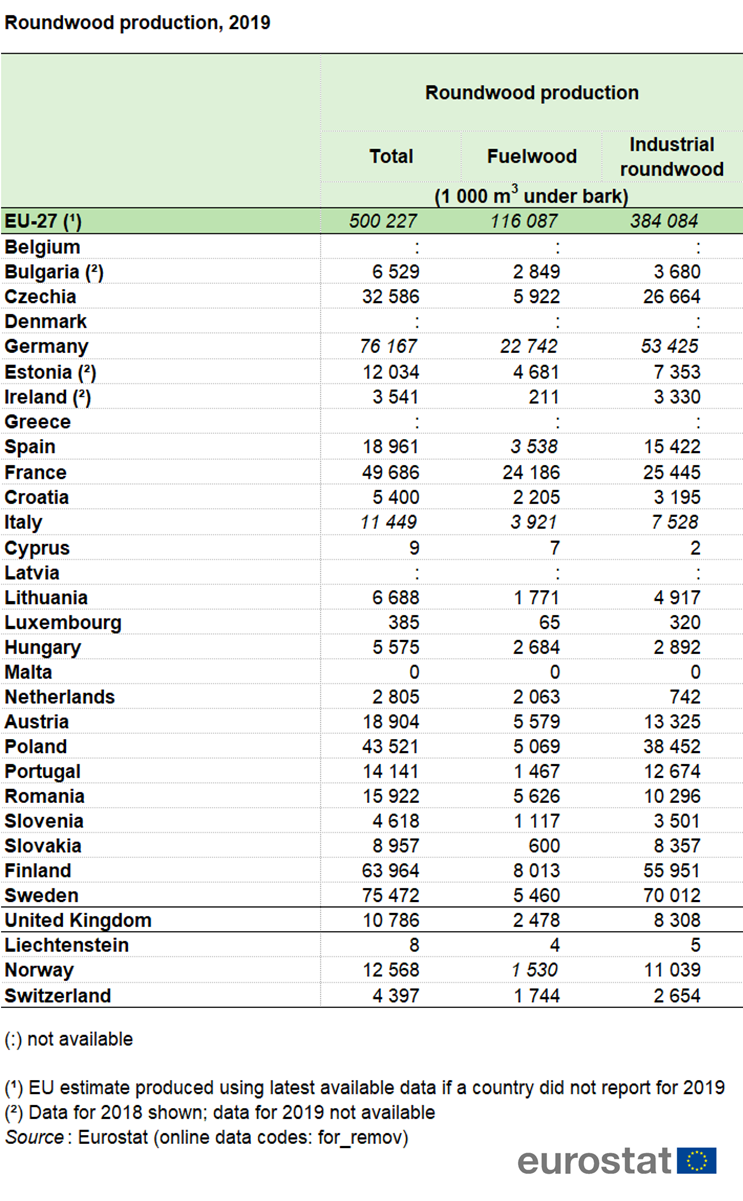
Table 1 Roundwood production, 2019.png
(
file
)
378 KB
1
15:16, 12 December 2020
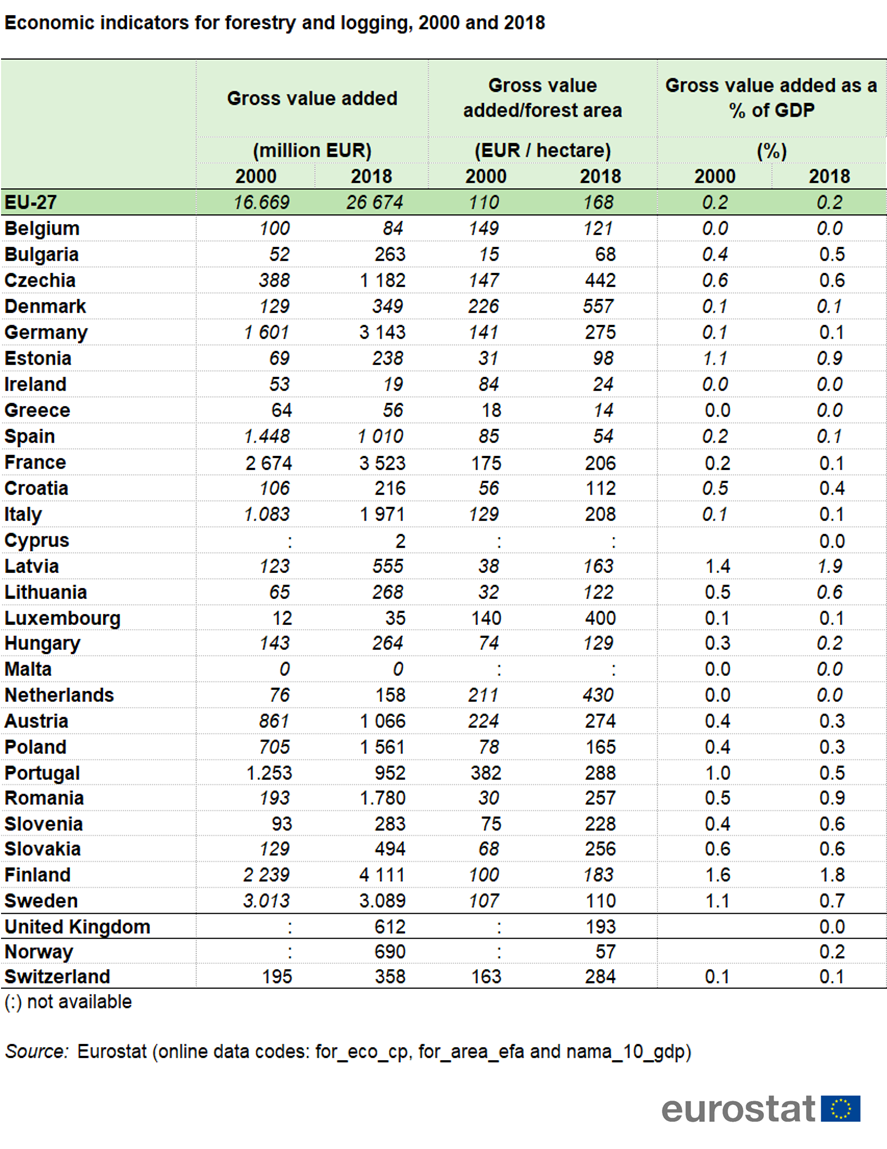
Table 1 Economic indicators for forestry and logging, 2000 and 2018.png
(
file
)
433 KB
2
20:22, 11 December 2020
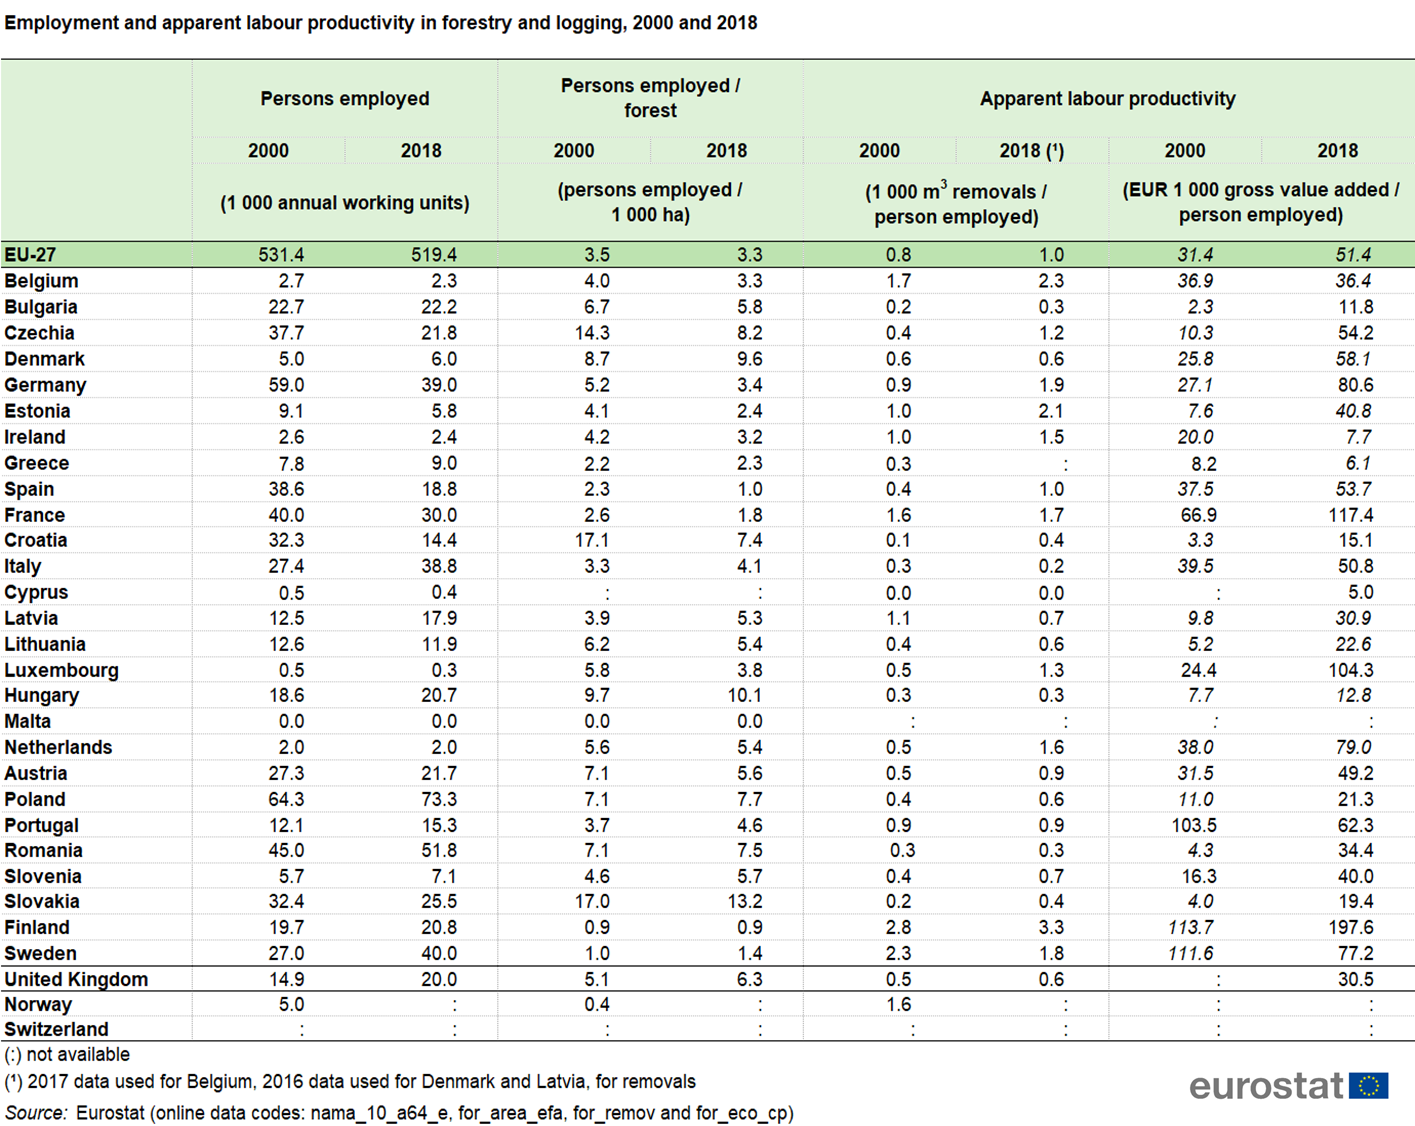
Table 2 Employment and apparent labour productivity in forestry and logging, 2000 and 2018.png
(
file
)
594 KB
1
10:33, 11 December 2020
Figure 10 Wood products imported to the EU-27 from other countries, 2000–2019 (million EUR).png
(
file
)
119 KB
1
10:32, 11 December 2020
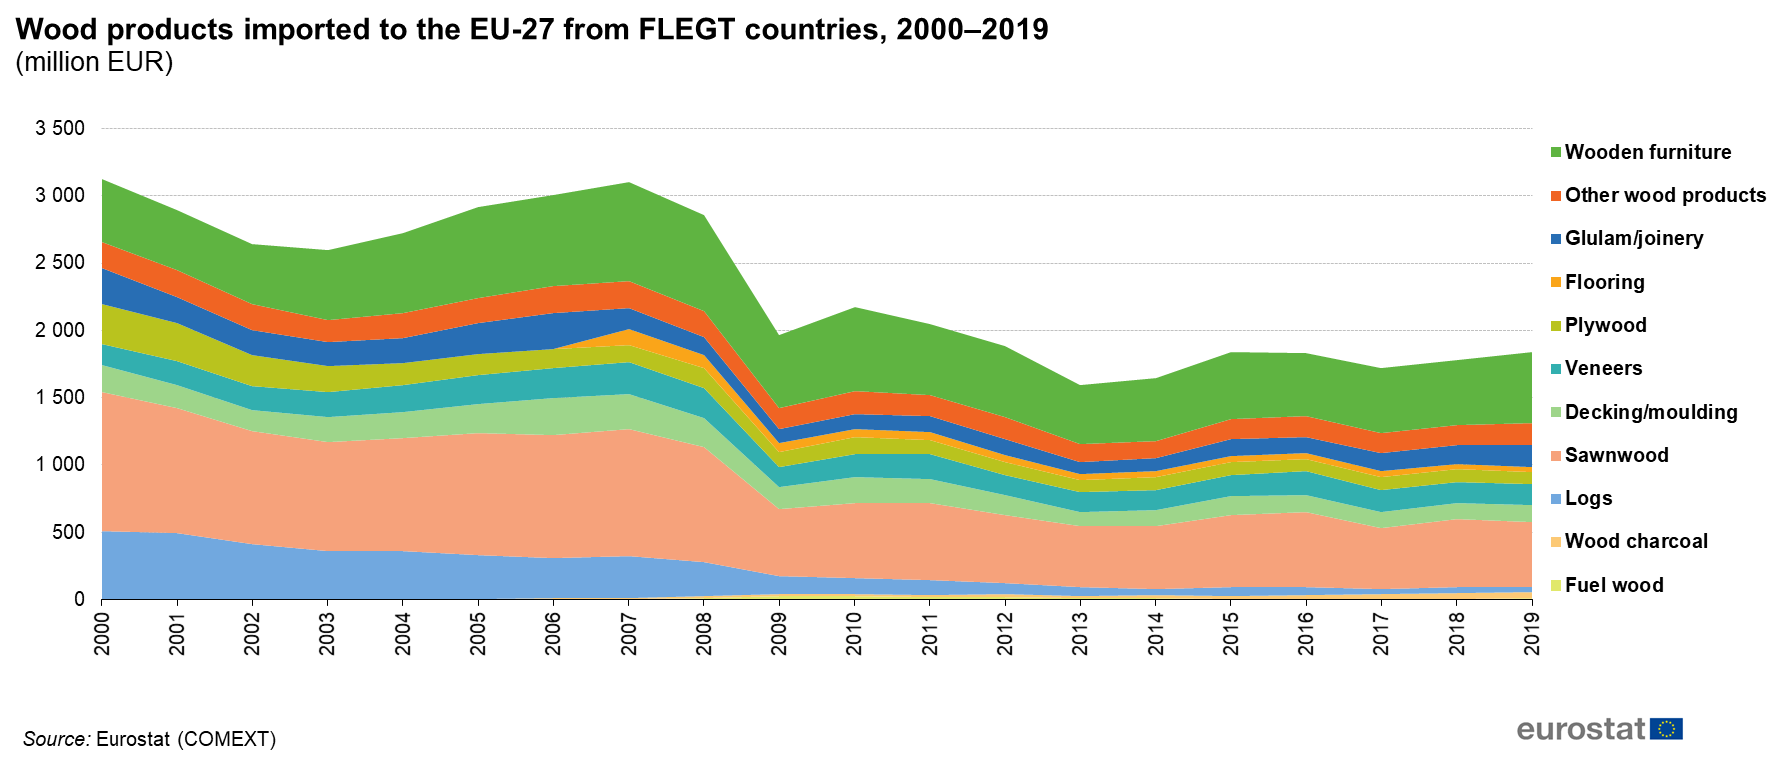
Figure 9 Wood products imported to the EU-27 from FLEGT countries, 2000–2019 (million EUR).png
(
file
)
77 KB
1
10:31, 11 December 2020
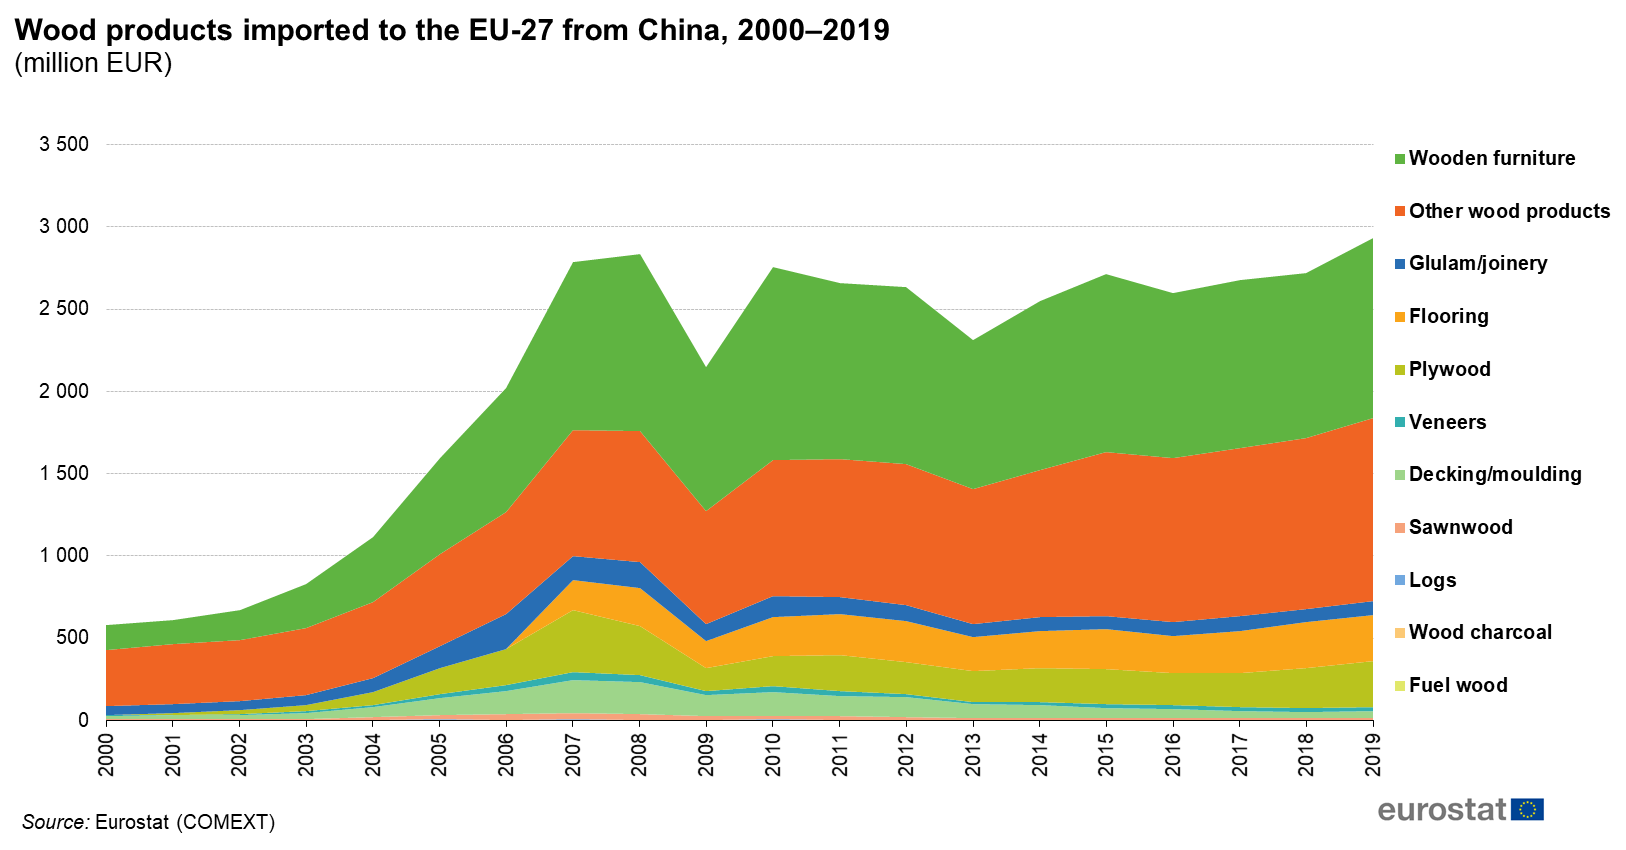
Figure 8 Wood products imported to the EU-27 from China, 2000–2019 (million EUR).png
(
file
)
69 KB
1
10:30, 11 December 2020
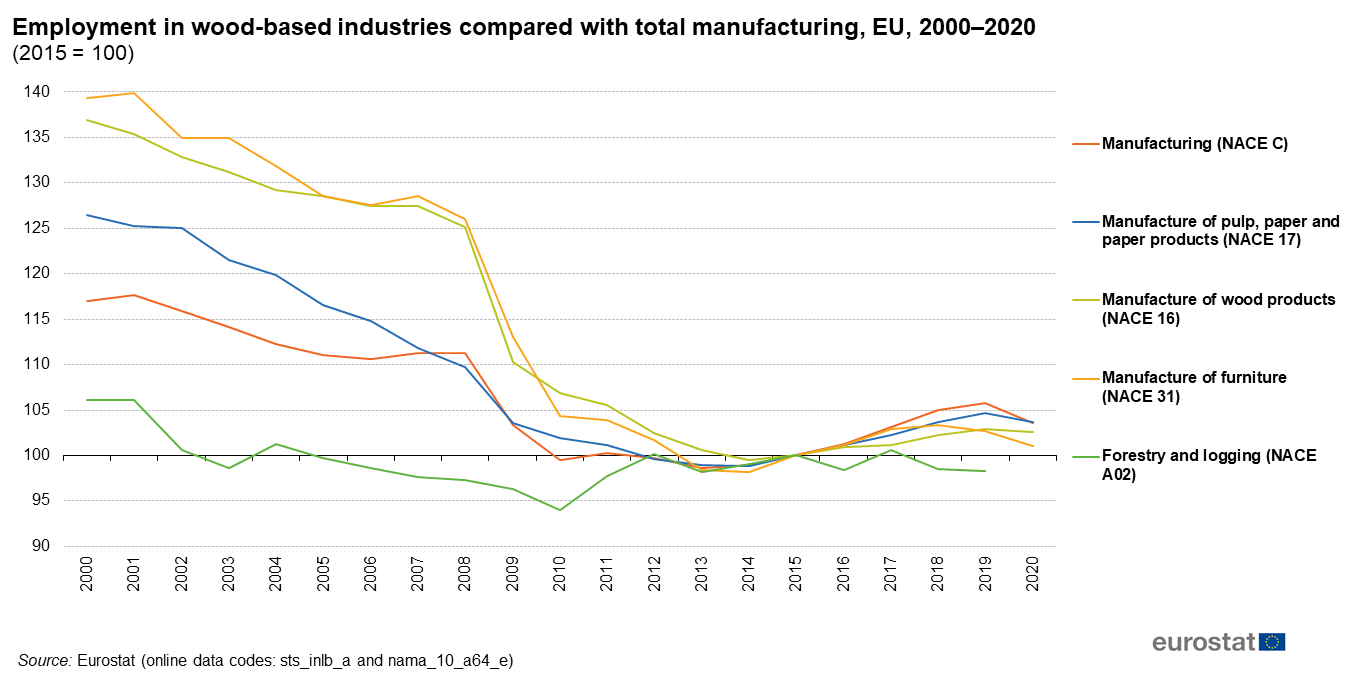
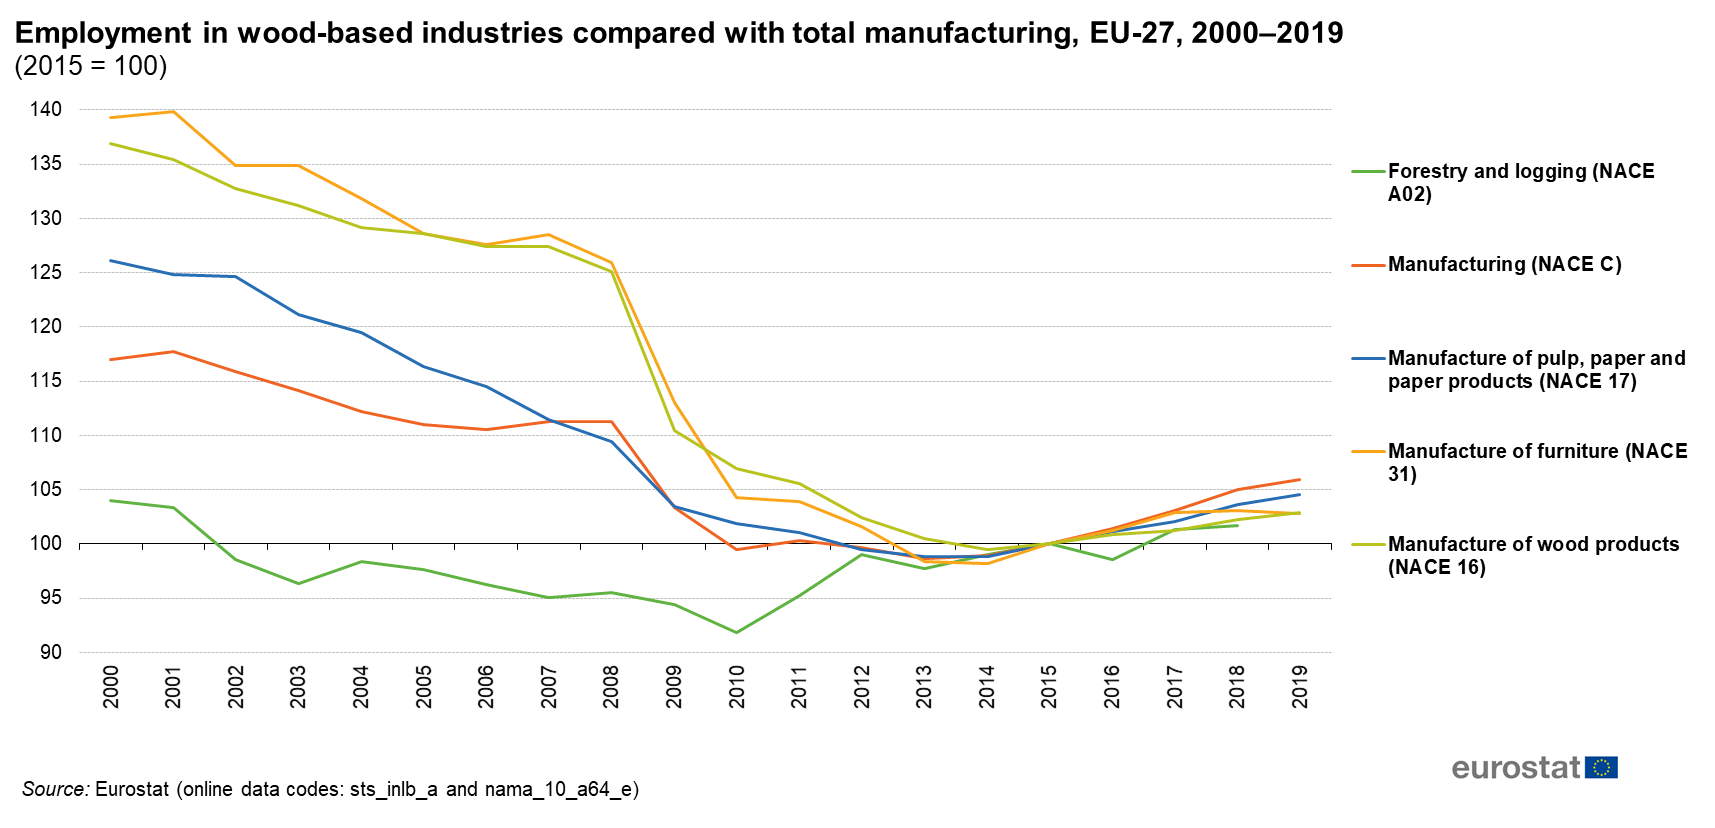
Figure 5 Employment in wood-based industries, EU-27, 2000–2019 (2015 = 100).png
(
file
)
84 KB
1
10:29, 11 December 2020
Figure 4 Sawnwood production, 2000 and 2019 (thousand m3).png
(
file
)
63 KB
1
10:28, 11 December 2020
Figure 3 Annual production of roundwood, EU-27, 2000–2019 (1 000 m³).png
(
file
)
38 KB
1
10:25, 11 December 2020
Figure 2 Change in the share of fuelwood in total roundwood production in the EU, 2000–2019 (%).png
(
file
)
88 KB
1
10:23, 11 December 2020
Figure 1 Change in roundwood production in the EU, 2000–2019 (%).png
(
file
)
101 KB
1
16:24, 29 May 2020
Biodiversity 2020 04 25 v2.xlsx
(
file
)
66 KB
1
16:20, 29 May 2020
Figure3 Common bird indices, EU, 1990–2018.png
(
file
)
60 KB
1
23:40, 26 April 2020
Wood products production and trade 26 04 2020.xlsx
(
file
)
200 KB
1
22:58, 26 April 2020
Figure7 FLEGT countries' share in total wood imports to the EU-27, 2000–2018 (million EUR).png
(
file
)
49 KB
1
22:58, 26 April 2020
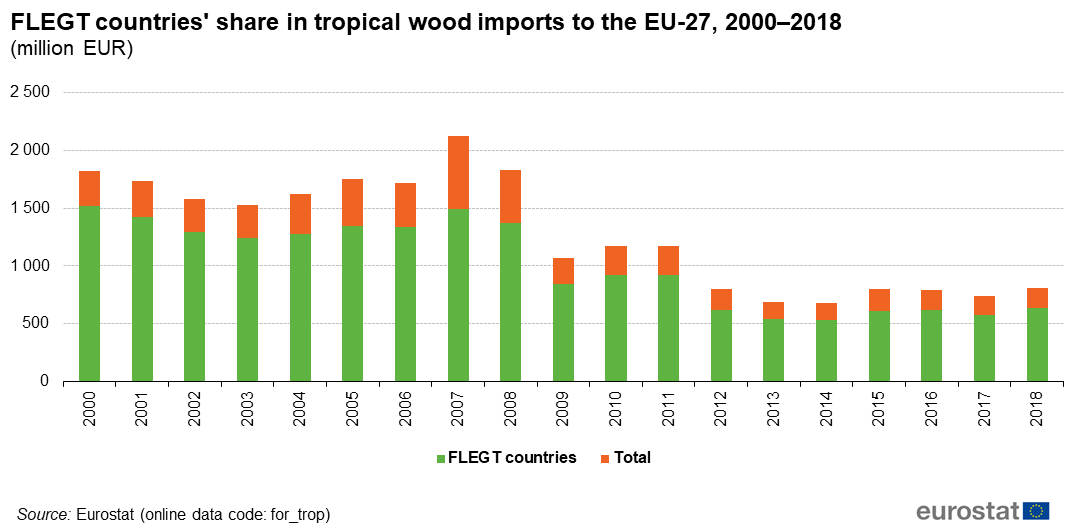
Figure6 FLEGT countries' share in tropical wood imports to the EU-27, 2000–2018 (million EUR).png
(
file
)
44 KB
1
22:58, 26 April 2020
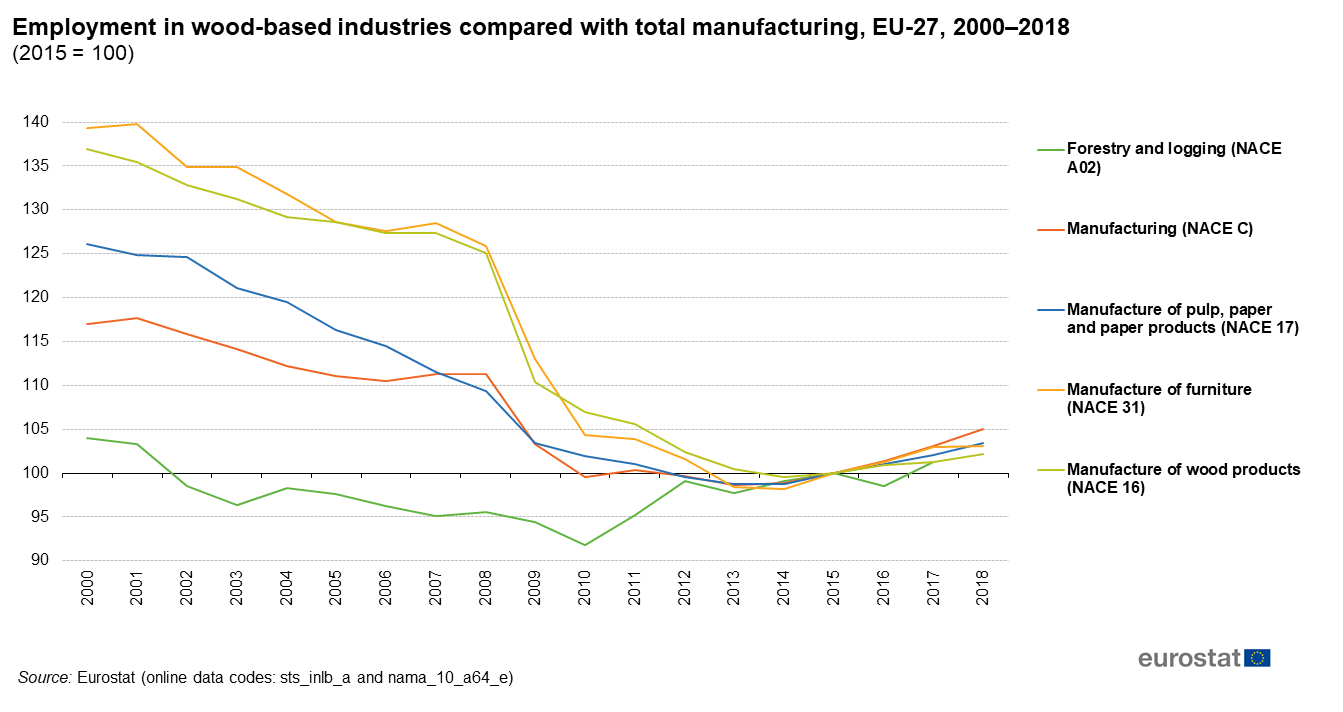
Figure5 Employment in wood-based industries compared with total manufacturing, EU-27, 2000–2018 (2015 = 100).png
(
file
)
76 KB
1
22:58, 26 April 2020
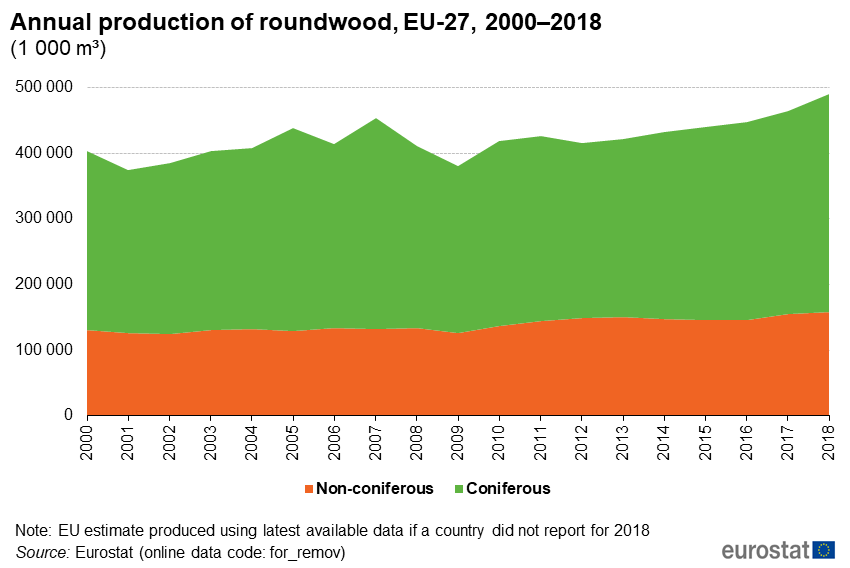
Figure3 Annual production of roundwood, EU-27, 2000–2018 (1 000 m³).png
(
file
)
34 KB
1
22:58, 26 April 2020
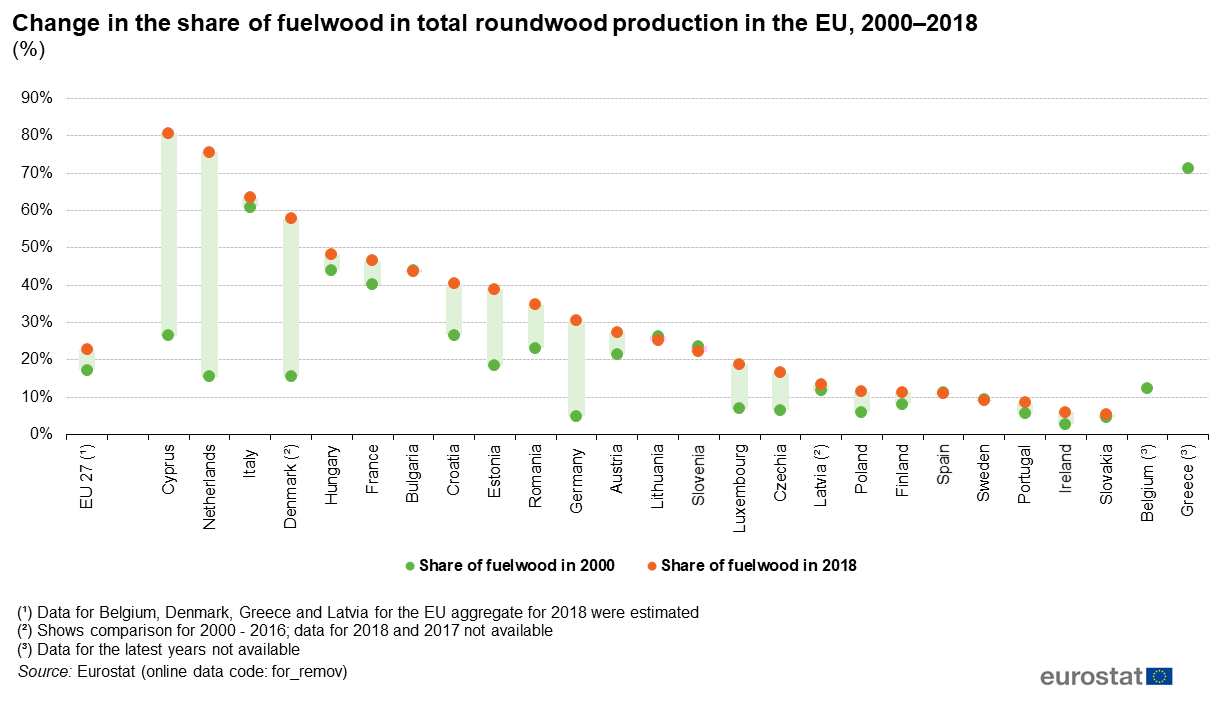
Figure2 Change in the share of fuelwood in total roundwood production in the EU, 2000–2018 (%).png
(
file
)
73 KB
1
First page
Previous page
Next page
Last page
Special page
ISSN 2443-8219
.png)


.png)
.png)
.png)
.png)
.png)
.png)
.png)
,_2020.png)
.png)


.png)


.png)
.png)


.png)
.png)
.png)
.png)
.png)
.png)
.png)
.png)

.png)
.png)
.png)
.png)
.png)