Tutorials
Log in
Statistics Explained
menu
search
search
Navigation
Main page
Statistical themes
Glossary
Categories
Statistics 4 beginners
Tutorials
Help
Eurostat home
Education corner
Online publications
Regional yearbook
Sustainable development
Full list
Tools
User contributions
Logs
View user groups
Special pages
search
Navigation
Main page
Statistical themes
Glossary
Categories
Statistics 4 beginners
Tutorials
Help
Eurostat home
Education corner
Online publications
Regional yearbook
Sustainable development
Full list
Tools
User contributions
Logs
View user groups
Special pages
Navigation
Main page
Statistical themes
Glossary
Categories
Statistics 4 beginners
Tutorials
Help
Eurostat home
Education corner
Online publications
Regional yearbook
Sustainable development
Full list
Tools
User contributions
Logs
View user groups
Special pages
Uploads by Pavelmo
This special page shows all uploaded files.
File list
Items per page:
20
50
100
250
500
Search for media name:
Username:
Include old versions of files
Go
Date
Name
Thumbnail
Size
Description
Versions
19:32, 19 July 2023
Evolution of the value of sold production for top 5 manufacturing activities, EU 2012–2022 (2015=100).png
(
file
)
80 KB
3
19:14, 19 July 2023
Industrial production statistics tables and figuresV2.xlsx
(
file
)
188 KB
1
19:12, 19 July 2023
Industrial production statistics tables and figures V2.xlsx
(
file
)
188 KB
2
19:07, 19 July 2023
Evolution of EU's value of sold industrial production, 2012 - 2022 (2015=100)V1.png
(
file
)
57 KB
1
19:03, 19 July 2023
Evolution of the value of sold production for top 5 manufacturing activities, EU 2012–2022 (2015=100) V1.png
(
file
)
76 KB
1
19:00, 19 July 2023
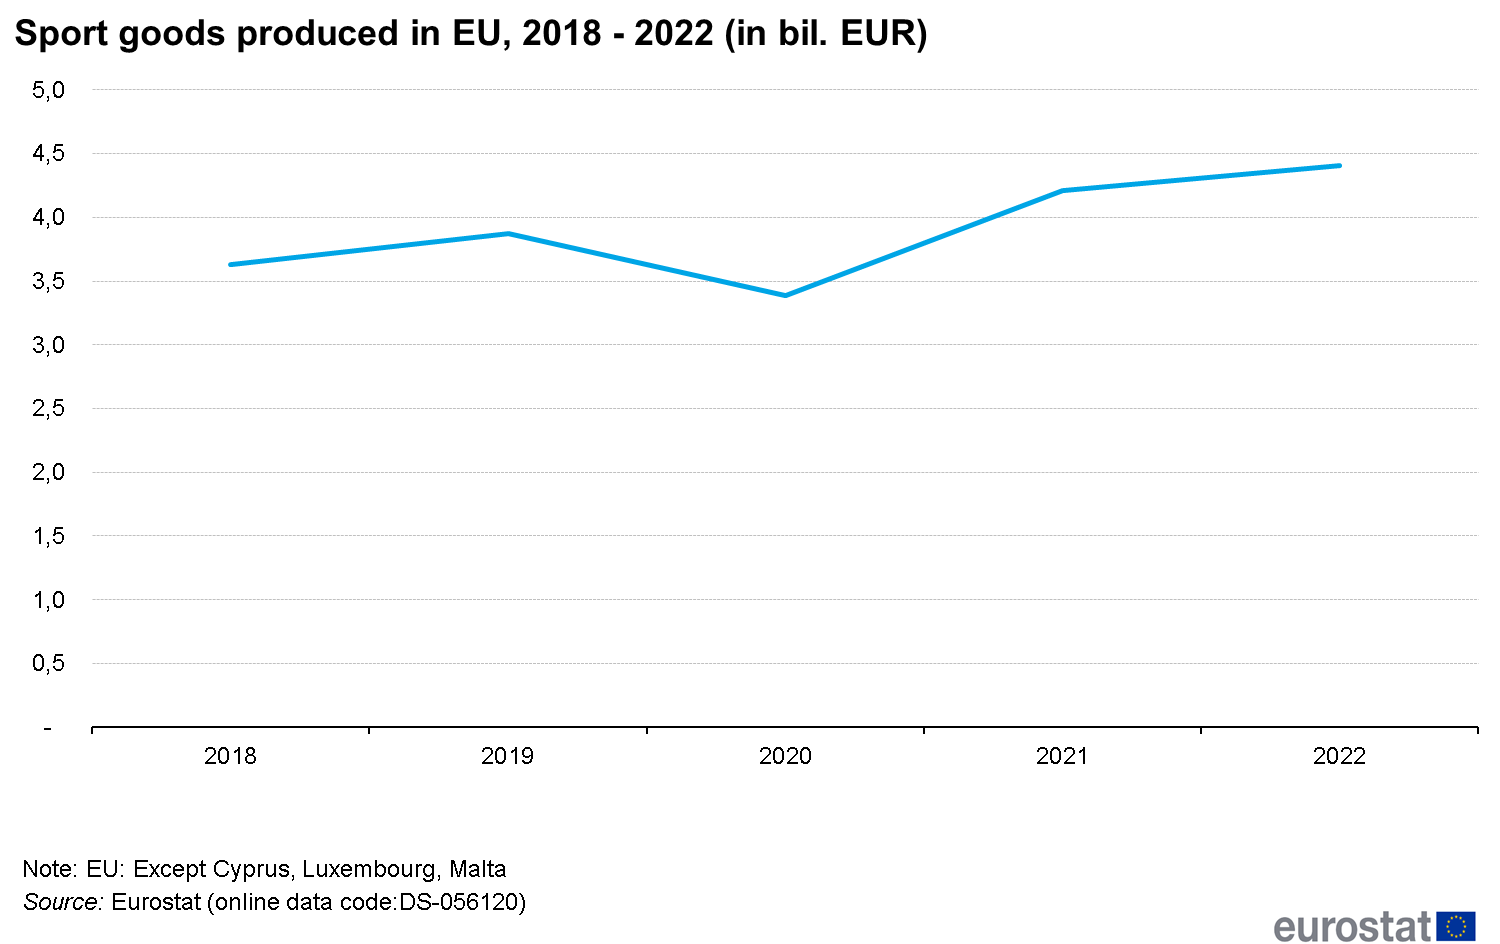
Sport goods produced in EU, 2018 - 2022 (in bil EUR).png
(
file
)
45 KB
1
16:36, 18 July 2023
Industrial production statistics tables and figures V1.xlsx
(
file
)
188 KB
1
16:15, 18 July 2023
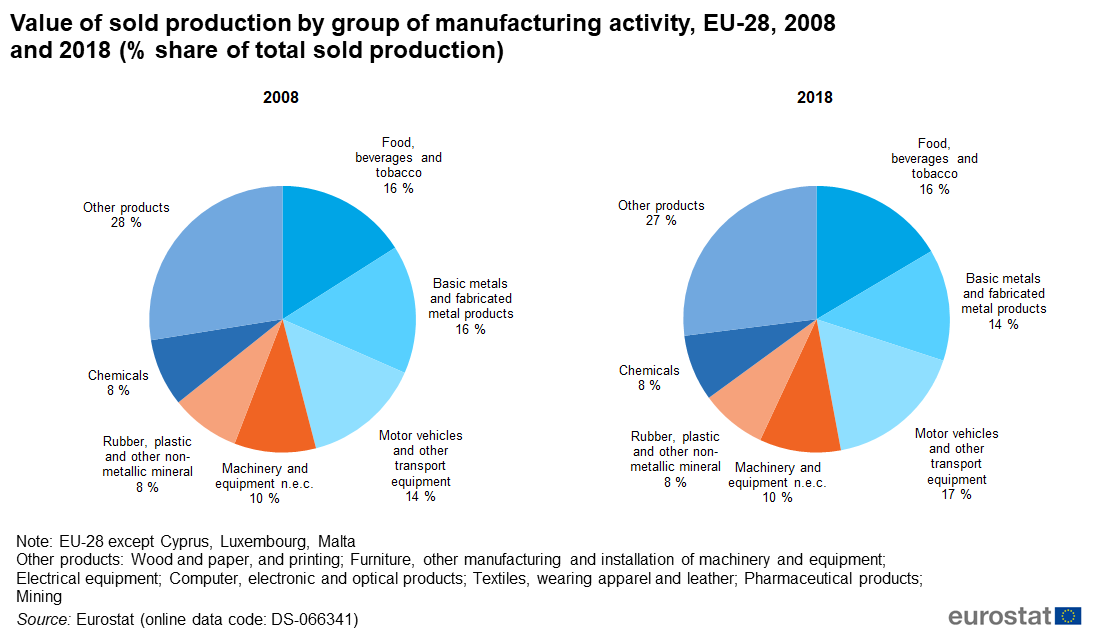
Value of sold production by group of manufacturing activity, EU, 2012 and 2022 (% share of total sold production).png
(
file
)
401 KB
1
16:11, 18 July 2023
Evolution of EU's value of sold industrial production, 2012 - 2022 (2015=100) .png
(
file
)
57 KB
1
16:09, 18 July 2023
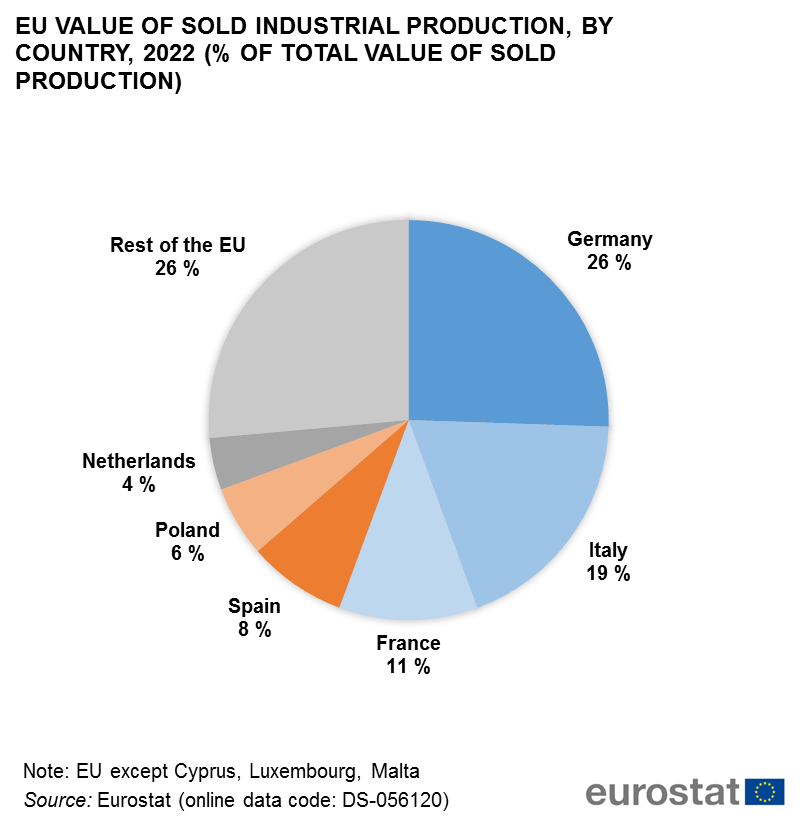
EU value of sold industrial production, by country, 2022 (% of total value of sold production).png
(
file
)
68 KB
1
12:53, 18 July 2023
Industrial production statistics tables and figures.xlsx
(
file
)
234 KB
3
12:20, 18 July 2023
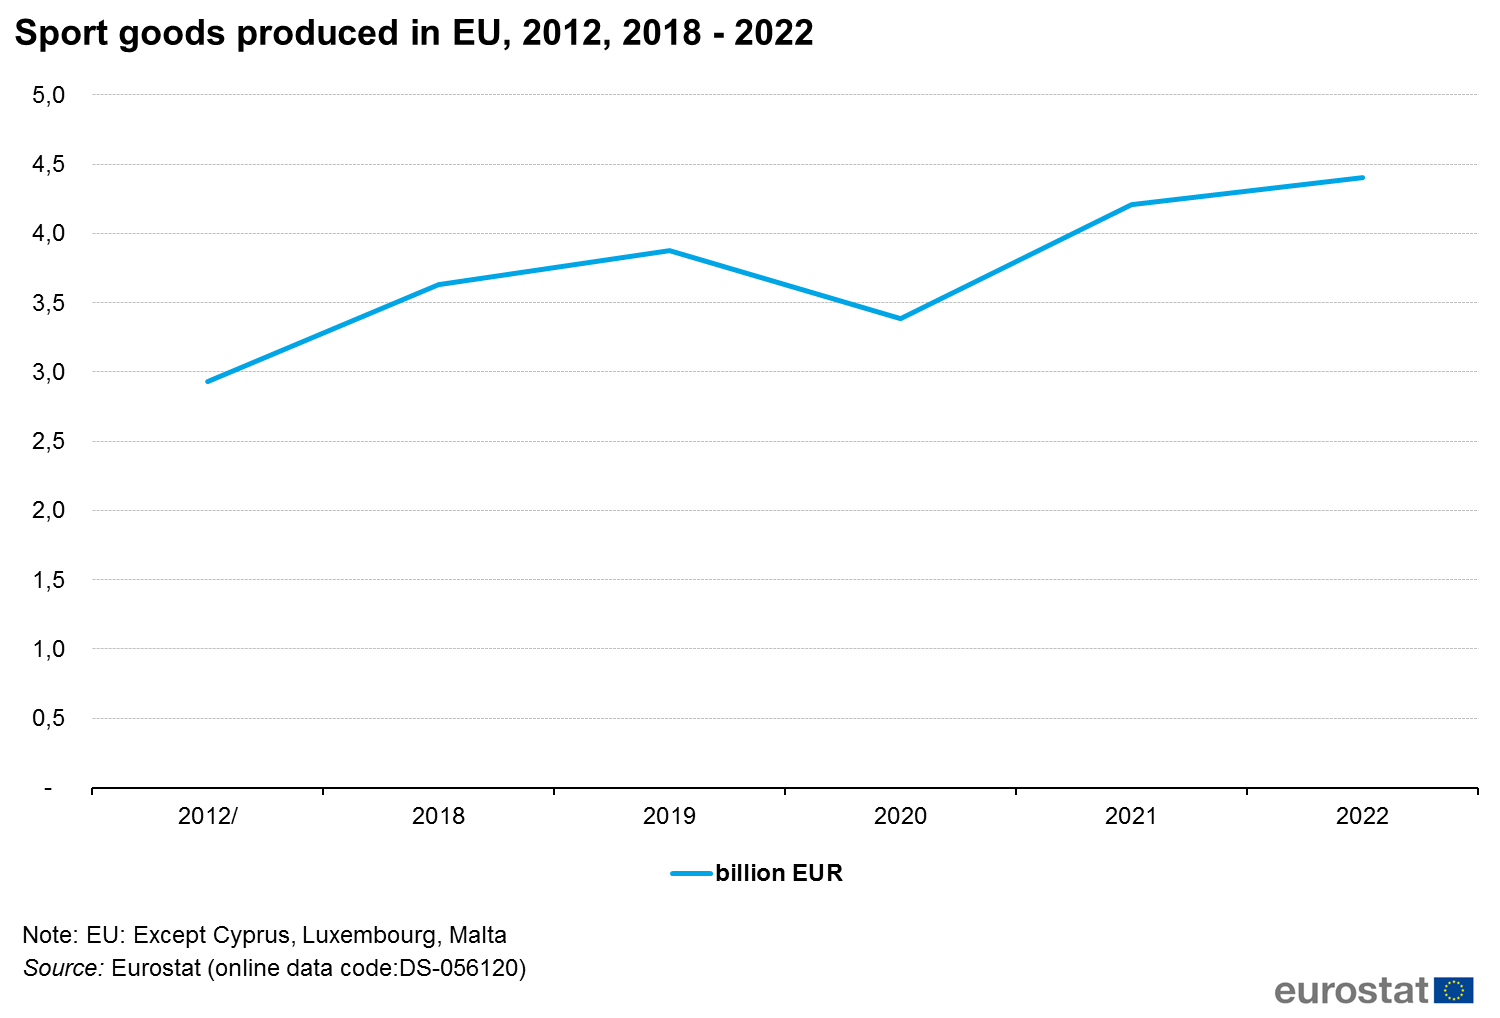
Sport goods produced in EU, 2012, 2018 - 2022.png
(
file
)
54 KB
1
12:19, 18 July 2023
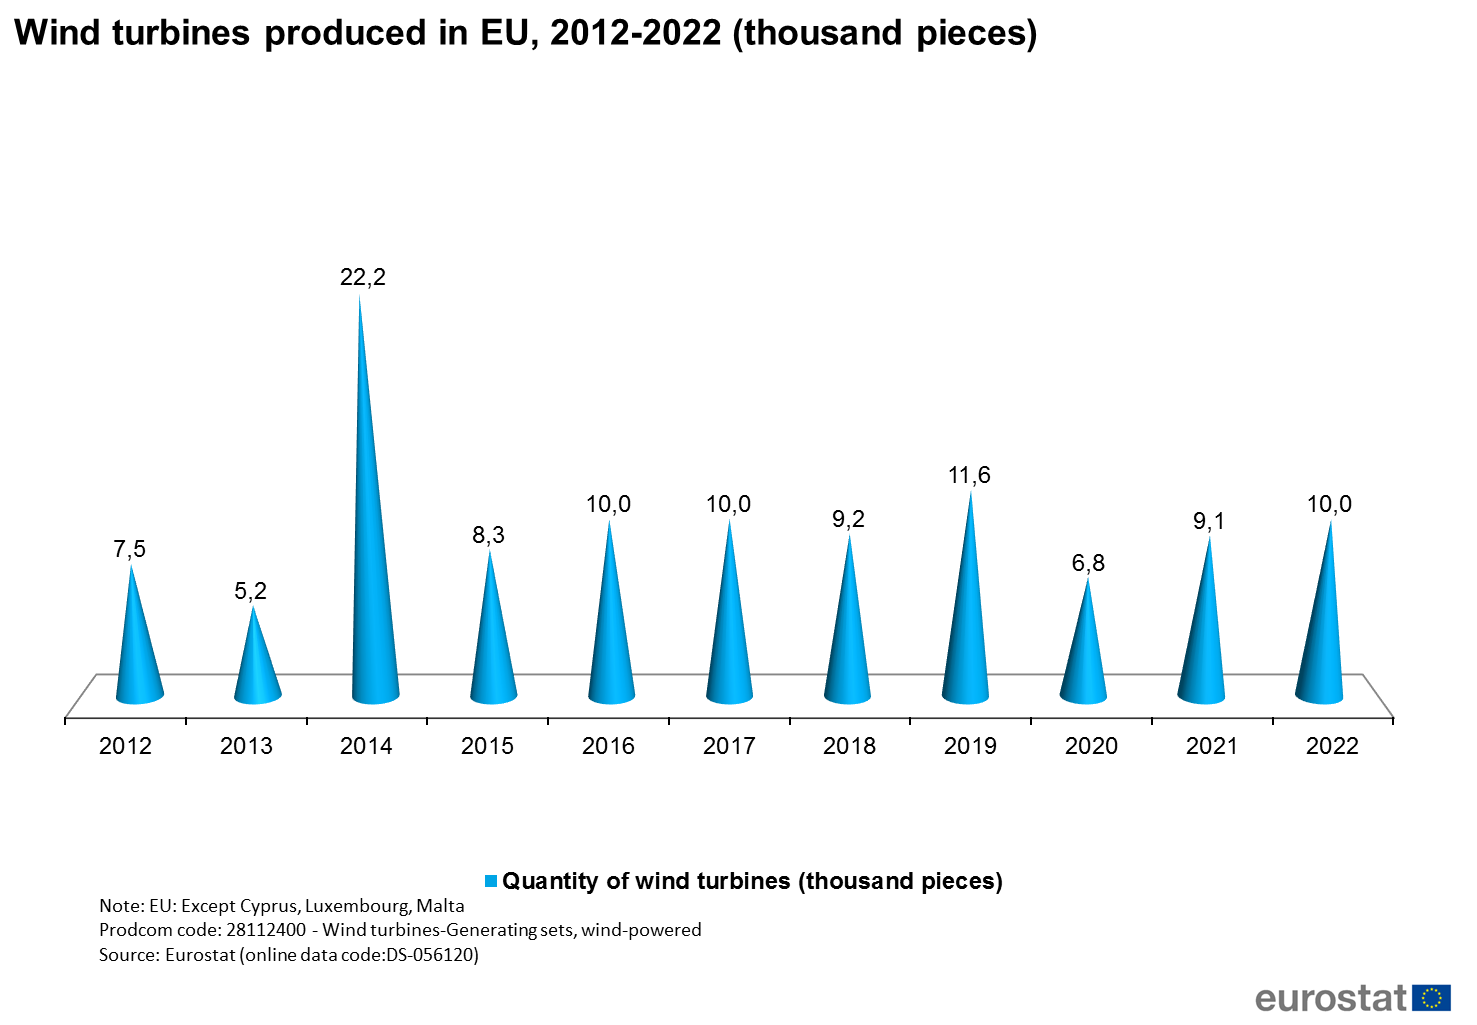
Wind turbines produced in EU, 2012-2022 (thousand pieces).png
(
file
)
172 KB
1
12:15, 18 July 2023
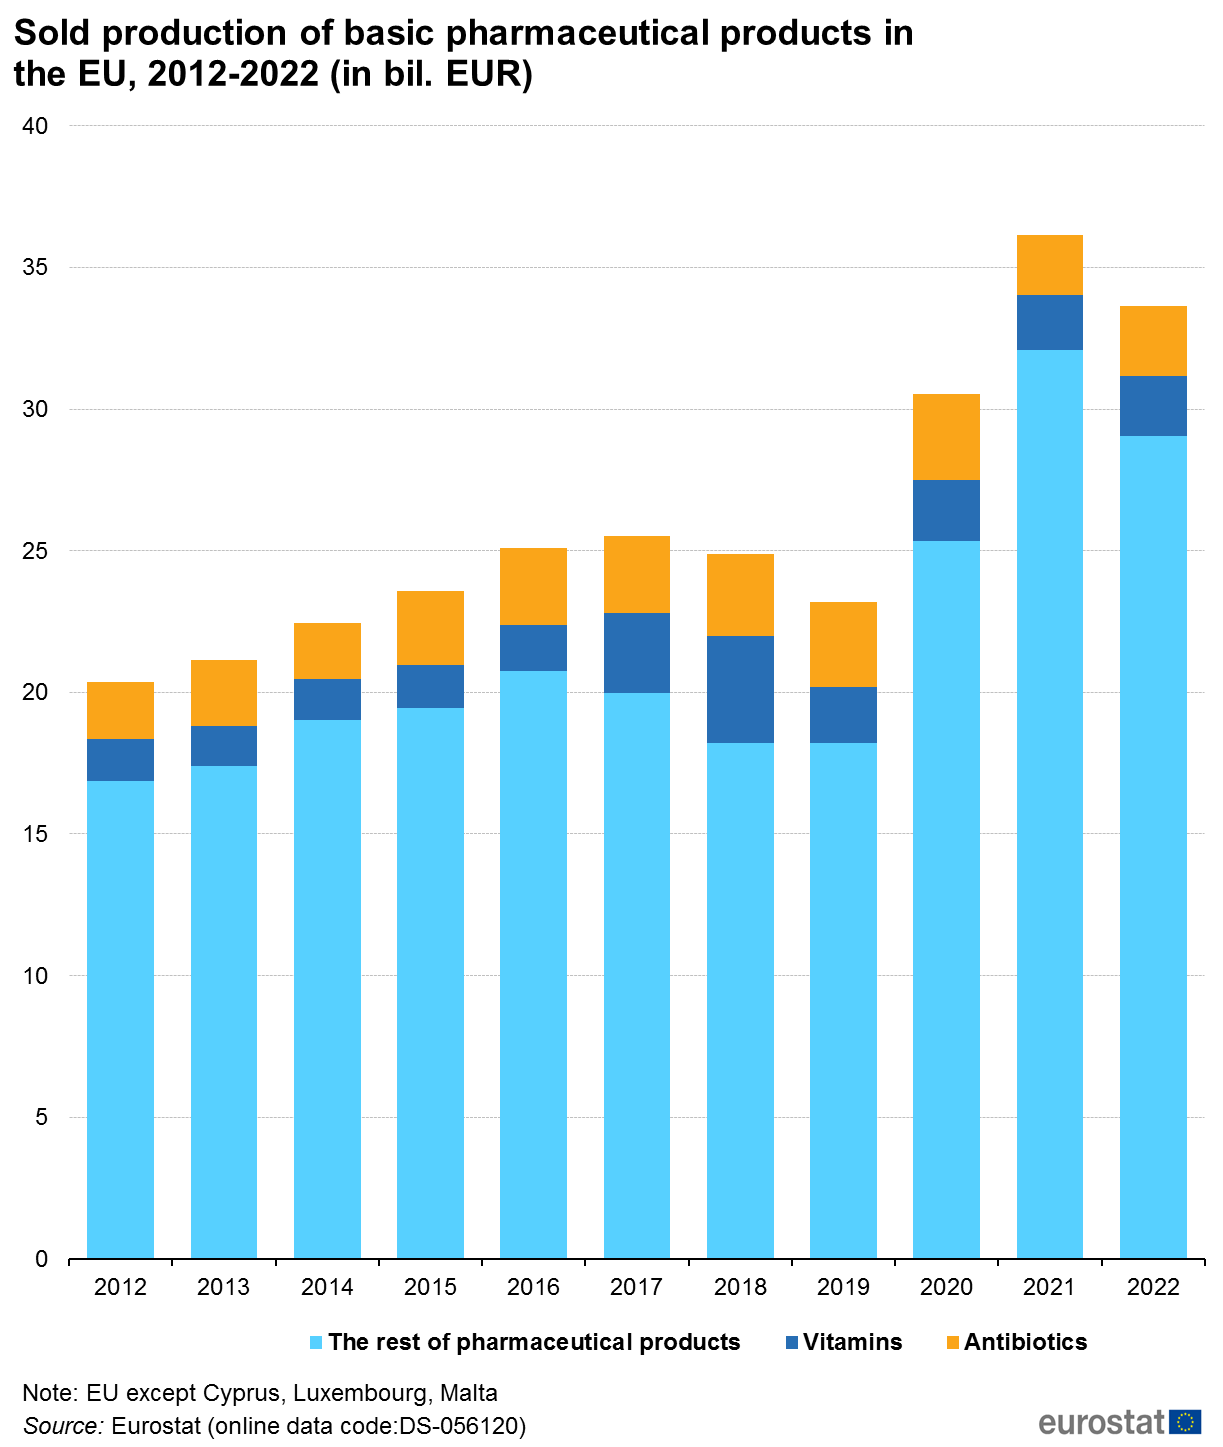
Sold production of basic pharmaceutical products in the EU, 2012-2022 (in bil EUR).png
(
file
)
115 KB
1
12:09, 18 July 2023
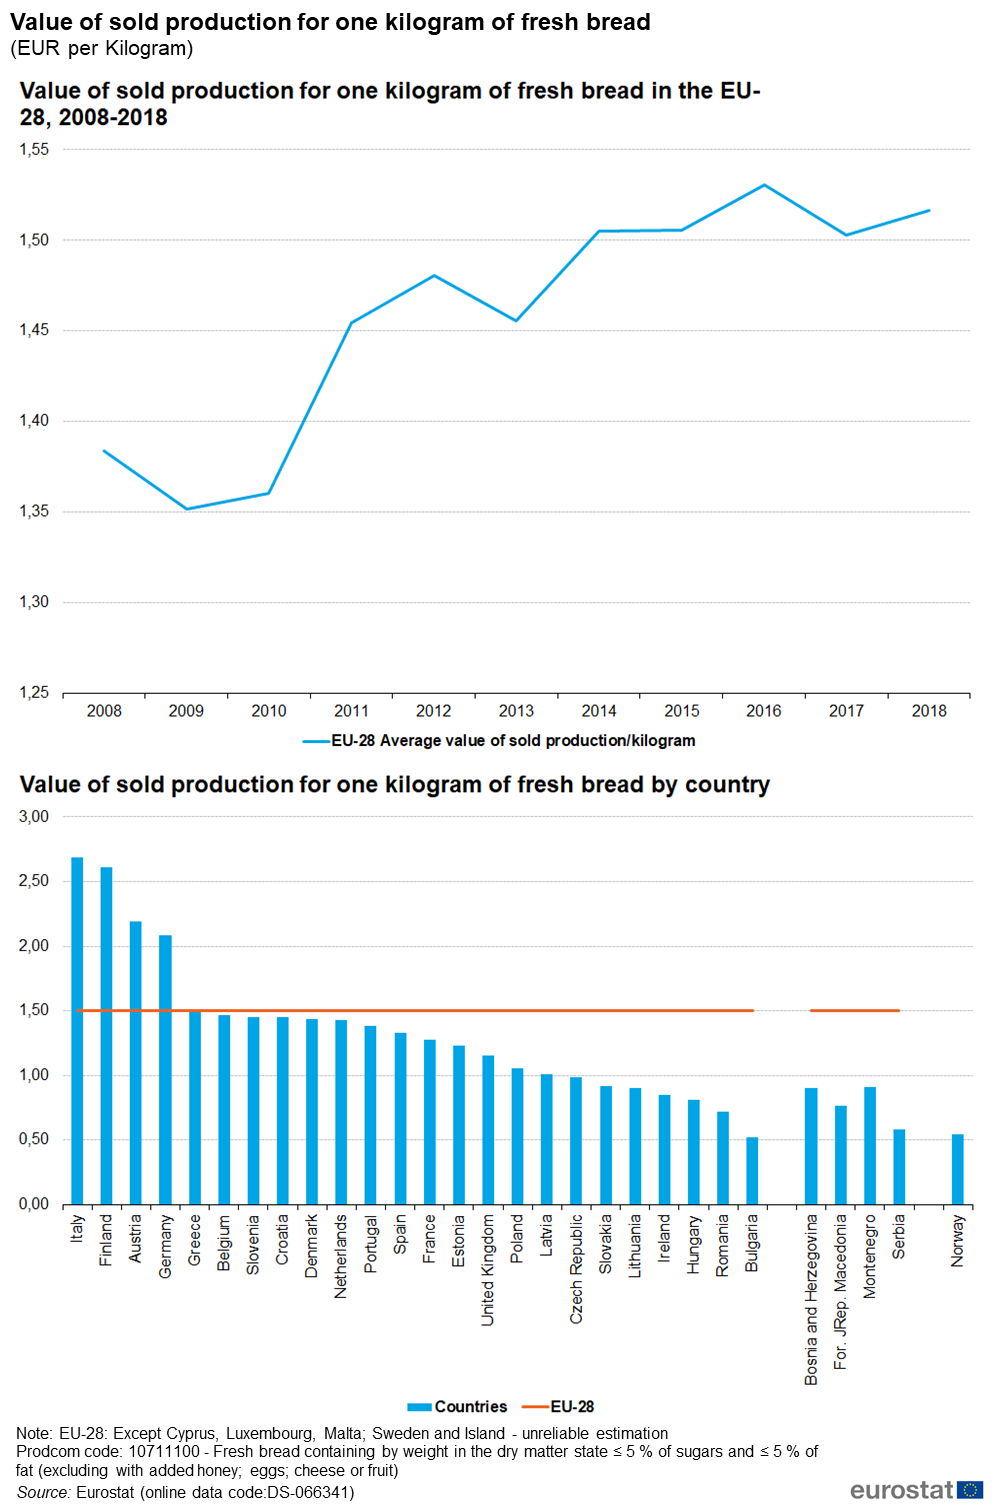
Value of sold production for one kilogram of fresh bread in EU, 2012-2022 (EUR per Kilogram).png
(
file
)
328 KB
1
12:02, 18 July 2023
Value of sold production for one kilogram of fresh bread in EU, 2012-2022.png
(
file
)
373 KB
1
11:59, 18 July 2023
Sold production of motor vehicles, trailers and semi-trailers in EU, 2022.png
(
file
)
57 KB
1
11:56, 29 July 2022
1. Evolution of EU's value of sold industrial production, 2011 - 2021 (2015=100).png
(
file
)
50 KB
1
21:43, 13 July 2021
Industrial production tables and figures.xlsx
(
file
)
349 KB
7
20:37, 13 July 2021
EU value of sold industrial production, by country, 2020 (% of total value of sold production).png
(
file
)
62 KB
2
17:02, 13 July 2021
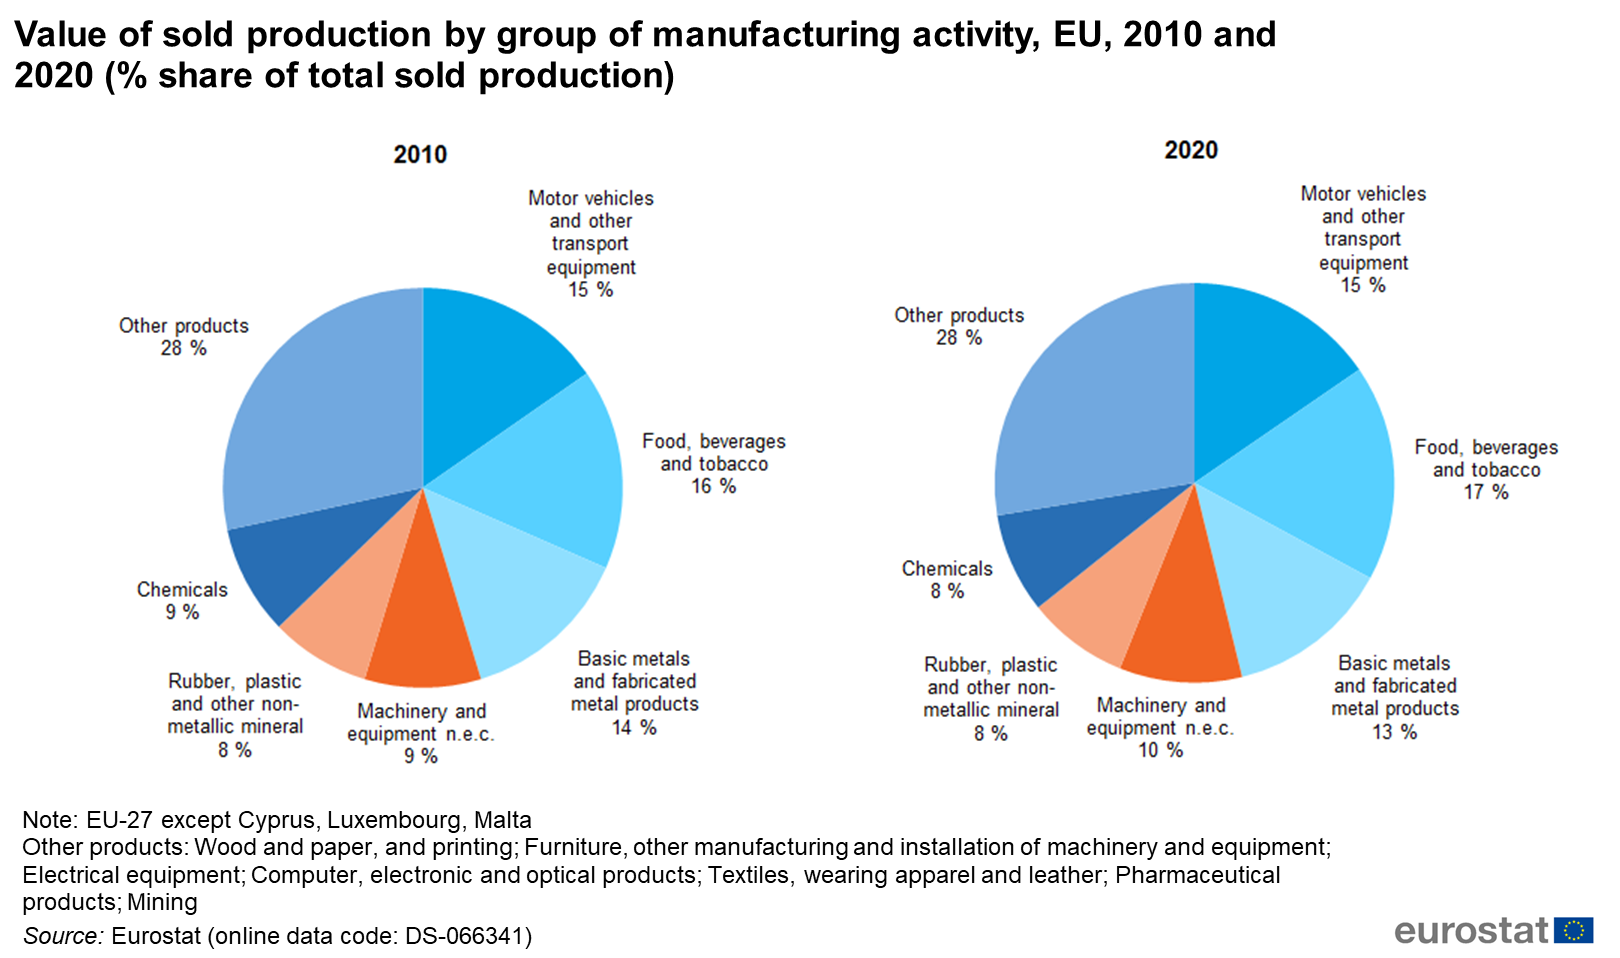
Value of sold production by group of manufacturing activity, EU, 2010 and 2020 (% share of total sold production).png
(
file
)
312 KB
2
14:16, 13 July 2021
Sold production of motor vehicles, trailers and semi-trailers in EU, 2020.png
(
file
)
59 KB
1
14:14, 9 July 2021
Sold production of wearing apparel in the EU, by country in 2020.png
(
file
)
73 KB
1
14:13, 9 July 2021
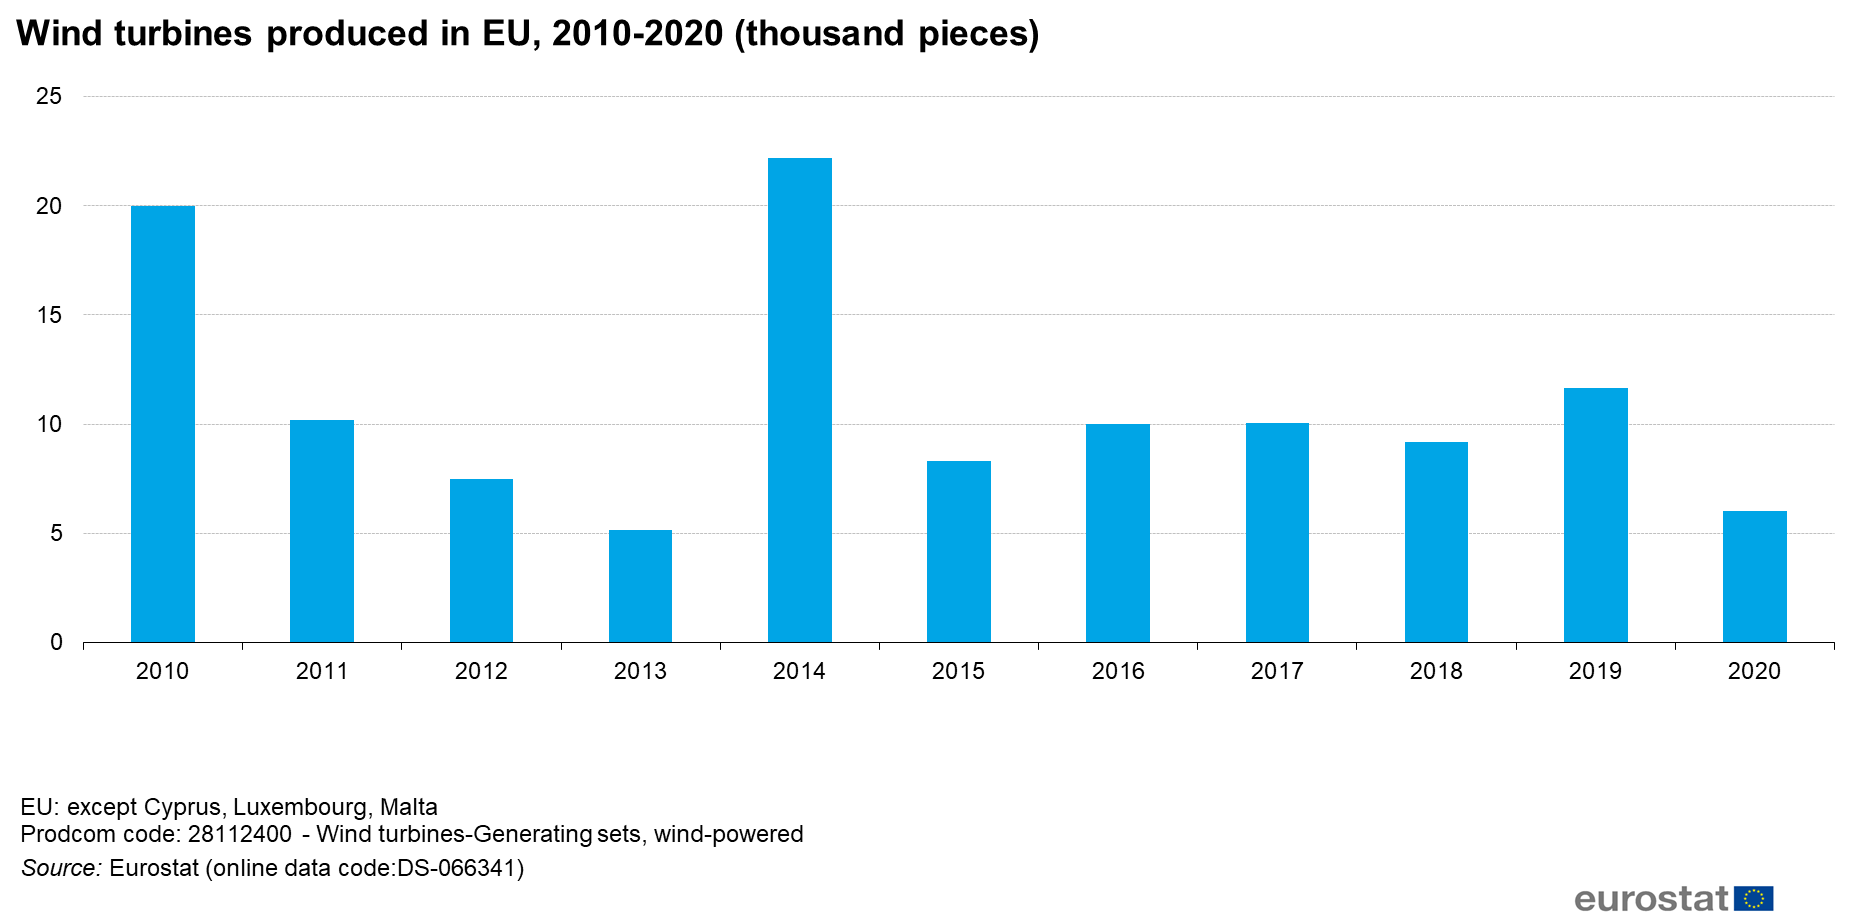
Wind turbines produced in EU, 2010-2020 (thousand pieces).png
(
file
)
74 KB
1
14:00, 9 July 2021
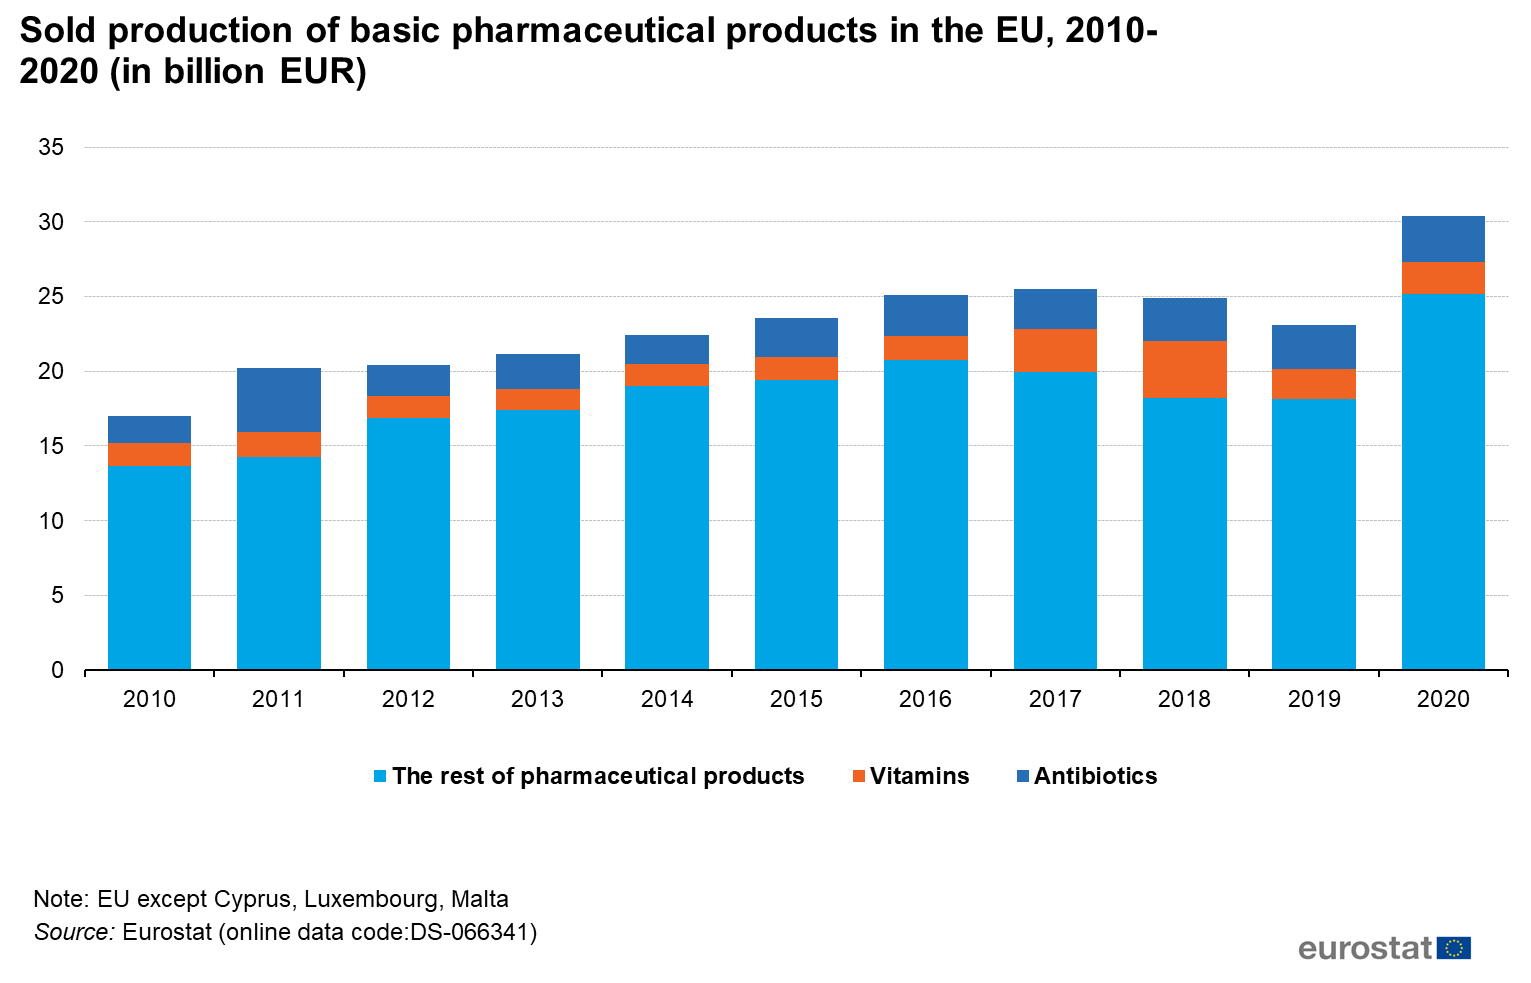
Sold production of basic pharmaceutical products in the EU, 2010-2020 (in billion EUR).png
(
file
)
86 KB
1
13:30, 9 July 2021
Evolution of EU's value of sold industrial production, 2010 - 2020 (2015=100) .png
(
file
)
63 KB
1
01:16, 20 January 2021
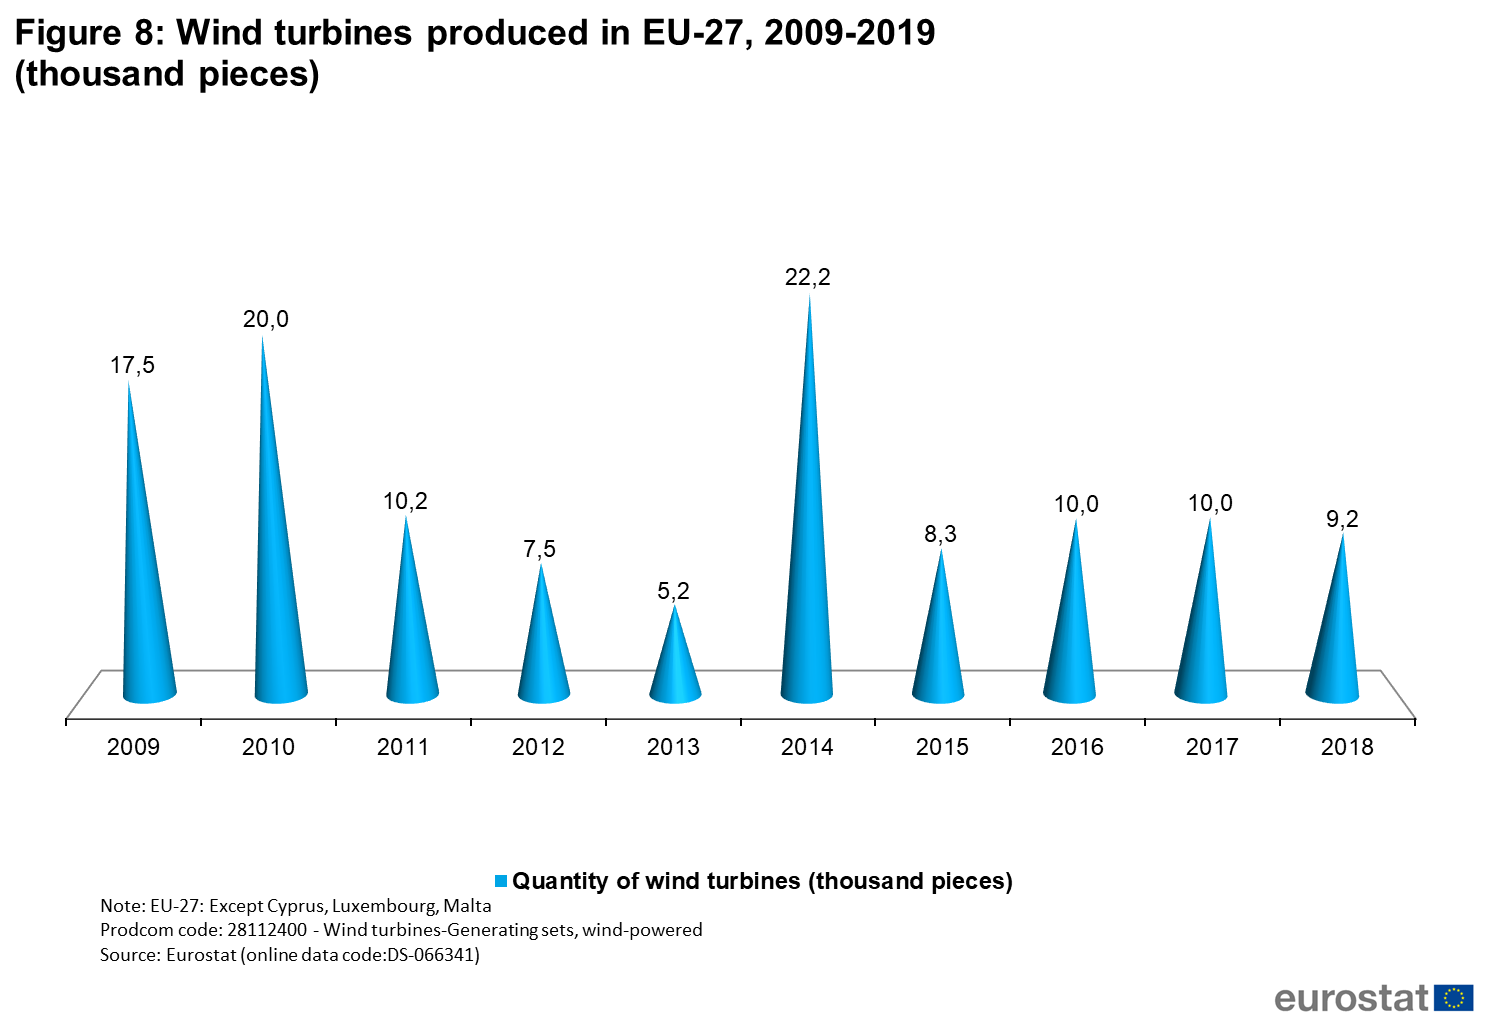
Figure 8 Wind turbines produced in EU-27, 2009-2019 (thousand pieces).png
(
file
)
195 KB
1
00:09, 20 January 2021
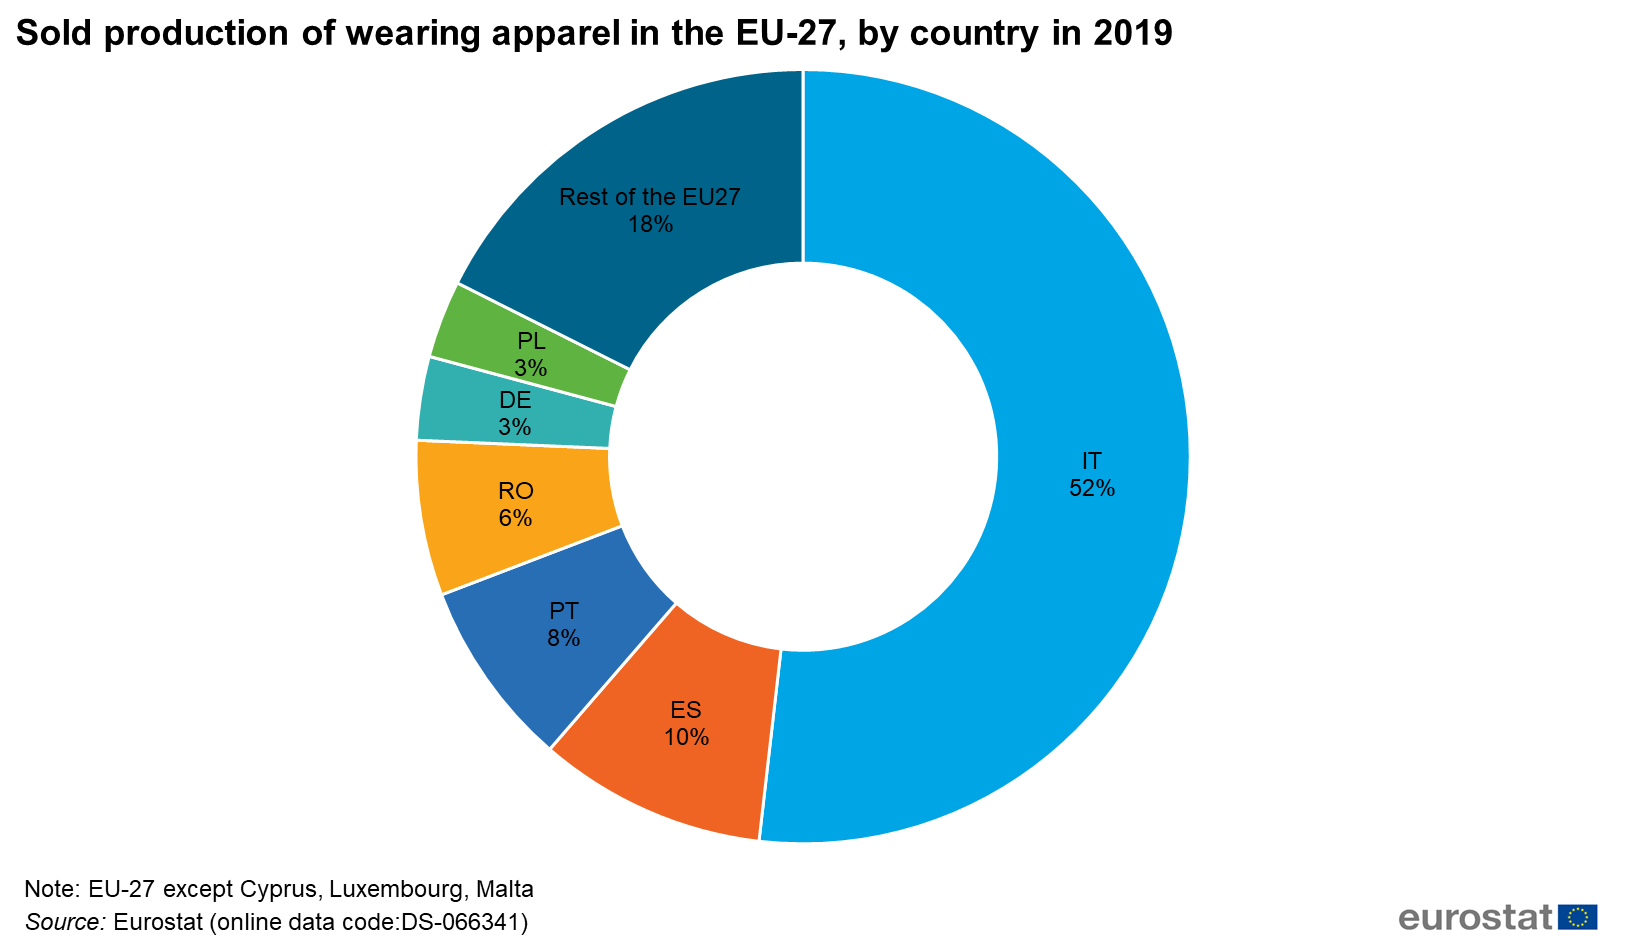
Figure 9 Sold production of wearing apparel in the EU-27, by country in 2019.png
(
file
)
90 KB
1
23:58, 19 January 2021
Figure 8 Production of generating sets, wind-powered in the EU-27, 2009-2019 (thousand pieces).png
(
file
)
72 KB
1
23:54, 19 January 2021
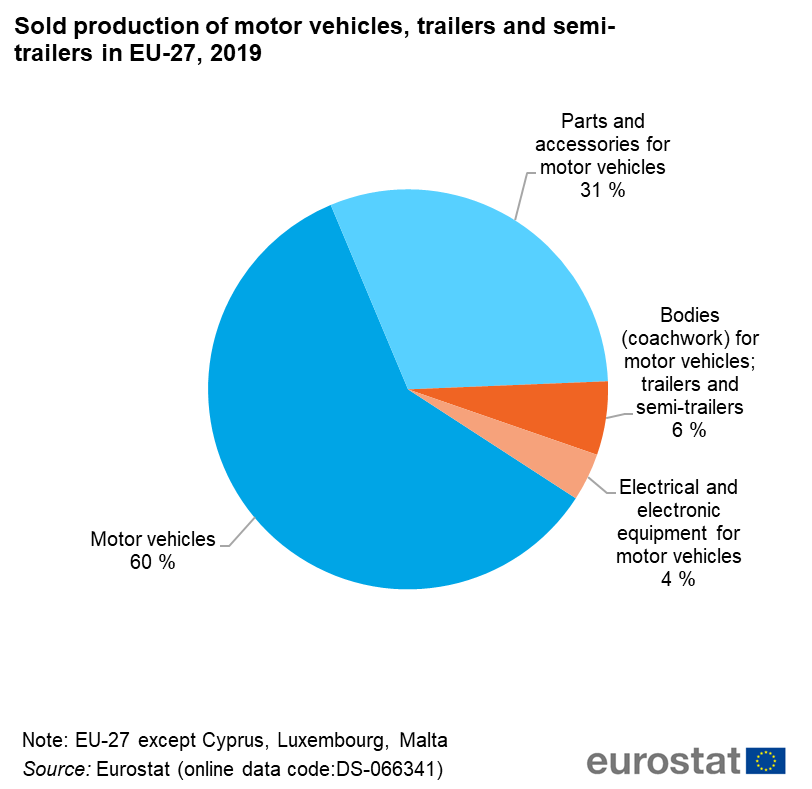
Figure 5 Sold production of motor vehicles, trailers and semi-trailers in EU-27, 2019.png
(
file
)
58 KB
1
23:40, 19 January 2021
Figure 3 Value of sold production by group of manufacturing activity, EU-27, 2009 and 2019 (% share of total sold production).png
(
file
)
335 KB
1
23:28, 19 January 2021
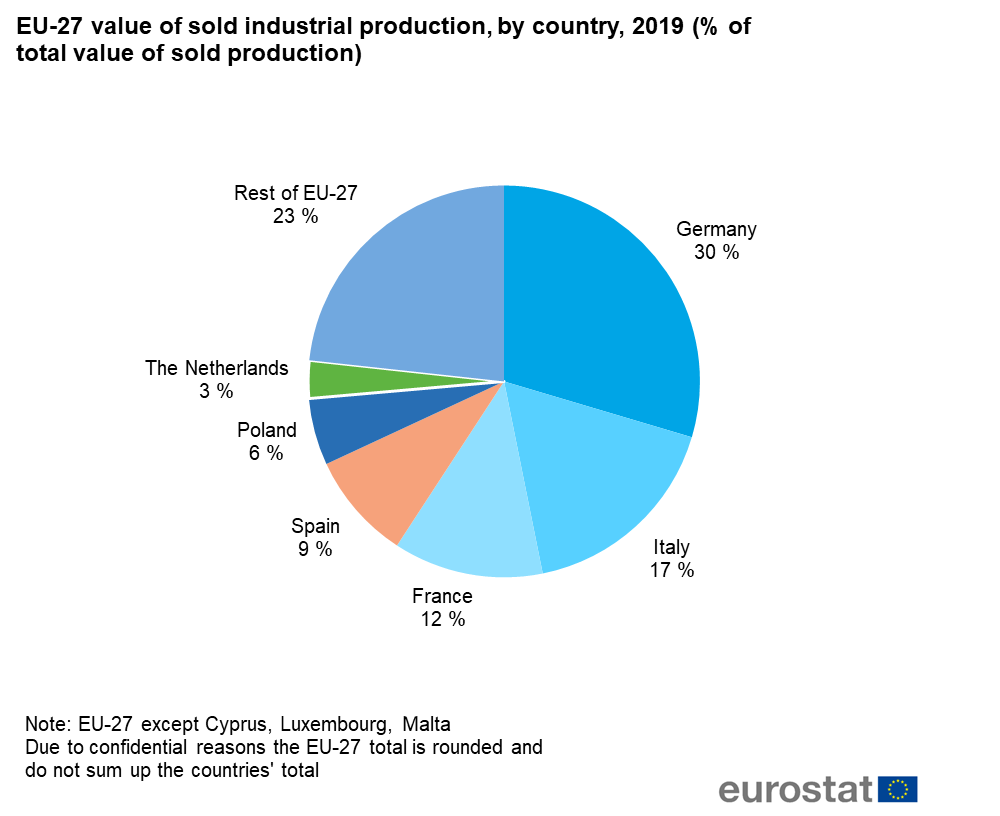
Figure 2 EU-27 value of sold industrial production, by country, 2019 (% of total value of sold production).png
(
file
)
61 KB
1
15:45, 24 January 2020
Industrial production statistics tables and graphs - 2018.xlsx
(
file
)
207 KB
1
15:43, 24 January 2020
Figure 9- Production of consumer electronics in the EU-28 in 2018(%).png
(
file
)
47 KB
1
15:42, 24 January 2020
Figure 9 Production of consumer electronics in the EU-28 in 2018(%).png
(
file
)
47 KB
2
15:38, 24 January 2020
Figure 9 Production of consumer electronics in the EU-28 in 2018 (%).png
(
file
)
47 KB
3
13:24, 24 January 2020
Industrial production statistics tables and graphs2018.xlsx
(
file
)
207 KB
1
14:47, 22 January 2020
Industrial production statistics tables and graphs 2018.xlsx
(
file
)
207 KB
2
14:32, 22 January 2020
Figure 1 Evolution of EU-28's value of sold industrial production 2008 - 2018 (2015=100).png
(
file
)
41 KB
3
14:20, 22 January 2020
Figure 1a Evolution of EU-28's value of sold industrial production, 2008 - 2018 (2015=100).png
(
file
)
41 KB
1
14:19, 22 January 2020
Figure 1 Evolution of EU-28's value of sold industrial production, 2008 - 2018 (2015=100).png
(
file
)
41 KB
7
16:30, 20 December 2019
Figure 8 Sold production of wearing apparel in the EU-28, by country in 2018.png
(
file
)
49 KB
1
16:23, 20 December 2019
Figure 7 Sold production of basic pharmaceutical products in the EU-28, 2008-2018 (in bil EUR).png
(
file
)
69 KB
1
16:19, 20 December 2019
Figure 6 Value of sold production for one kilogram of fresh bread (EUR per Kilogram).png
(
file
)
245 KB
1
16:13, 20 December 2019
Figure 5 Sold production of motor vehicles, trailers and semi-trailers in EU-28, 2018.png
(
file
)
33 KB
4
13:37, 20 December 2019
Figure 3 Value of sold production by group of manufacturing activity, EU-28, 2008 and 2018 (% share of total sold production).png
(
file
)
78 KB
1
13:33, 20 December 2019
Figure3 Value of sold production by group of manufacturing activity, EU-28, 2008 and 2018 (% share of total sold production).png
(
file
)
78 KB
1
13:18, 20 December 2019
Evolution of EU-28's value of sold industrial production, 2008 - 2018 (2015=100).png
(
file
)
41 KB
1
13:11, 20 December 2019
Figure 2 EU-28 value of sold industrial production, by country, 2018 (% of total value of sold production).png
(
file
)
36 KB
1
Special page
ISSN 2443-8219
.png)
V1.png)
_V1.png)
.png)
.png)
_.png)
.png)

.png)
.png)
.png)


.png)
.png)
.png)


.png)
.png)
_.png)
.png)

.png)

.png)
.png)
.png)
.png)
.png)
.png)
.png)
.png)

.png)
.png)

.png)
.png)
.png)
.png)