Tutorials
Log in
Statistics Explained
menu
search
search
Navigation
Main page
Statistical themes
Glossary
Categories
Statistics 4 beginners
Tutorials
Help
Eurostat home
Education corner
Online publications
Regional yearbook
Sustainable development
Full list
Tools
User contributions
Logs
View user groups
Special pages
search
Navigation
Main page
Statistical themes
Glossary
Categories
Statistics 4 beginners
Tutorials
Help
Eurostat home
Education corner
Online publications
Regional yearbook
Sustainable development
Full list
Tools
User contributions
Logs
View user groups
Special pages
Navigation
Main page
Statistical themes
Glossary
Categories
Statistics 4 beginners
Tutorials
Help
Eurostat home
Education corner
Online publications
Regional yearbook
Sustainable development
Full list
Tools
User contributions
Logs
View user groups
Special pages
Uploads by Marrare
This special page shows all uploaded files.
File list
Items per page:
20
50
100
250
500
Search for media name:
Username:
Include old versions of files
Go
First page
Previous page
Next page
Last page
Date
Name
Thumbnail
Size
Description
Versions
12:27, 21 March 2018
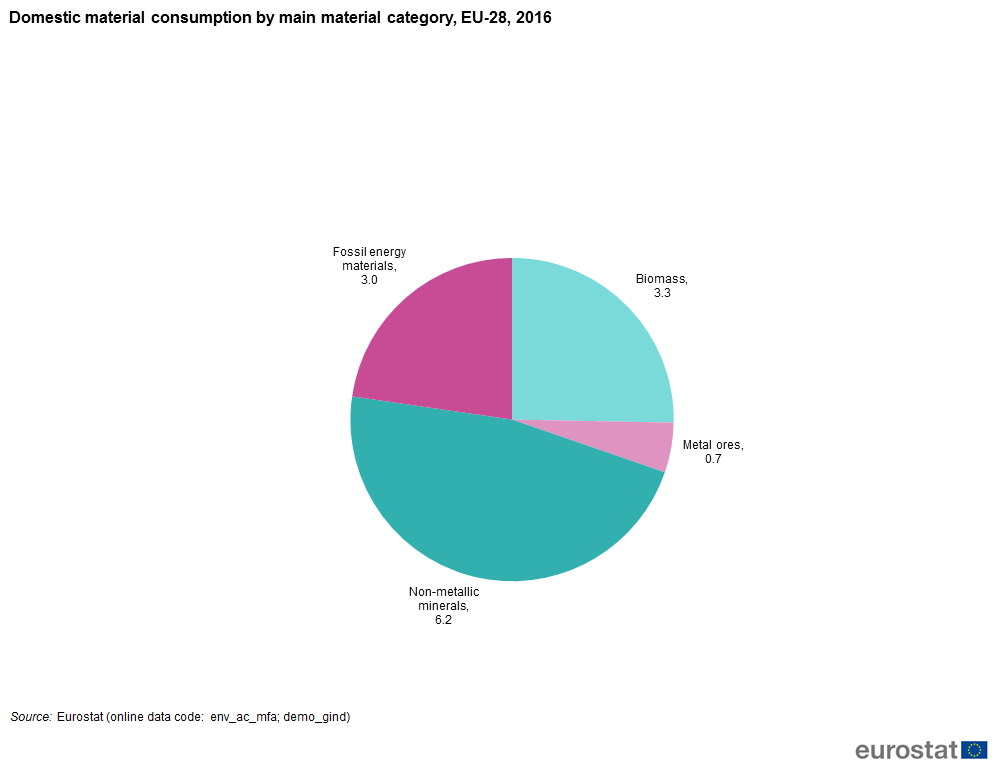
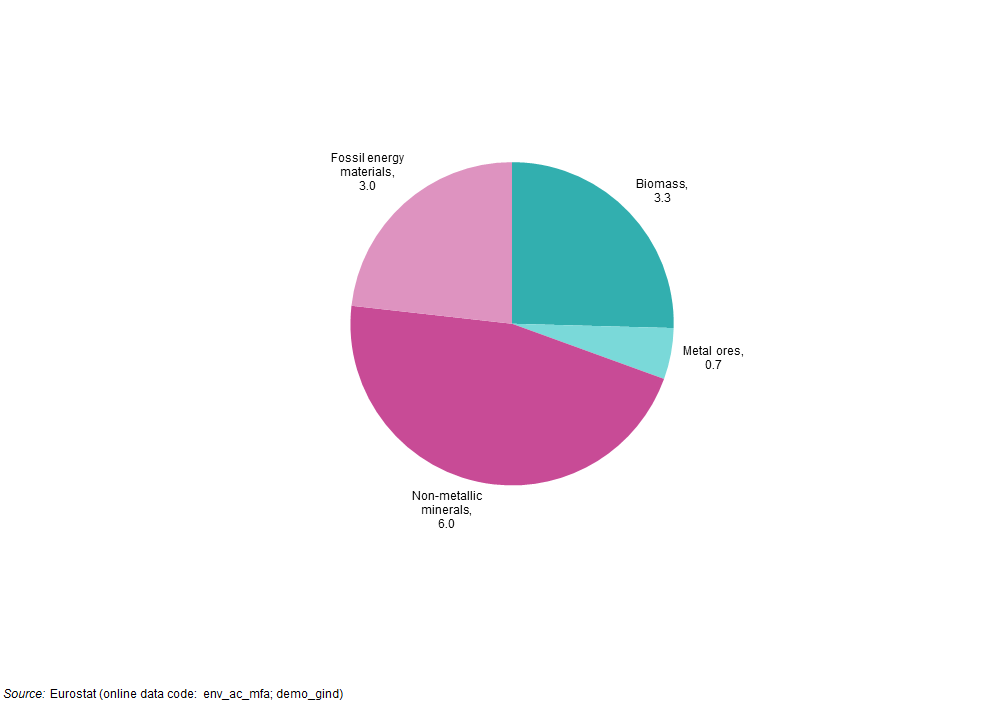
Domestic material consumption by main material category, EU-28, 2016 .png
(
file
)
23 KB
1
12:26, 21 March 2018
Development of domestic material consumption by main material category, EU-28, 2000-16 .png
(
file
)
38 KB
1
22:25, 17 March 2018
Import dependency by main material category, EU-28, 2000-2016 (% of EU imports in total materials made available to EU-28 economy) Mar2018.png
(
file
)
12 KB
1
22:24, 17 March 2018
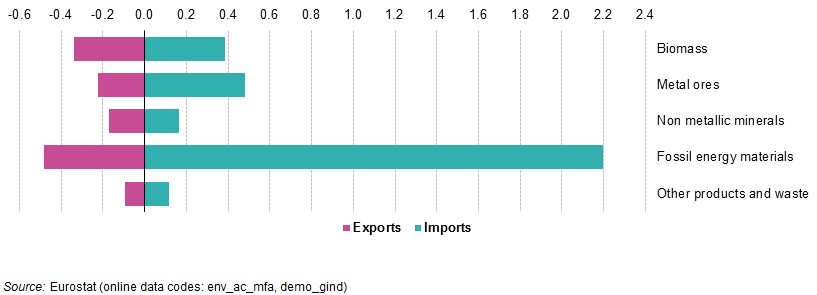
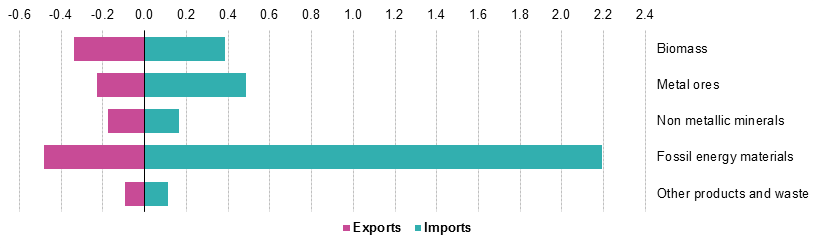
Physical imports and exports by main material category, EU-28, 2016 (tonnes per capita) Mar2018.png
(
file
)
12 KB
1
22:24, 17 March 2018
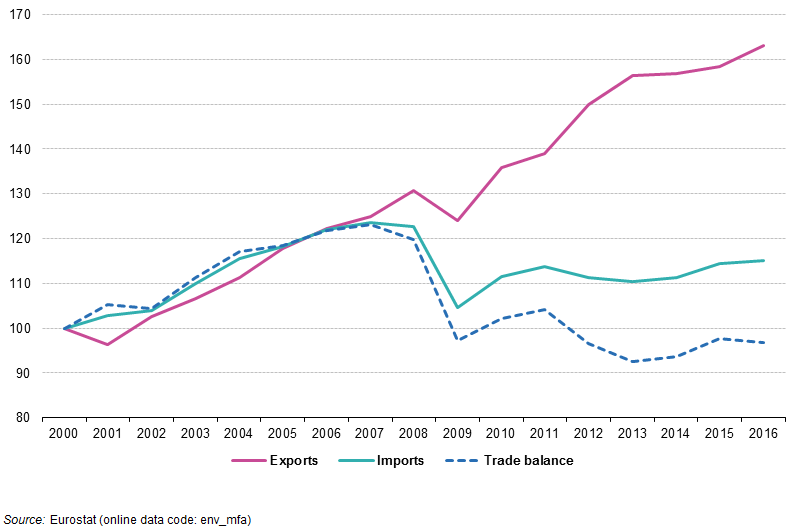
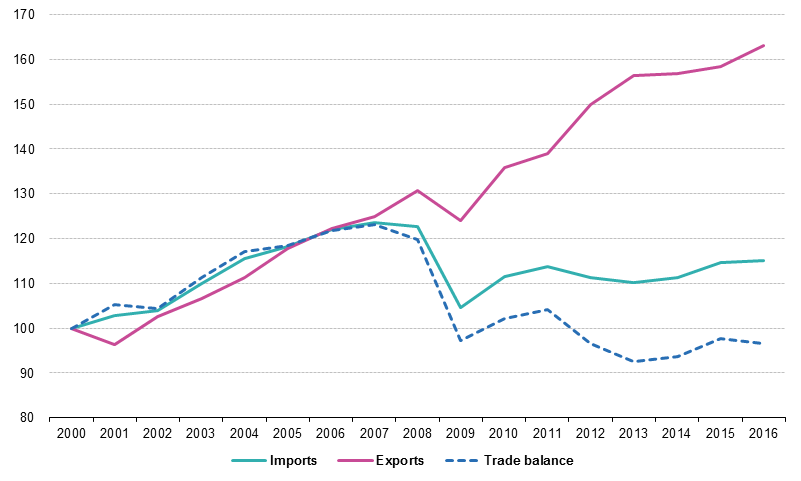
EU-28 Imports, exports and trade balance, 2000-2016 (Index 2000 = 100) Mar2018.png
(
file
)
22 KB
1
22:22, 17 March 2018
Physical imports and exports March2018.xlsx
(
file
)
88 KB
1
22:19, 17 March 2018
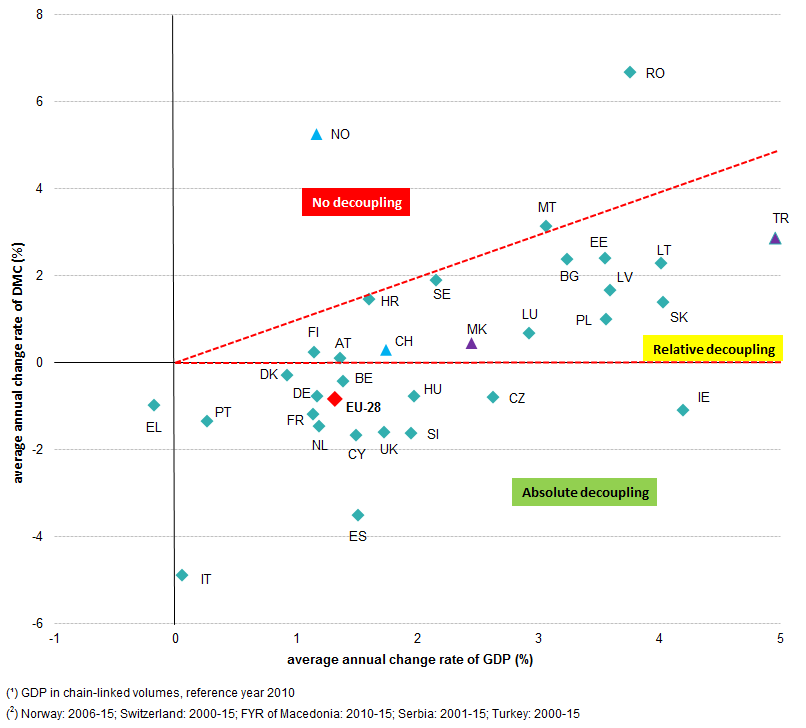
DMC and GDP average annual change rates in EU-28 and countries between 2000 and 2016 (%) Mar2018new.png
(
file
)
19 KB
1
22:15, 17 March 2018
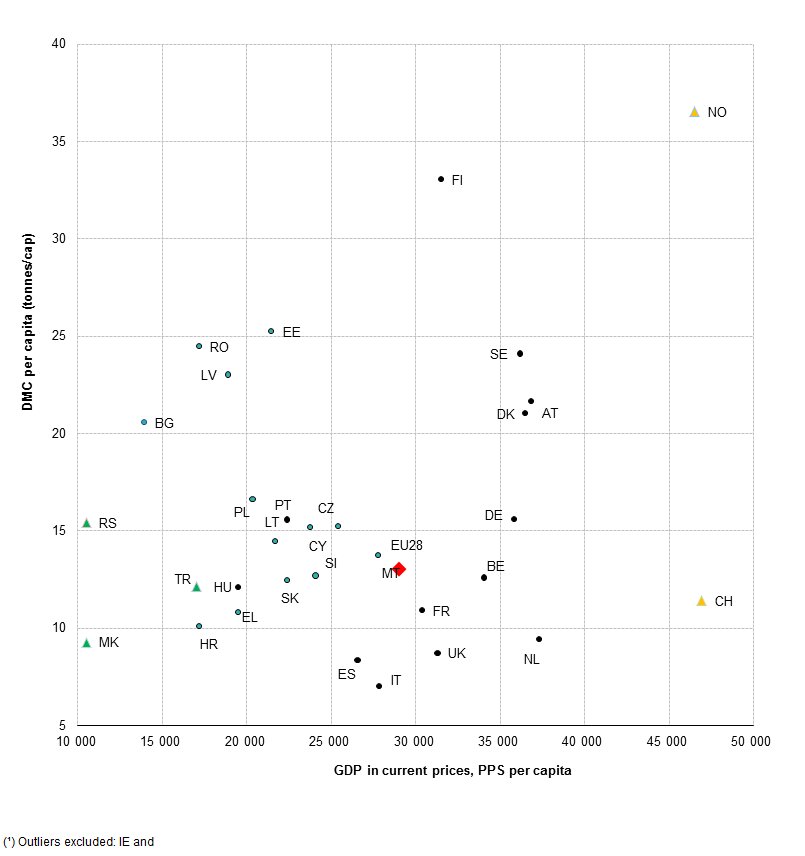
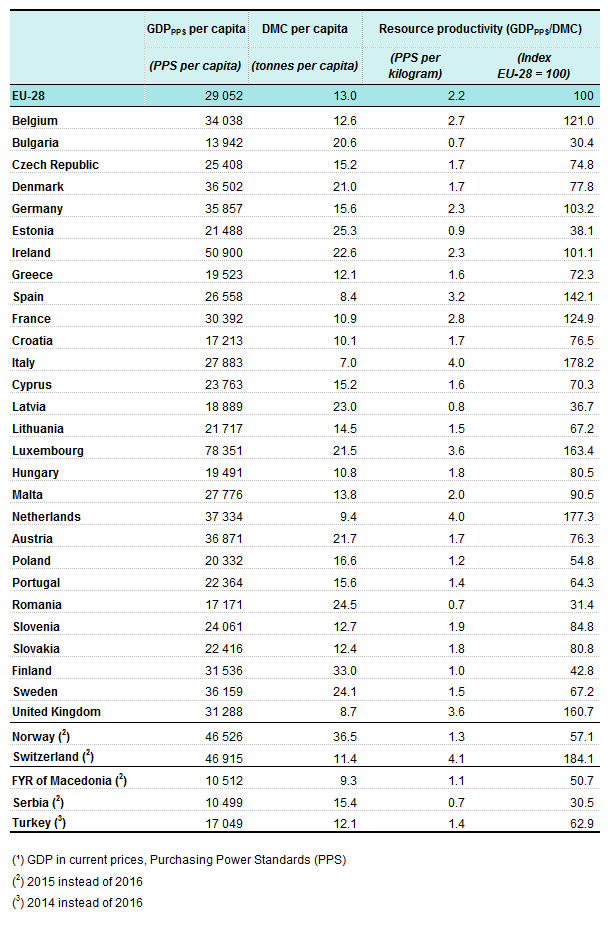
Resource productivity, GDP and DMC, by country, 2016 Mar2018new.png
(
file
)
46 KB
1
21:57, 17 March 2018
DMC and GDP average annual change rates in EU-28 and countries between 2000 and 2016 (%) Mar2018.PNG
(
file
)
19 KB
1
21:57, 17 March 2018
Resource productivity, GDP and DMC, by country, 2016 Mar2018.png
(
file
)
46 KB
1
21:56, 17 March 2018
Resource productivity, cross-country comparison, 2016 Mar2018.png
(
file
)
35 KB
1
21:56, 17 March 2018
Resource productivity - GDP DMC by country, 2000-16 (Index 2000 = 100) Mar2018.png
(
file
)
71 KB
1
21:55, 17 March 2018
EU-28 resource productivity in comparison to GDP and DMC, 2000-16 (Index 2000=100) Mar2018.png
(
file
)
18 KB
1
21:54, 17 March 2018
Resource productivity March2018.xlsx
(
file
)
80 KB
1
21:43, 17 March 2018
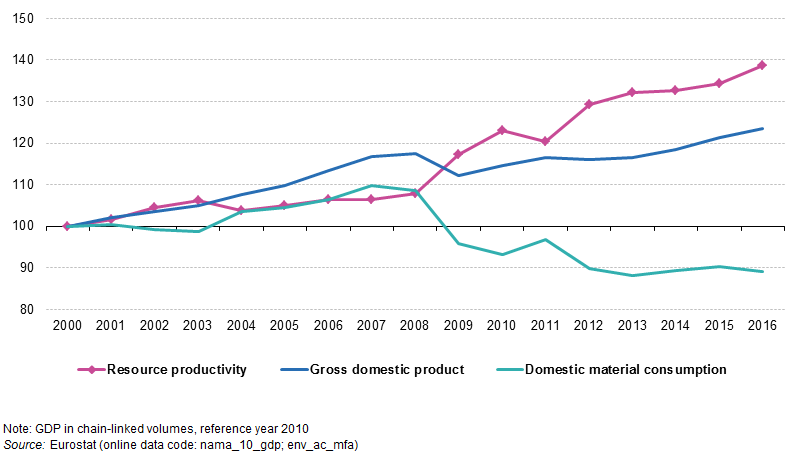
Development of resource productivity in comparison with GDP and DMC, EU-28, 2000–16 (2000 = 100) Mar2018.png
(
file
)
21 KB
1
21:43, 17 March 2018
Development of domestic extraction and physical trade, EU-28, 2000–16 (2000 = 100) Mar2018.png
(
file
)
28 KB
1
21:42, 17 March 2018
Domestic material consumption by main material category, EU-28, 2016 (tonnes per capita) Mar2018.png
(
file
)
16 KB
1
21:42, 17 March 2018
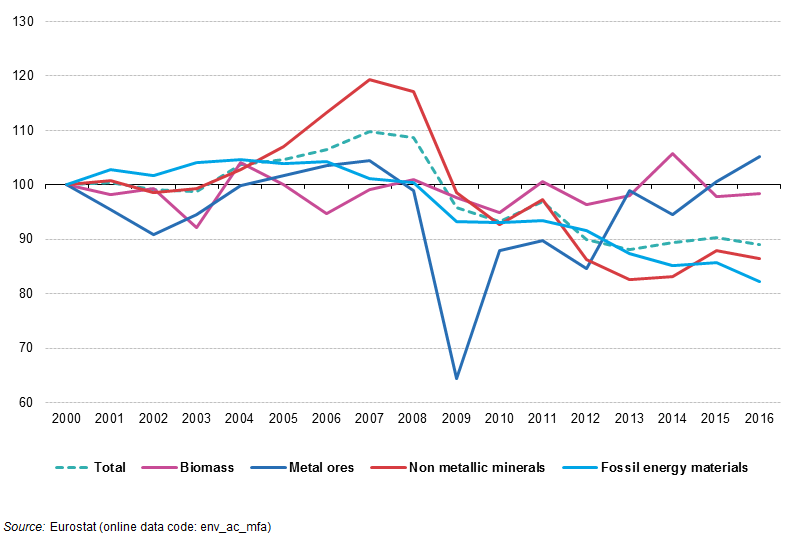
Development of domestic material consumption by main material category, EU-28, 2000–16 (2000 = 100) Mar2018.png
(
file
)
32 KB
1
21:41, 17 March 2018
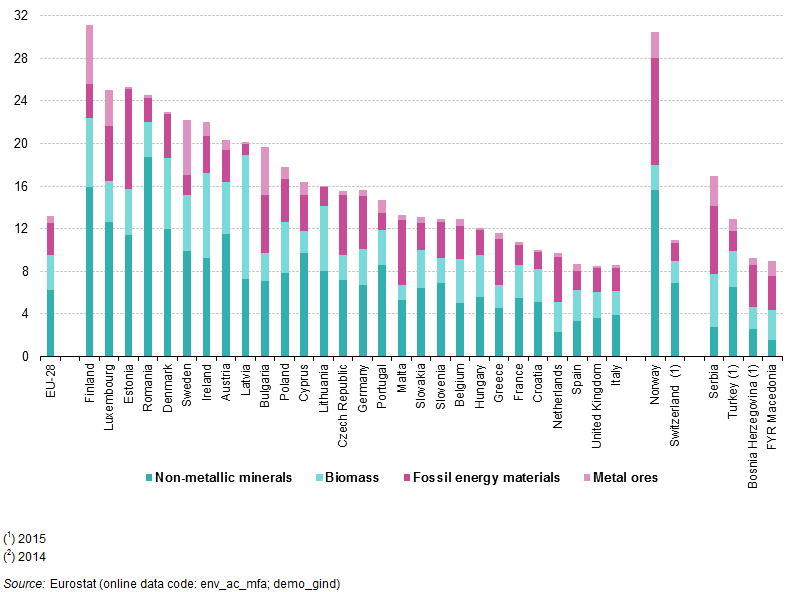
Domestic material consumption by main material category, 2016 (tonnes per capita) Mar2018.png
(
file
)
38 KB
1
21:40, 17 March 2018
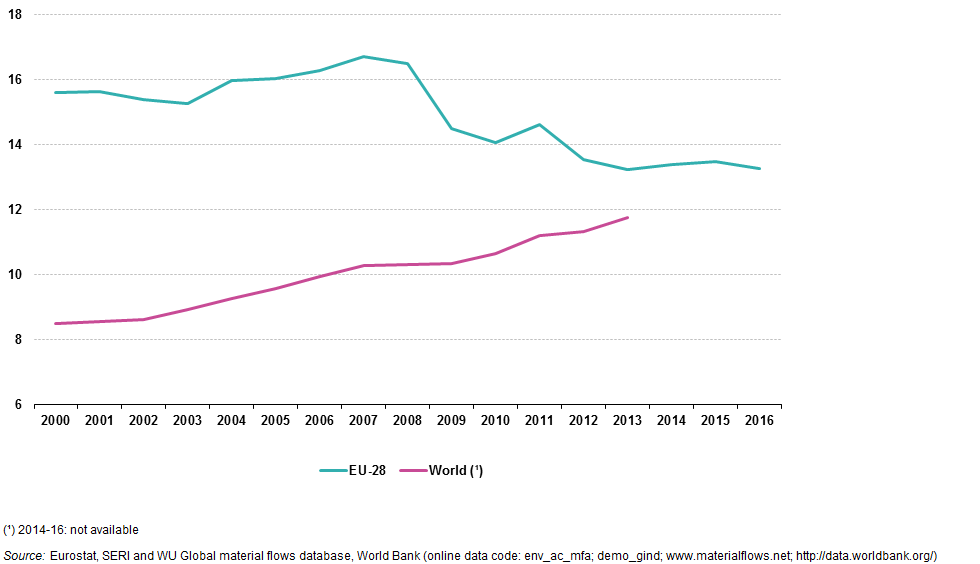
Development of material consumption in EU-28 and world, 2000–16 (tonnes per capita) Mar2018.png
(
file
)
17 KB
1
20:48, 17 March 2018
Development of material consumption in EU-28 and world, 2000–16 (tonnes per capita).png
(
file
)
17 KB
2
20:46, 17 March 2018
Development of domestic material consumption by main material category, EU-28, 2000–16 (2000 = 100).png
(
file
)
32 KB
1
20:45, 17 March 2018
Development of domestic extraction and physical trade, EU-28, 2000–16 (2000 = 100).png
(
file
)
28 KB
1
20:44, 17 March 2018
Development of resource productivity in comparison with GDP and DMC, EU-28, 2000–16 (2000 = 100).png
(
file
)
21 KB
1
20:43, 17 March 2018
Material flow accounts March2018.xlsx
(
file
)
88 KB
1
12:13, 28 June 2017
Material flow accounts YB June2017new.xlsx
(
file
)
90 KB
1
11:59, 28 June 2017
Domestic material consumption by main material category, EU-28, 2016 (tonnes per capita)new.png
(
file
)
16 KB
1
11:29, 28 June 2017
DMC and GDP(1) - average annual change rates in EU-28 and countries(2) between 2000 and 2016 (%).png
(
file
)
27 KB
1
11:09, 28 June 2017
Resource productivity (¹), cross-country comparison, 2016.png
(
file
)
31 KB
1
11:09, 28 June 2017
Resource productivity, GDP(¹) and DMC, by country, 2016.png
(
file
)
40 KB
1
11:08, 28 June 2017
DMC and GDP(1) - average annual change rates in EU-28 and countries(2) between 2000 and 2016 (%).PNG
(
file
)
27 KB
1
11:08, 28 June 2017
Resource productivity June2017.xlsx
(
file
)
83 KB
1
10:50, 28 June 2017
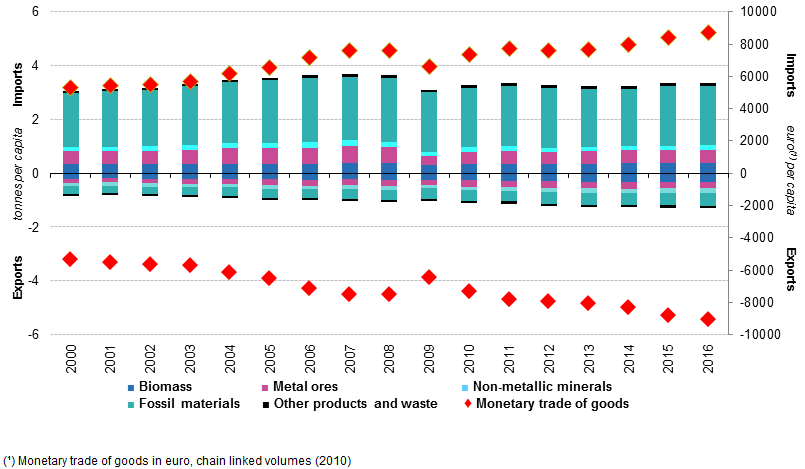
Physical trade of goods by main material category (tonnes per capita, left Y-axis) and monetary trade of goods (euro per capita, right Y-axis)(¹); EU-28, 2000-2016.png
(
file
)
27 KB
1
10:49, 28 June 2017
EU-28 Imports, exports and trade balance, 2000-2016 (Index 2000 = 100).png
(
file
)
20 KB
1
10:48, 28 June 2017
Physical imports and exports by main material category, EU-28, 2016 (tonnes per capita).png
(
file
)
10 KB
1
10:48, 28 June 2017
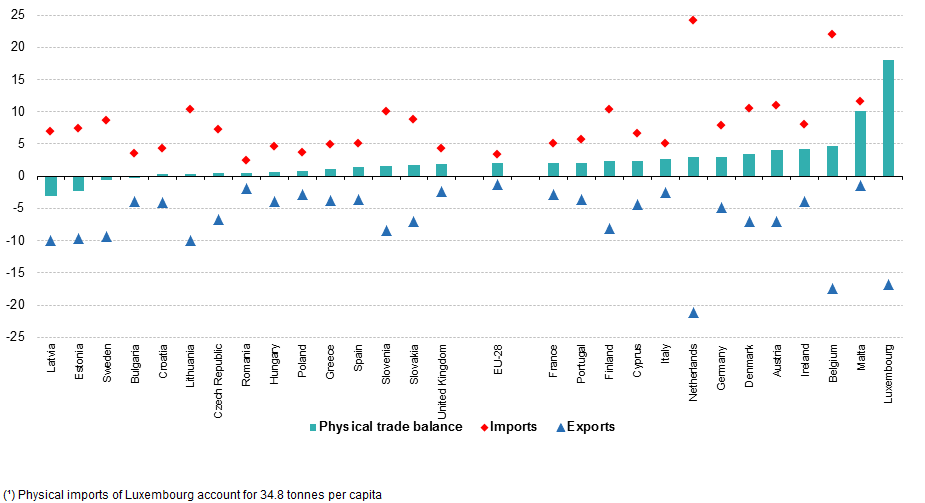
Physical trade balance (imports minus exports) by country, 2016 (tonnes per capita).png
(
file
)
19 KB
1
10:48, 28 June 2017
EU-28 imports and exports by stage of manufacturing, 2016 (tonnes per capita).PNG
(
file
)
15 KB
1
10:47, 28 June 2017
Import dependency by main material category, EU-28, 2000-2016 (% of EU imports in total materials made available to EU-28 economy).png
(
file
)
10 KB
1
10:47, 28 June 2017
Physical imports and exports June2017.xlsx
(
file
)
88 KB
1
14:22, 25 June 2017
Development of resource productivity in comparison with GDP and DMC, EU-28, 2000–16 (2000=100).png
(
file
)
21 KB
1
14:22, 25 June 2017
Development of domestic extraction and physical trade, EU-28, 2000–16 (2000=100).png
(
file
)
29 KB
1
14:21, 25 June 2017
Development of domestic material consumption by main material category, EU-28, 2000–16 (2000=100).png
(
file
)
31 KB
1
14:19, 25 June 2017
Material flow accounts YB June2017.xlsx
(
file
)
90 KB
1
11:36, 27 March 2017
Material flow accounts YB March2017 new.xlsx
(
file
)
89 KB
2
11:34, 27 March 2017
Domestic material consumption by main material category, 2015 (tonnes per capita) new.png
(
file
)
39 KB
1
11:33, 27 March 2017
Domestic material consumption by main material category, EU-28, 2015 (tonnes per capita) new.png
(
file
)
20 KB
1
23:42, 23 March 2017
Resource productivity March2017.xlsx
(
file
)
77 KB
2
23:34, 23 March 2017
EU-28 resource productivity in comparison to GDP(1) and DMC, 2000-15 (Index 2000=100).png
(
file
)
20 KB
1
23:32, 23 March 2017
Resource productivity - GDP(¹) DMC by country, 2000-15 (Index 2000 = 100).png
(
file
)
59 KB
1
23:31, 23 March 2017
Resource productivity(¹), cross-country comparison, 2015.png
(
file
)
23 KB
1
First page
Previous page
Next page
Last page
Special page
ISSN 2443-8219


_Mar2018.png)
_Mar2018.png)
_Mar2018new.png)

_Mar2018.PNG)


_Mar2018.png)
_Mar2018.png)
_Mar2018.png)
_Mar2018.png)
_Mar2018.png)
_Mar2018.png)
_Mar2018.png)
_Mar2018.png)
.png)
.png)
.png)
.png)
new.png)
_-_average_annual_change_rates_in_EU-28_and_countries(2)_between_2000_and_2016_(%25).png)
,_cross-country_comparison,_2016.png)
_and_DMC,_by_country,_2016.png)
_-_average_annual_change_rates_in_EU-28_and_countries(2)_between_2000_and_2016_(%25).PNG)
_and_monetary_trade_of_goods_(euro_per_capita,_right_Y-axis)(%C2%B9);_EU-28,_2000-2016.png)
.png)
.png)
_by_country,_2016_(tonnes_per_capita).png)
.PNG)
.png)
.png)
.png)
_new.png)
_new.png)
_and_DMC,_2000-15_(Index_2000%3D100).png)
_DMC_by_country,_2000-15_(Index_2000_%3D_100).png)
,_cross-country_comparison,_2015.png)
_Mar2018.png)
.png)