Tutorials
Log in
Statistics Explained
menu
search
search
Navigation
Main page
Statistical themes
Glossary
Categories
Statistics 4 beginners
Tutorials
Help
Eurostat home
Education corner
Online publications
Regional yearbook
Sustainable development
Full list
Tools
User contributions
Logs
View user groups
Special pages
search
Navigation
Main page
Statistical themes
Glossary
Categories
Statistics 4 beginners
Tutorials
Help
Eurostat home
Education corner
Online publications
Regional yearbook
Sustainable development
Full list
Tools
User contributions
Logs
View user groups
Special pages
Navigation
Main page
Statistical themes
Glossary
Categories
Statistics 4 beginners
Tutorials
Help
Eurostat home
Education corner
Online publications
Regional yearbook
Sustainable development
Full list
Tools
User contributions
Logs
View user groups
Special pages
Uploads by Dimodim
This special page shows all uploaded files.
File list
Items per page:
20
50
100
250
500
Search for media name:
Username:
Include old versions of files
Go
First page
Previous page
Next page
Last page
Date
Name
Thumbnail
Size
Description
Versions
09:45, 7 August 2019
ICT education ICT2018 final.xlsx
(
file
)
85 KB
1
15:57, 9 September 2019
ICT education ICT2018 final revised.xlsx
(
file
)
85 KB
1
16:20, 9 September 2019
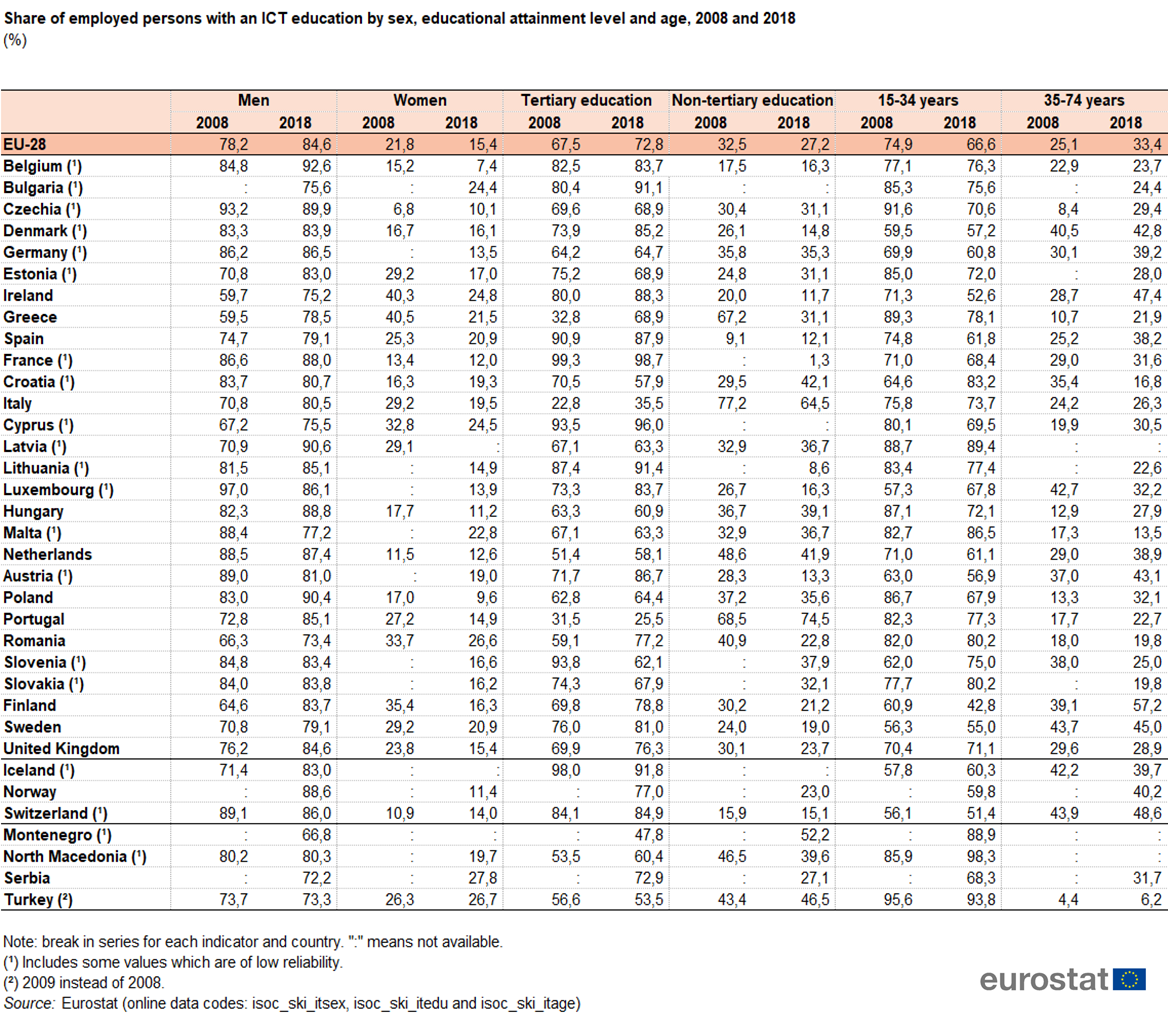
Share of employed persons with an ICT education by sex, educational attainment level and age, 2008 and 2018 (%)v2.png
(
file
)
675 KB
1
16:21, 9 September 2019
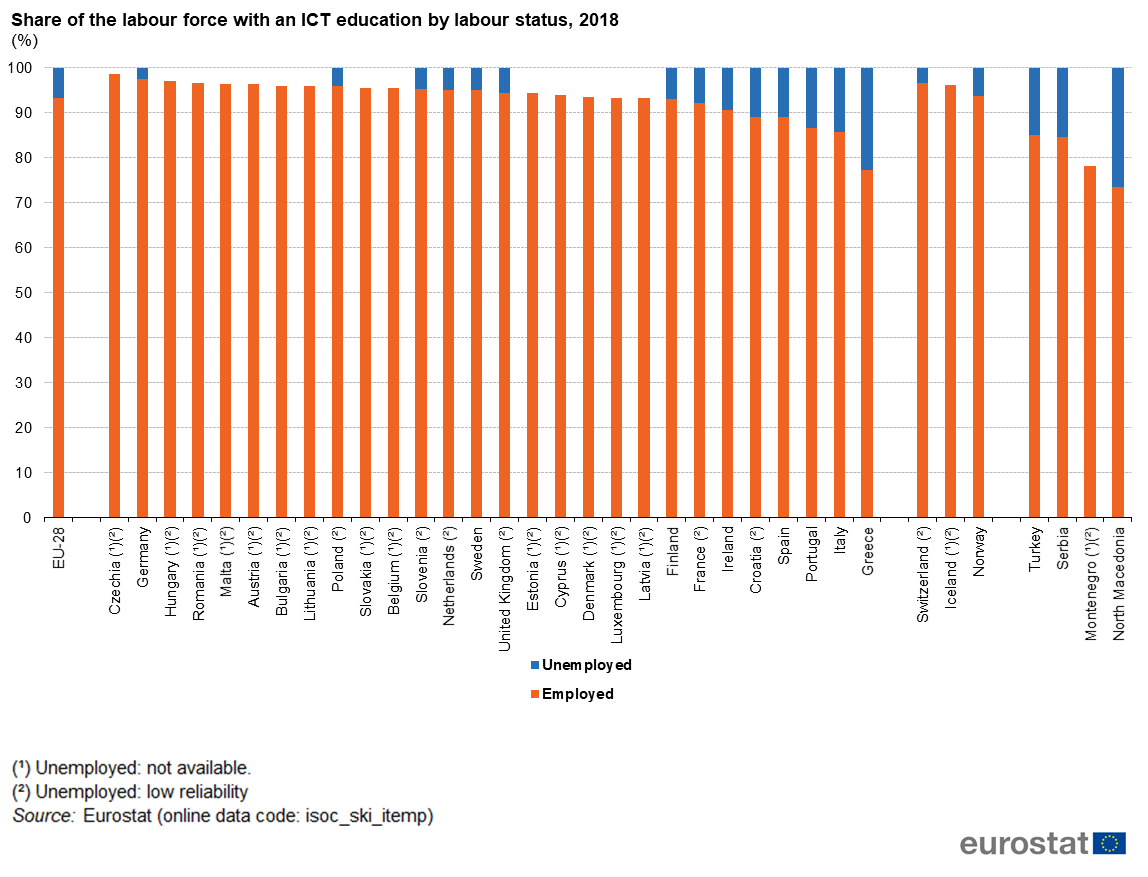
Share of the labour force with an ICT education by labour status, 2018 (%)v2.png
(
file
)
141 KB
1
16:23, 9 September 2019
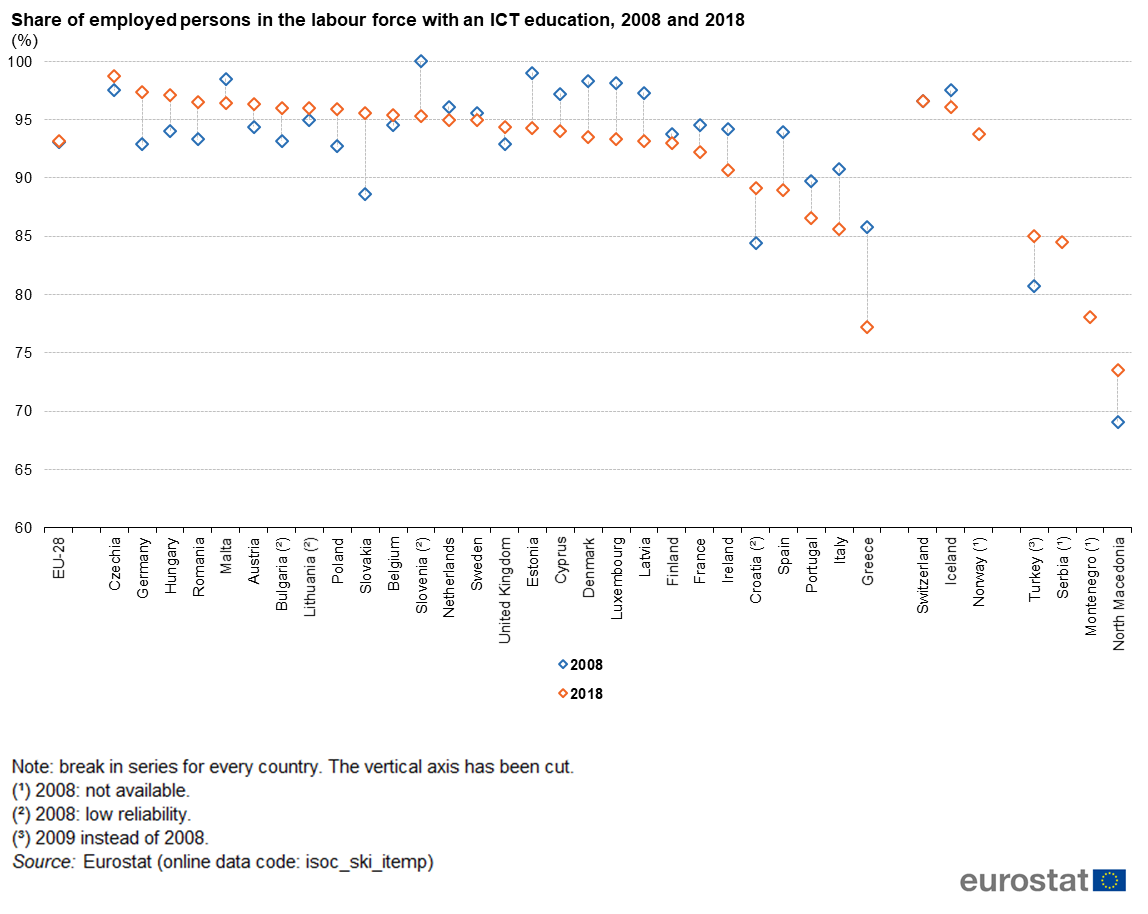
Share of employed persons in the labour force with an ICT education, 2008 and 2018 (%)v2.png
(
file
)
117 KB
1
16:24, 9 September 2019
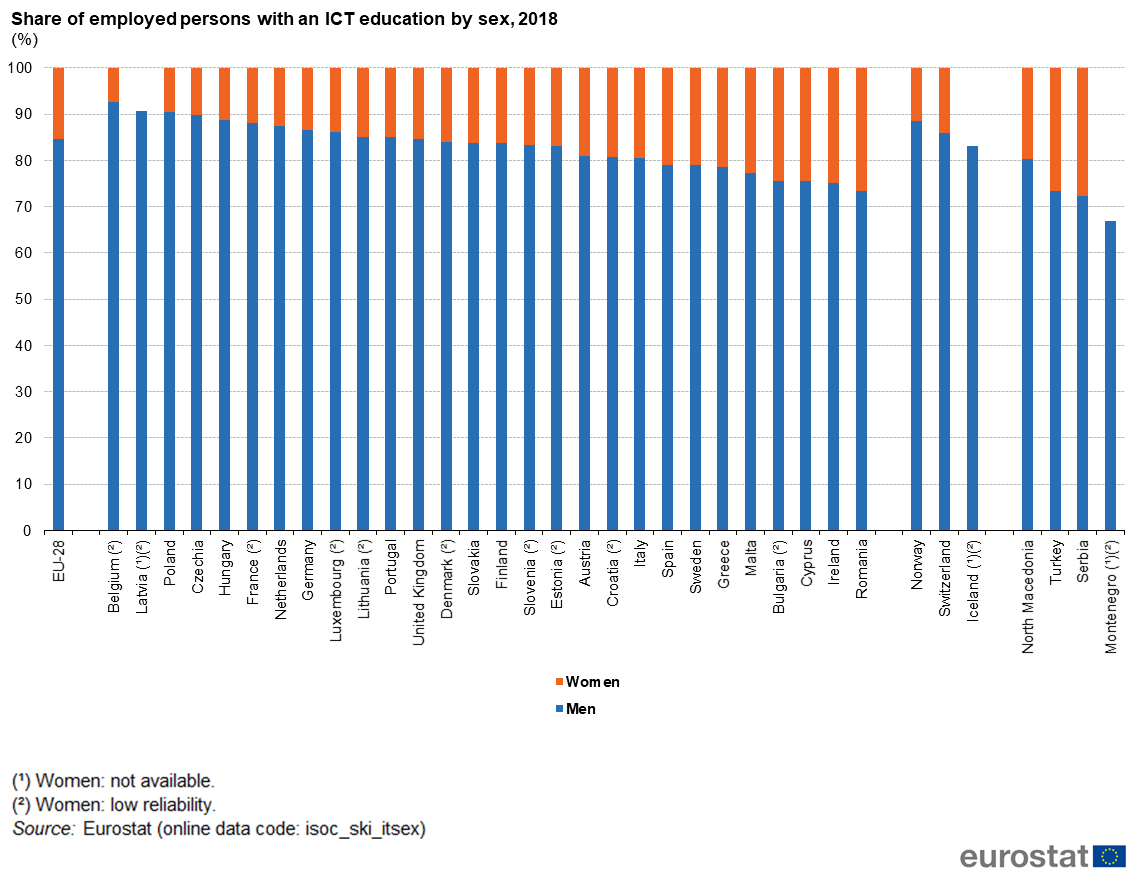
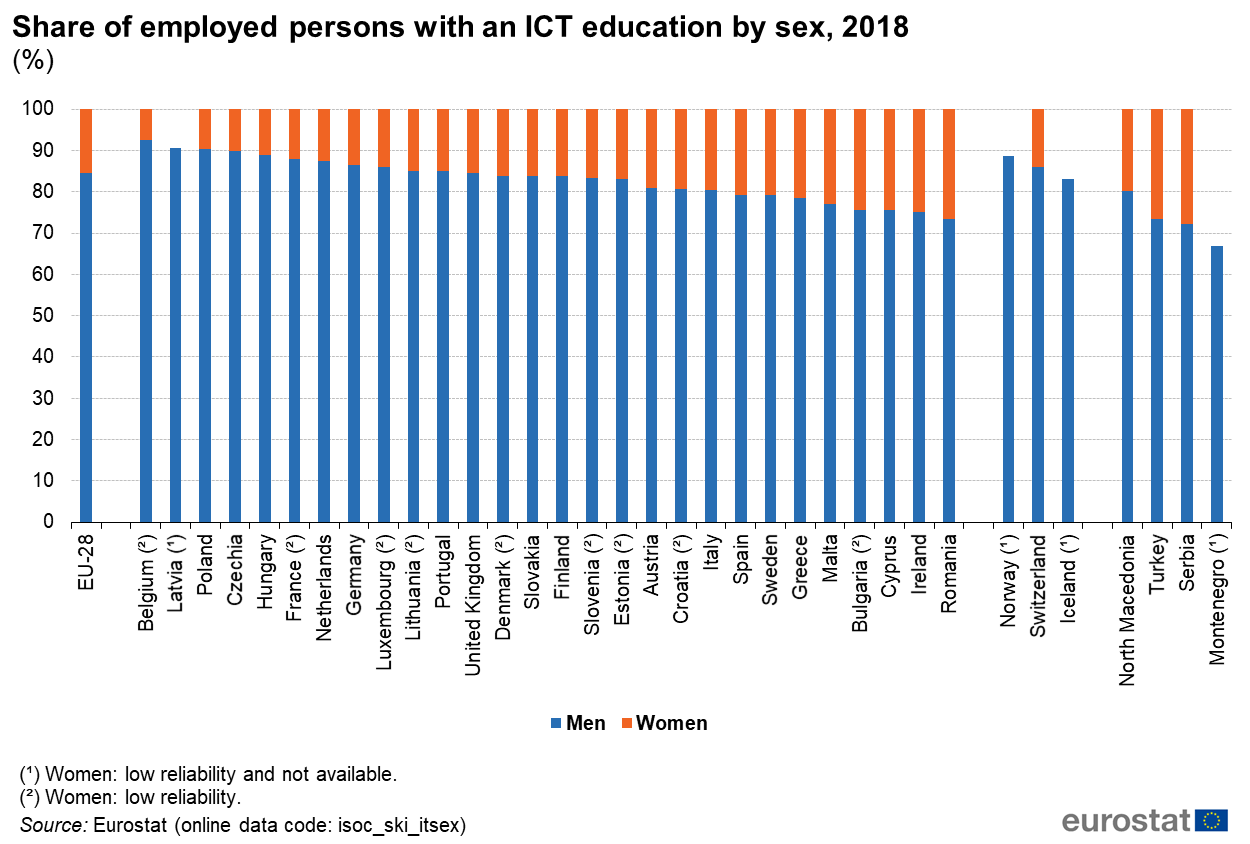
Share of employed persons with an ICT education by sex, 2018 (%)v2.png
(
file
)
139 KB
1
16:25, 9 September 2019
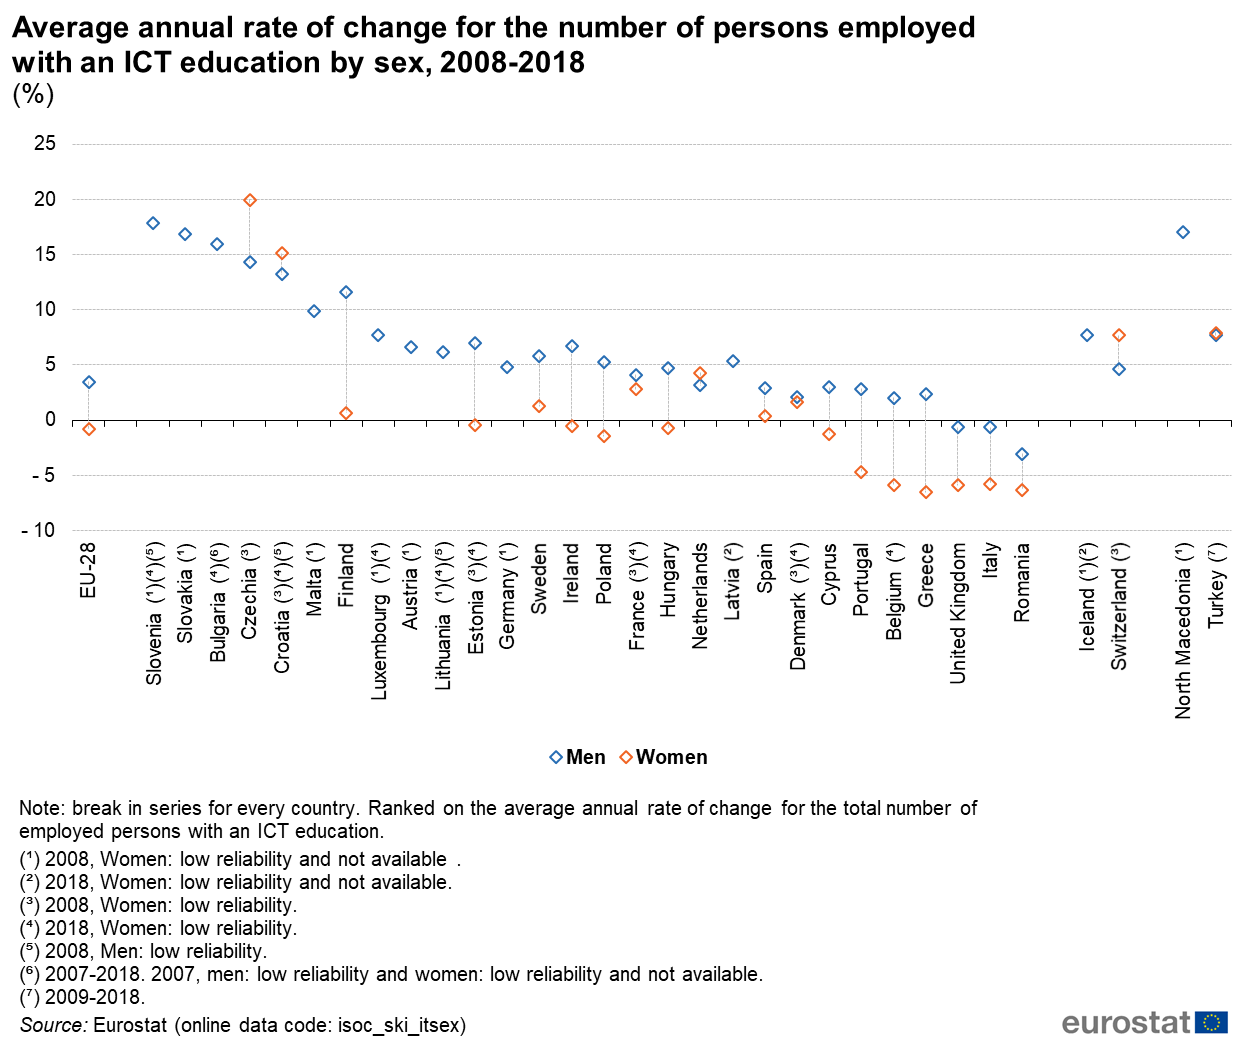
Average annual rate of change for the number of persons employed with an ICT education by sex, 2008-2018 (%)v2.png
(
file
)
181 KB
1
16:26, 9 September 2019
Share of employed persons with an ICT education by age, 2018 (%)v2.png
(
file
)
137 KB
1
16:29, 9 September 2019
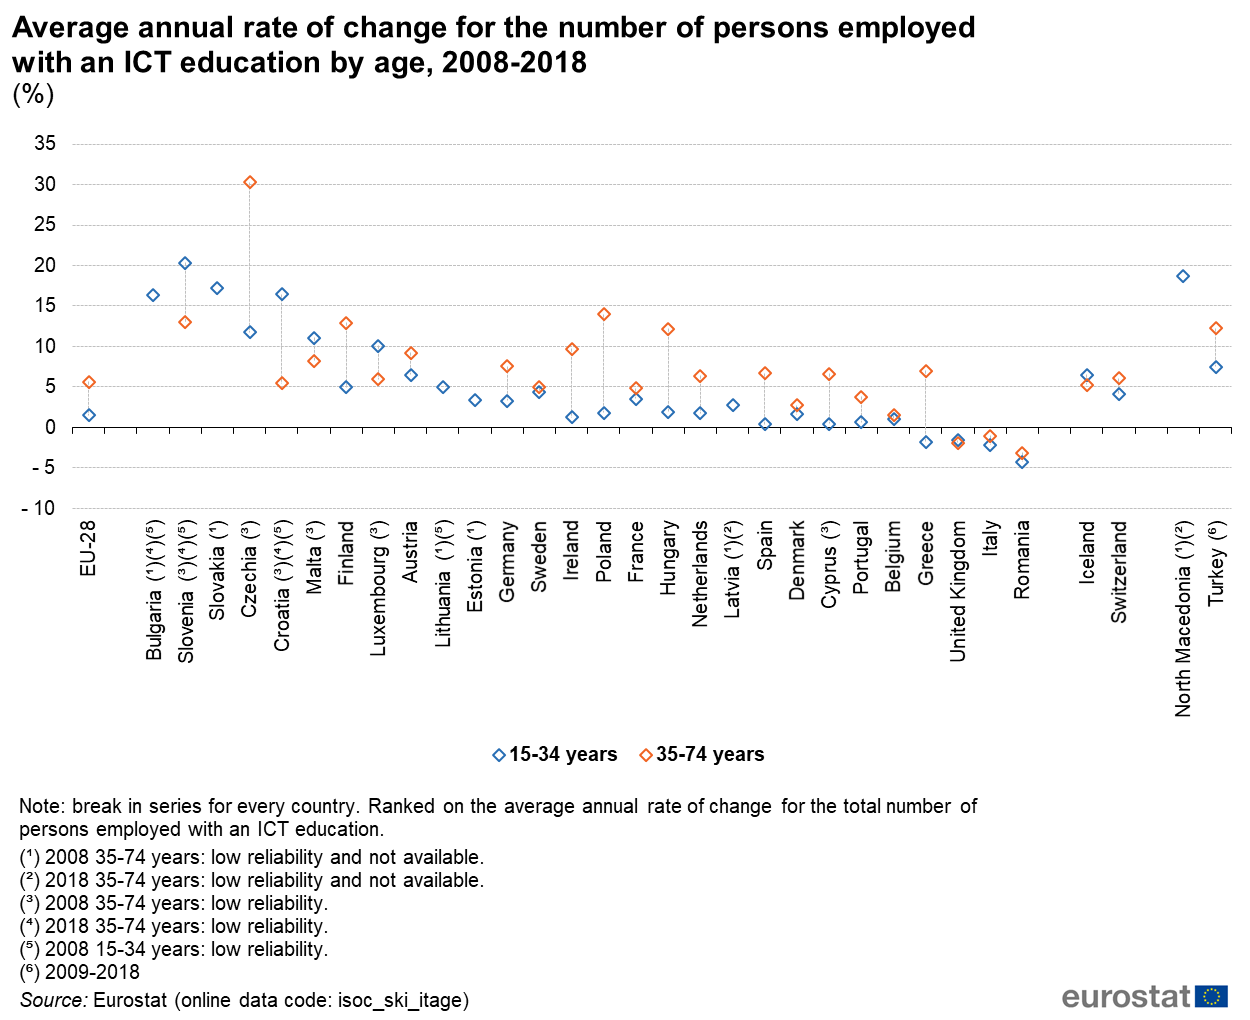
Average annual rate of change for the number of persons employed with an ICT education by age, 2008-2018 (%)v2.png
(
file
)
169 KB
1
16:30, 9 September 2019
Share of employed persons with an ICT education by educational attainment level, 2018 (%)v2.png
(
file
)
159 KB
1
16:30, 9 September 2019
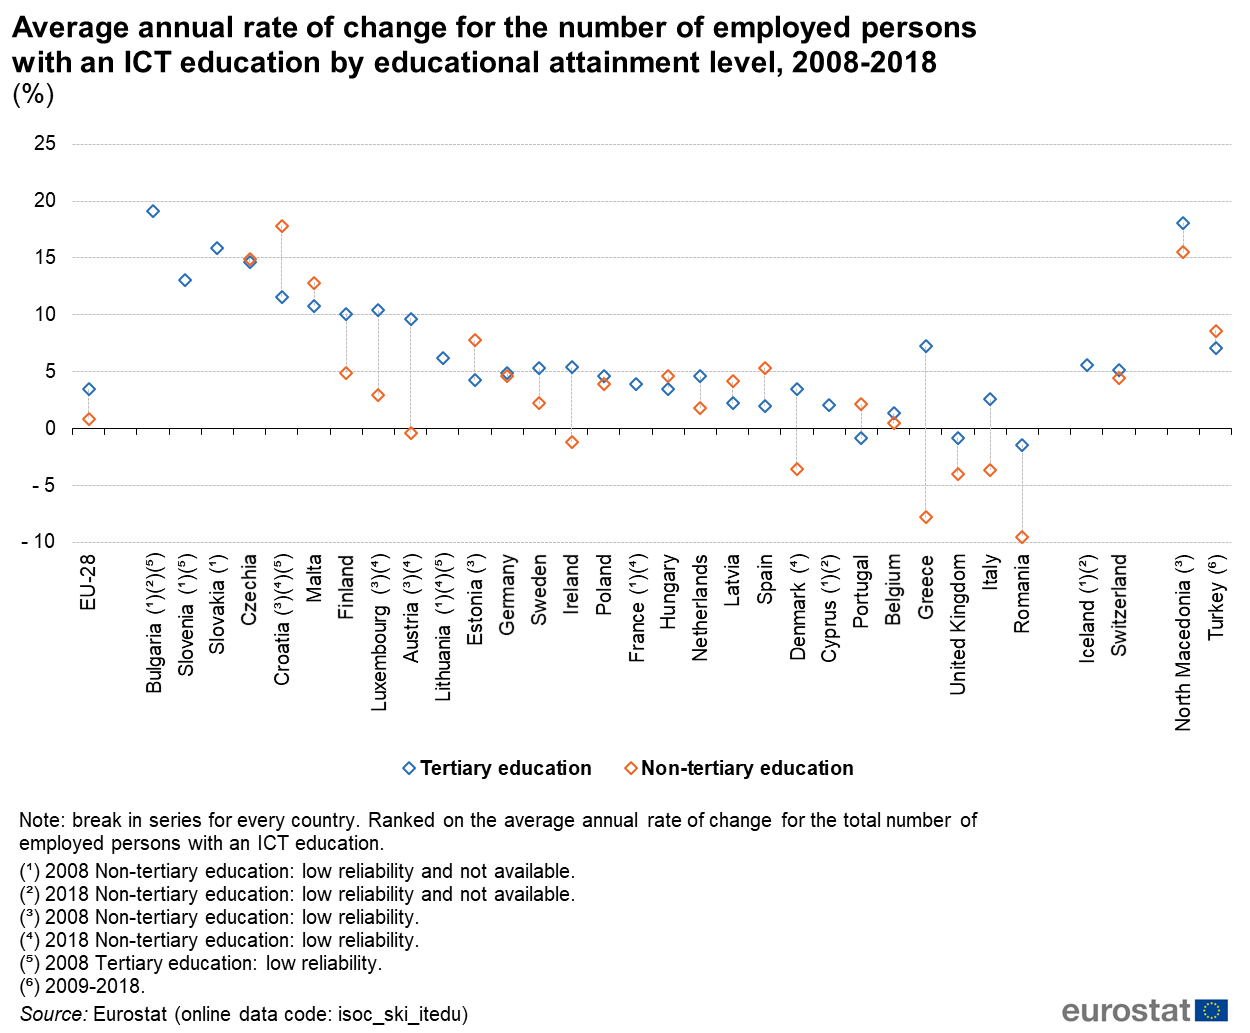
Average annual rate of change for the number of employed persons with an ICT education by educational attainment level, 2008-2018(%).png
(
file
)
182 KB
1
15:06, 24 September 2019
Share of employed persons with an ICT education by sex, educational attainment level and age, 2008 and 2018(%)3.png
(
file
)
664 KB
1
12:37, 9 October 2019
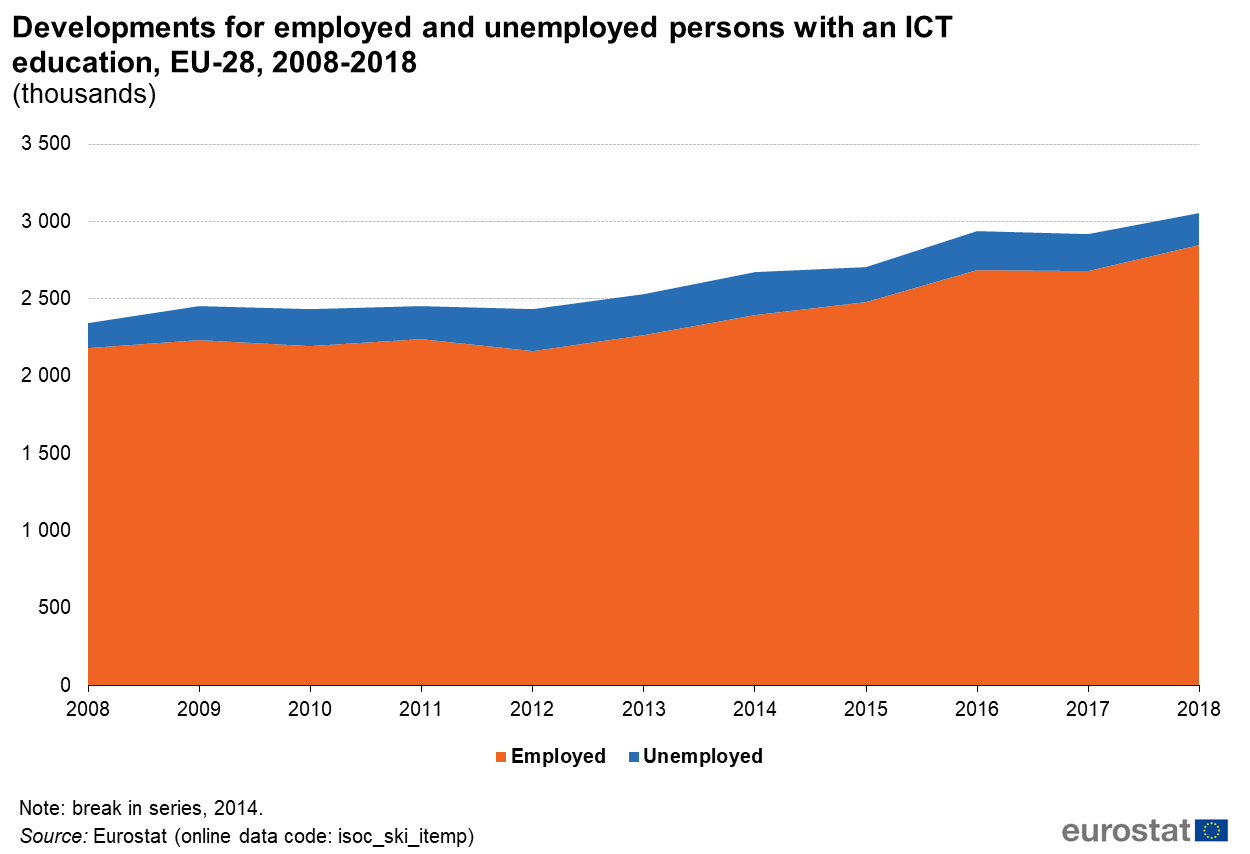
Developments for employed and unemployed persons with an ICT education, EU-28, 2008-2018 (thousands).png
(
file
)
55 KB
2
12:40, 9 October 2019
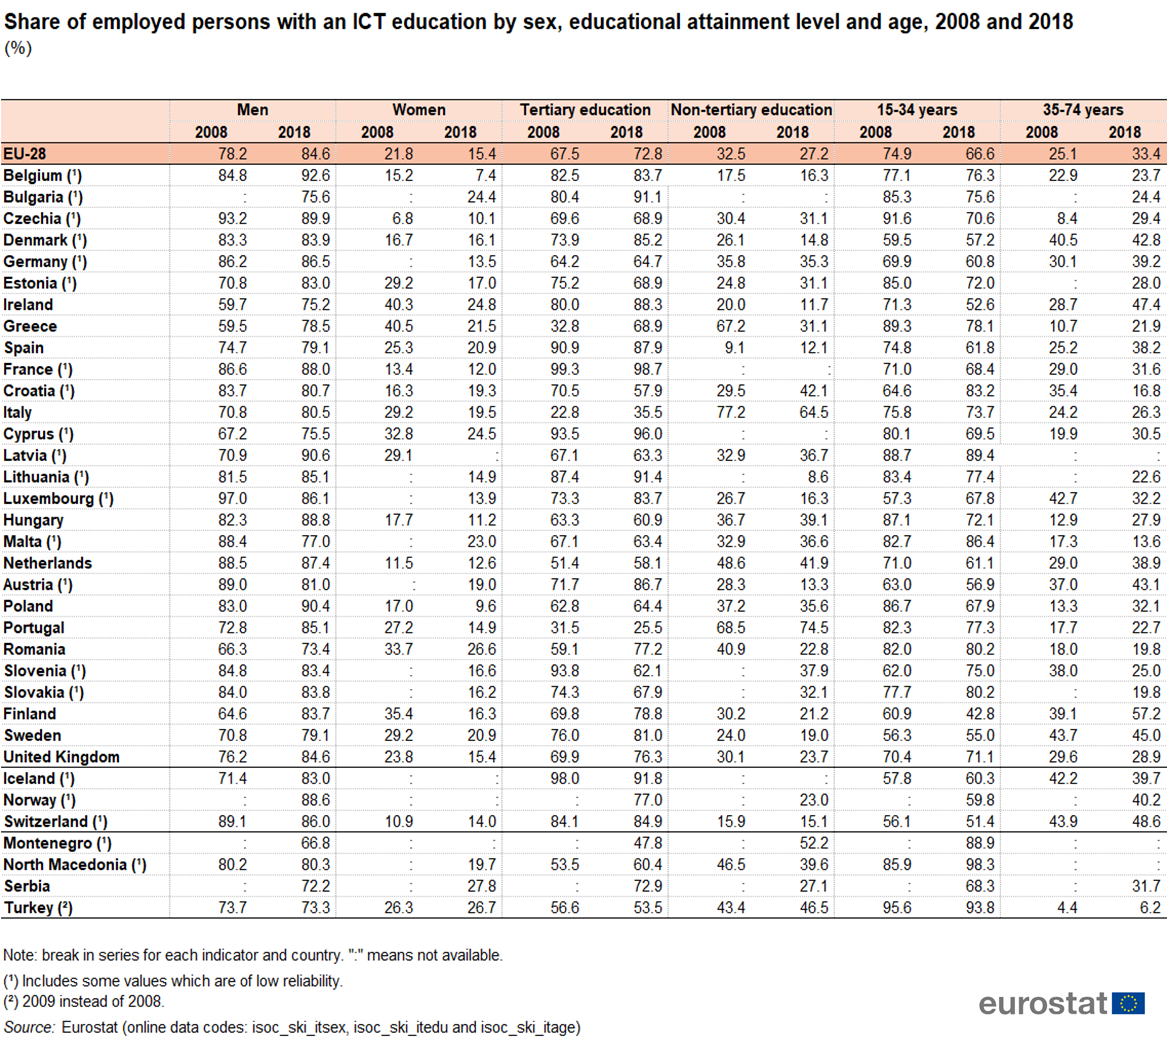
Share of employed persons with an ICT education by sex, educational attainment level and age, 2008 and 2018 (%).png
(
file
)
663 KB
3
12:43, 9 October 2019
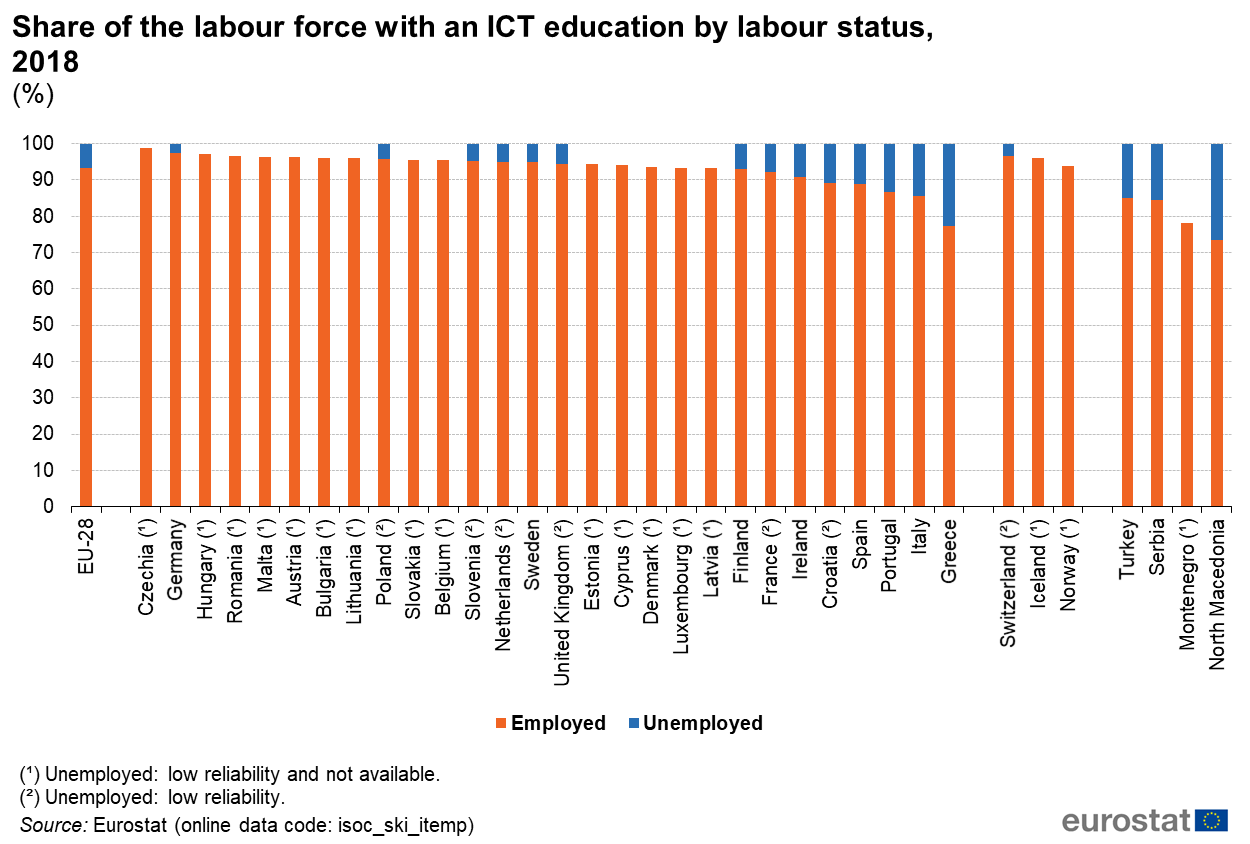
Share of the labour force with an ICT education by labour status, 2018 (%).png
(
file
)
143 KB
5
12:53, 9 October 2019
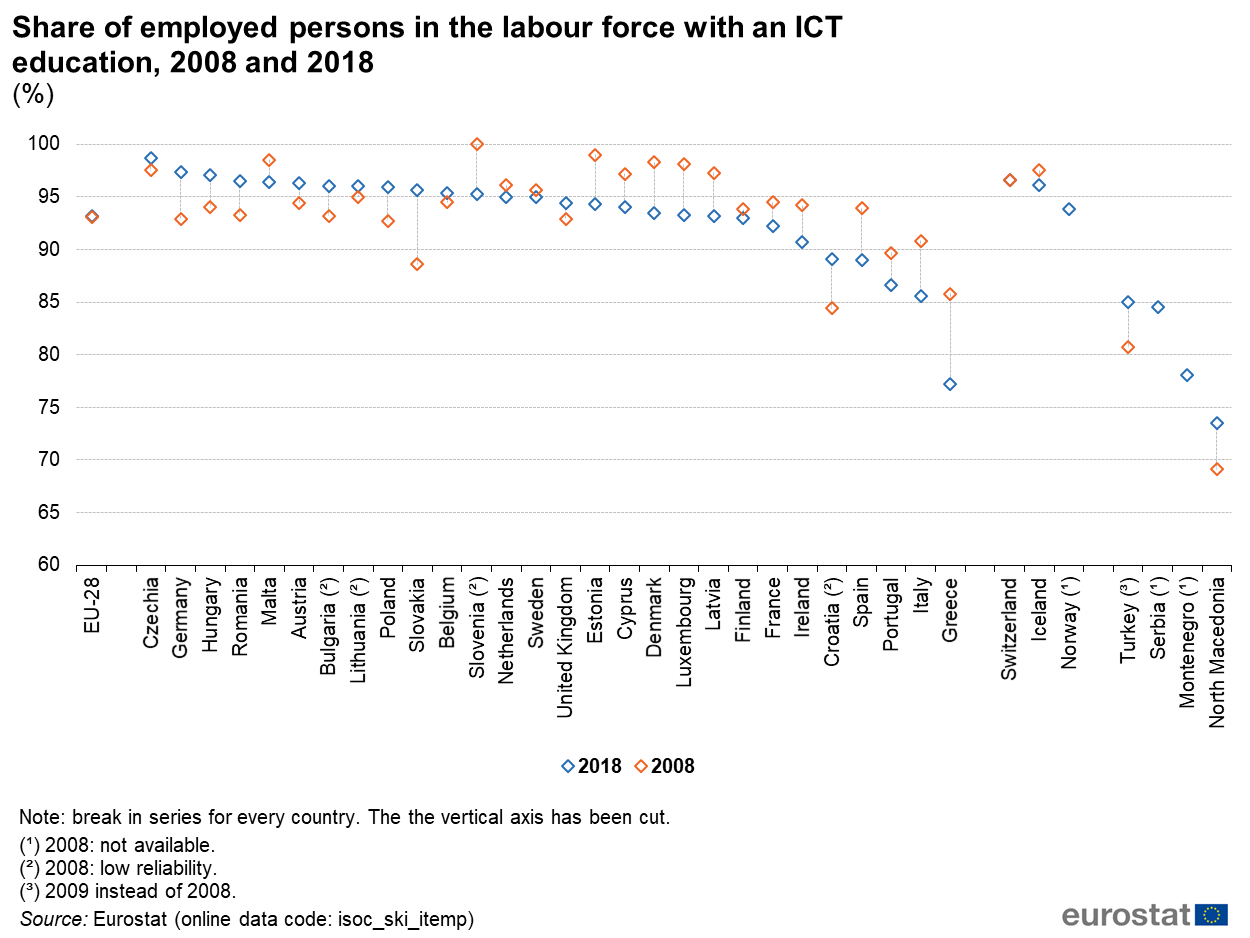
Share of employed persons in the labour force with an ICT education, 2008 and 2018 (%).png
(
file
)
102 KB
4
12:56, 9 October 2019
Share of employed persons with an ICT education by sex, 2018 (%).png
(
file
)
147 KB
3
12:57, 9 October 2019
Average annual rate of change for the number of persons employed with an ICT education by sex, 2008-2018 (%).png
(
file
)
124 KB
3
12:58, 9 October 2019
Share of employed persons with an ICT education by educational attainment level, 2018 (%).png
(
file
)
152 KB
3
13:00, 9 October 2019
Average annual rate of change for the number of employed persons with an ICT education by educational attainment level, 2008-2018 (%).png
(
file
)
128 KB
3
13:01, 9 October 2019
Share of employed persons with an ICT education by age, 2018 (%).png
(
file
)
147 KB
3
13:03, 9 October 2019
Average annual rate of change for the number of persons employed with an ICT education by age, 2008-2018 (%).png
(
file
)
122 KB
3
13:03, 9 October 2019
ICT education ICT2018.xlsx
(
file
)
108 KB
4
13:05, 9 October 2019
ICT education ICT2019.xlsx
(
file
)
108 KB
1
15:00, 10 January 2020
E-sales and turnover from e-sales, EU-28, 2008 to 2018 (% enterprises, % total turnover).png
(
file
)
40 KB
1
15:01, 10 January 2020
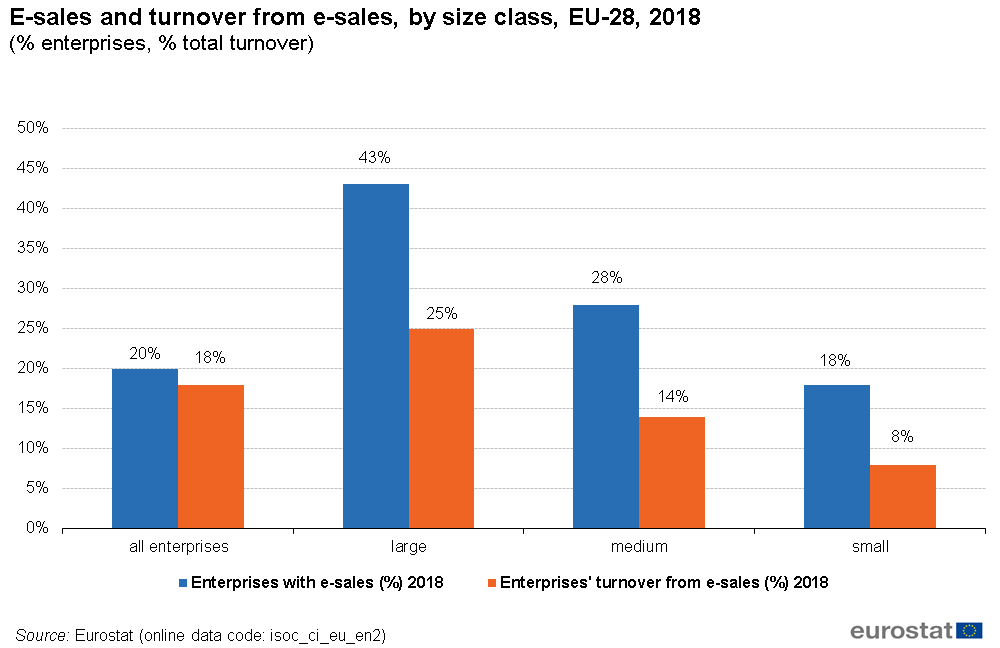
E-sales and turnover from e-sales, by size class, EU-28, 2018 (% enterprises, % total turnover) .png
(
file
)
25 KB
1
15:03, 10 January 2020
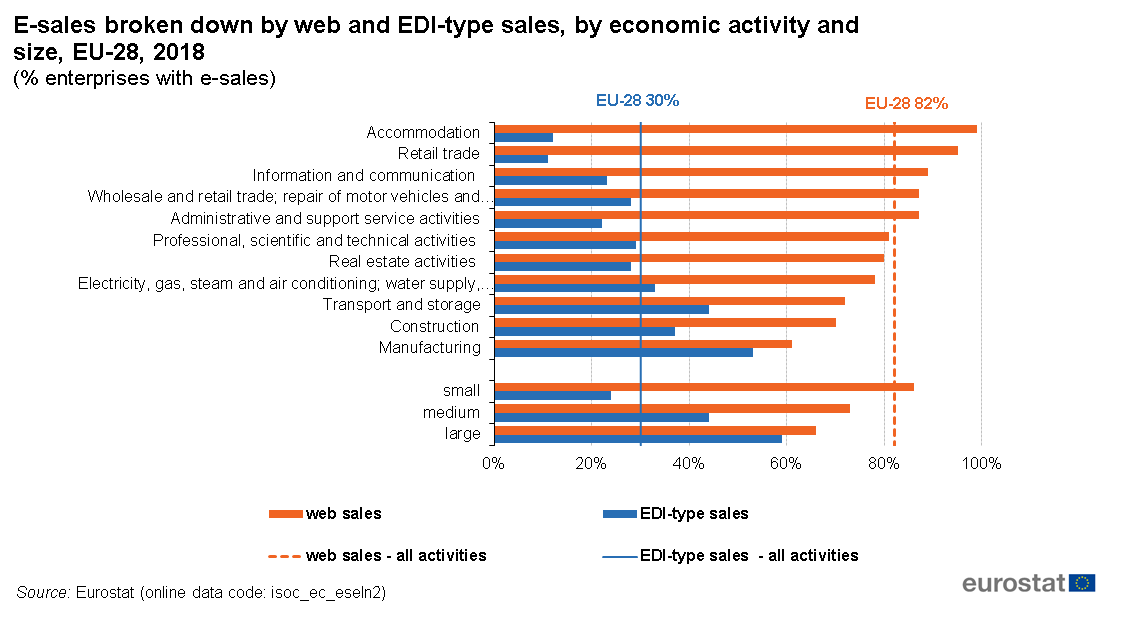
E-sales broken down by web and EDI-type sales, by economic activity and size, EU-28, 2018 (% enterprises with e-sales).png
(
file
)
34 KB
1
15:04, 10 January 2020
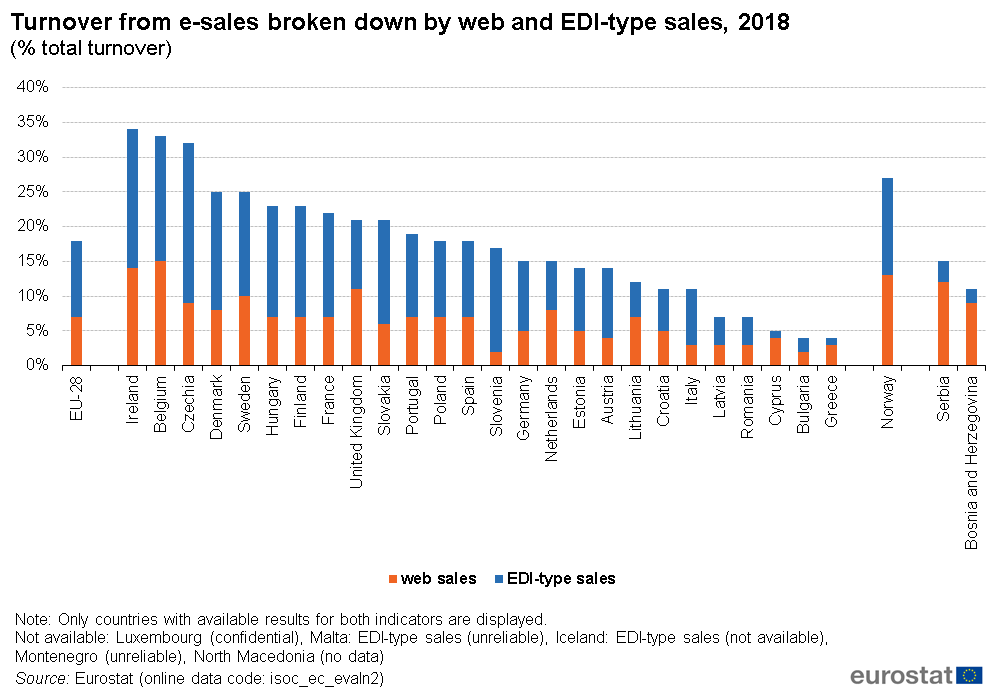
Turnover from e-sales broken down by web and EDI-type sales, 2018 (% total turnover).png
(
file
)
42 KB
1
15:06, 10 January 2020
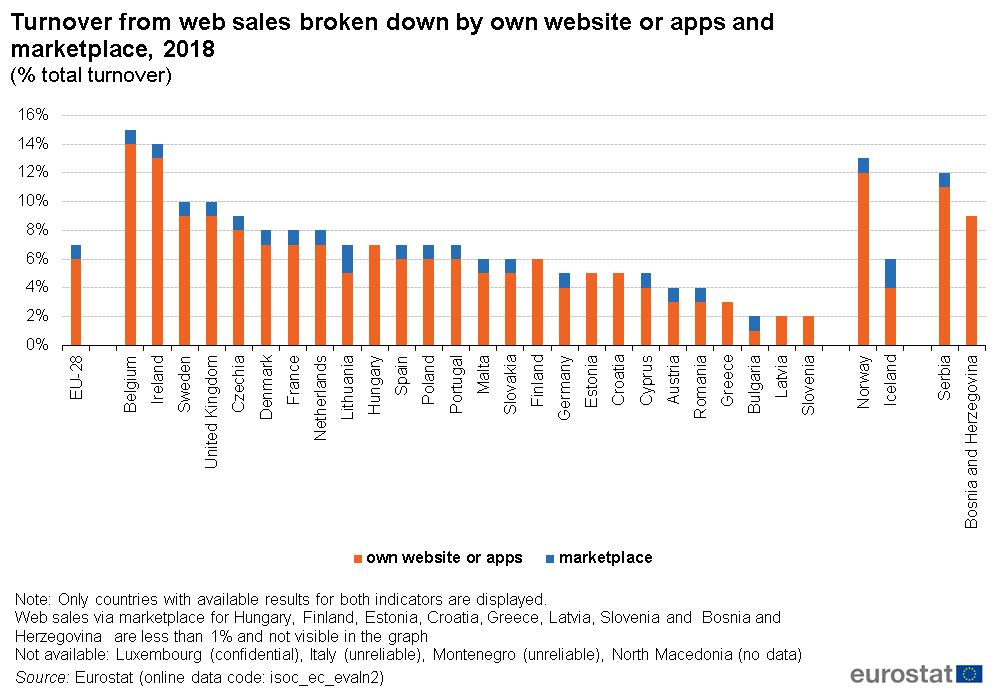
Turnover from web sales broken down by own website or apps and marketplace, 2018 (% total turnover).png
(
file
)
43 KB
1
15:10, 10 January 2020
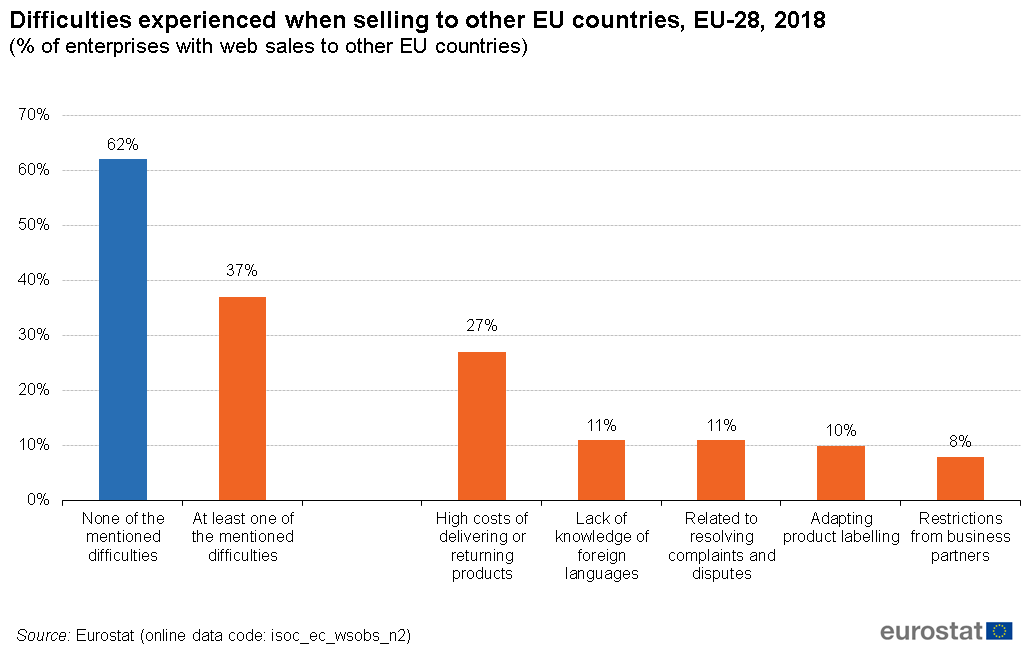
Difficulties experienced when selling to other EU countries, EU-28, 2018 (% of enterprises with web sales to other EU countries).png
(
file
)
27 KB
1
15:13, 10 January 2020
E-sales broken down by web sales and EDI-type sales, 2018 (% enterprises).png
(
file
)
50 KB
2
16:13, 10 January 2020
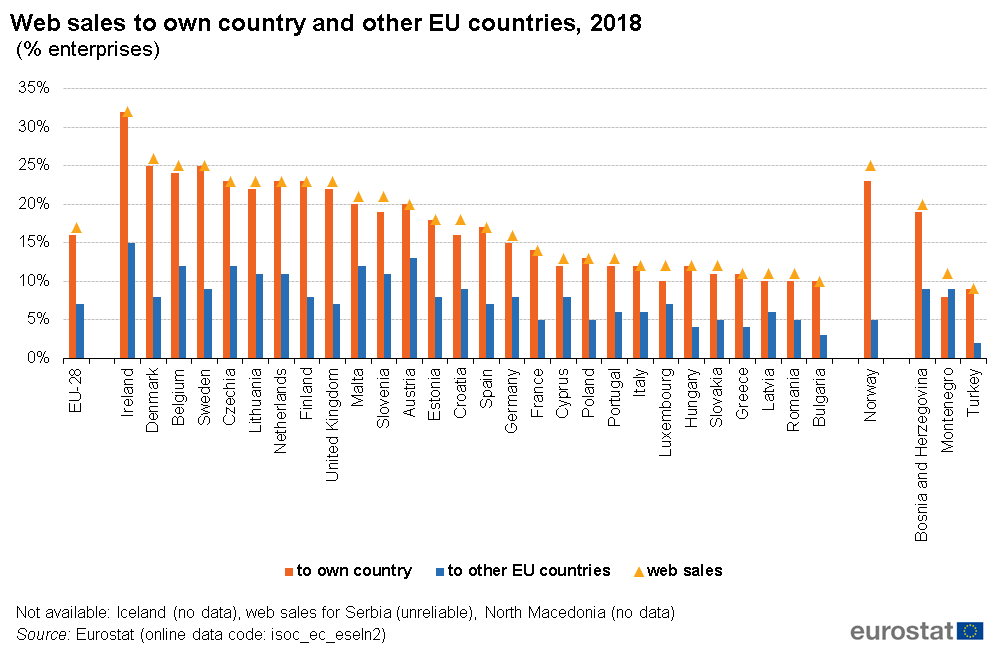
Web sales to own country and other EU countries, 2018 (% enterprises).png
(
file
)
47 KB
3
16:47, 10 January 2020
E-commerce statistics 2019 graphs and tables.xlsx
(
file
)
126 KB
1
12:50, 16 January 2020
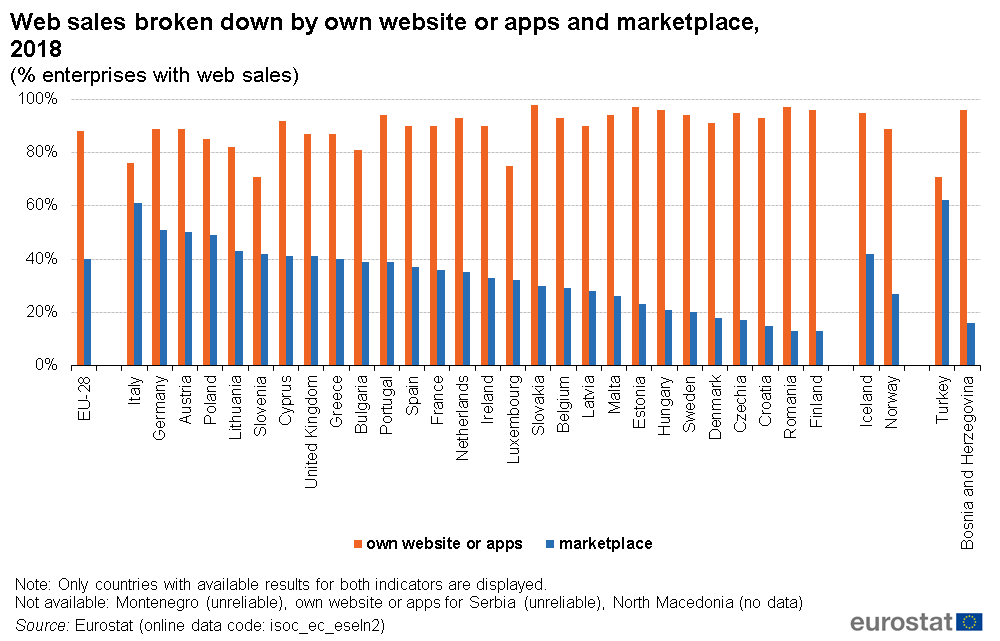
Web sales broken down by own website or apps and marketplace, 2018 (% enterprises with web sales) .png
(
file
)
58 KB
2
14:33, 20 January 2020
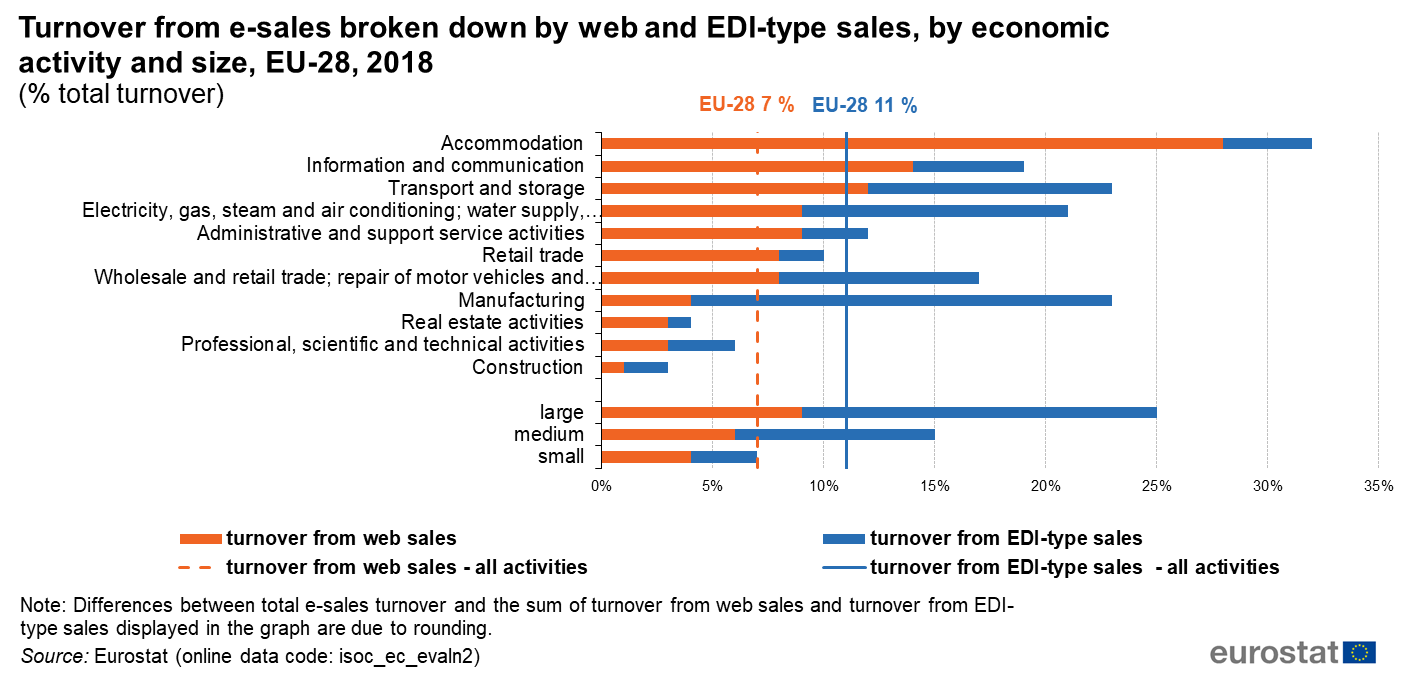
Turnover from e-sales broken down by web and EDI-type sales, by economic activity and size, EU-28, 2018 (% total turnover).png
(
file
)
90 KB
2
15:06, 21 January 2020
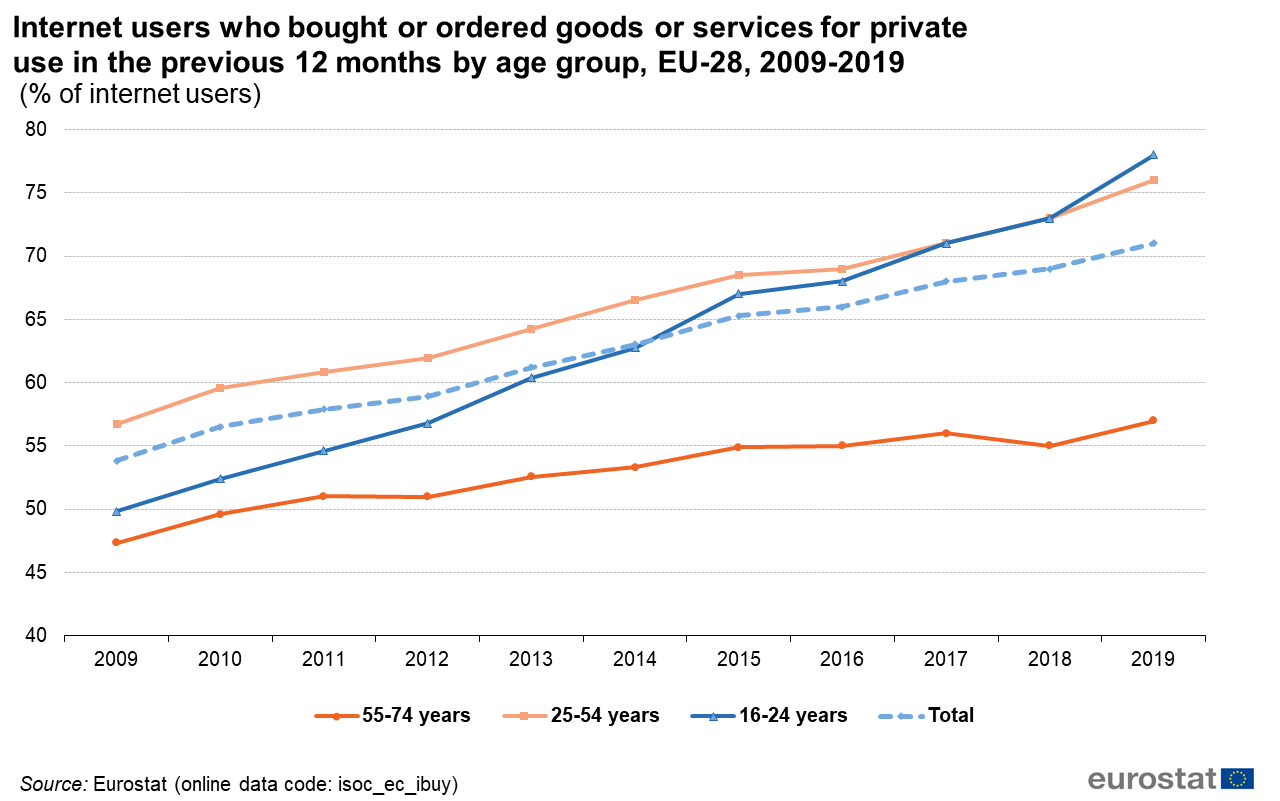
Internet users who bought or ordered goods or services for private use in the previous 12 months by age group, EU-28, 2009-2019 (% of internet users).png
(
file
)
78 KB
1
15:18, 21 January 2020
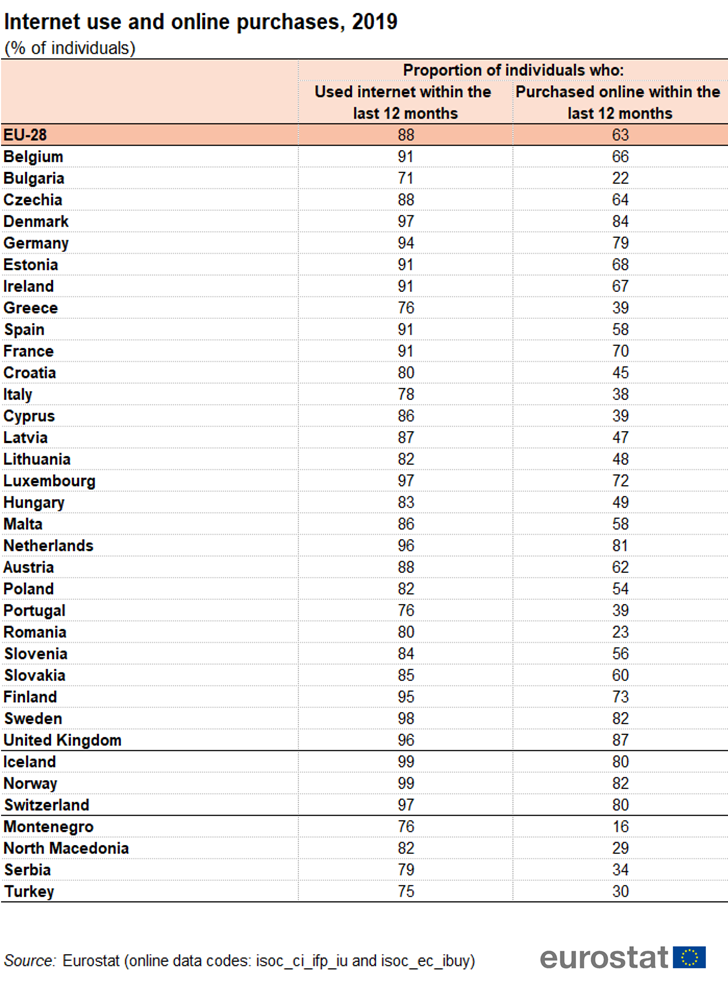
Internet use and online purchases, 2019 (% of individuals).png
(
file
)
243 KB
1
15:19, 21 January 2020
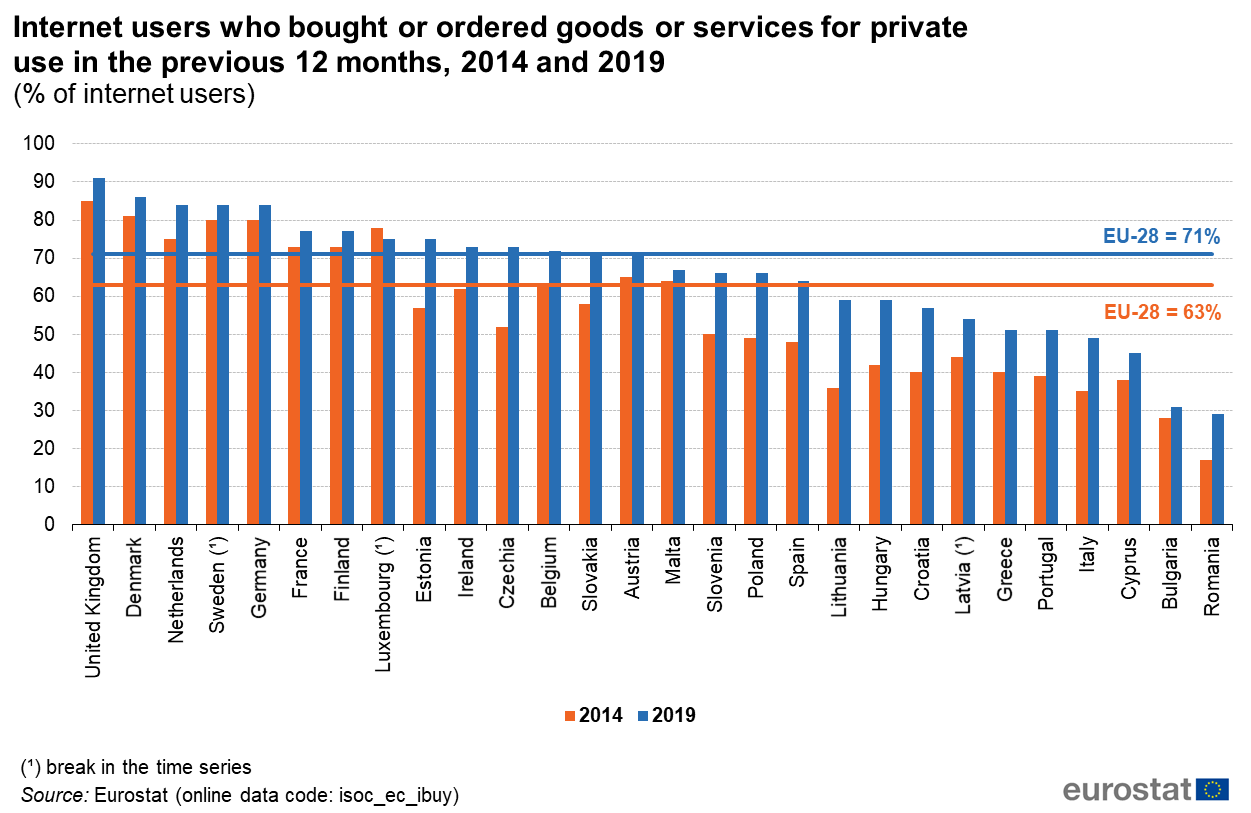
Internet users who bought or ordered goods or services for private use in the previous 12 months, 2014 and 2019 (% of internet users).png
(
file
)
129 KB
1
15:20, 21 January 2020
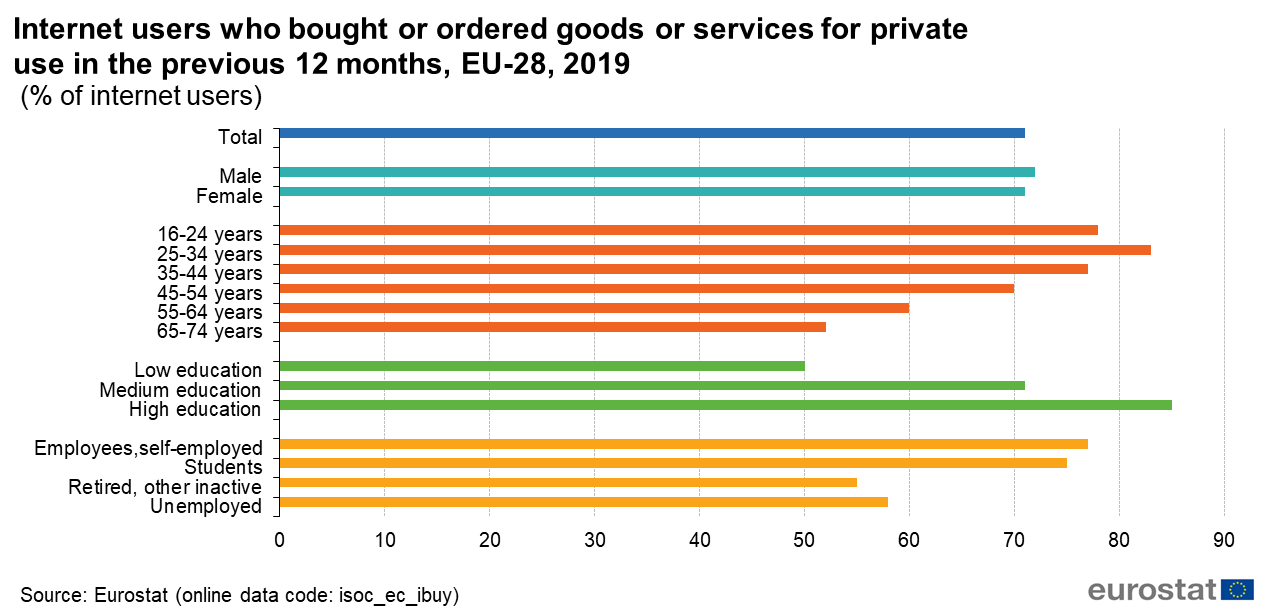
Internet users who bought or ordered goods or services for private use in the previous 12 months, EU-28, 2019 (% of internet users).png
(
file
)
61 KB
1
15:24, 21 January 2020
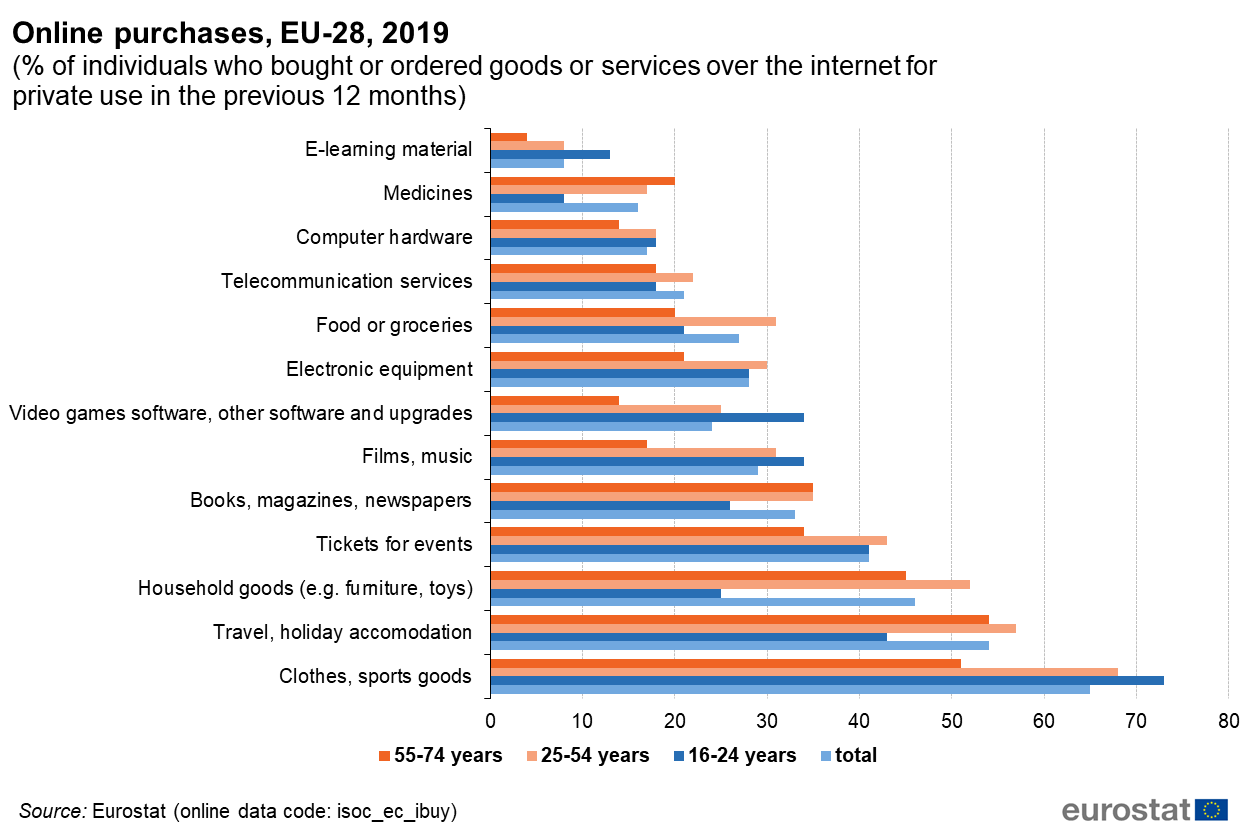
Online purchases, EU-28, 2019.png
(
file
)
76 KB
1
15:26, 21 January 2020
Number of times people shopped online, EU-28, 2019.png
(
file
)
53 KB
1
15:28, 21 January 2020
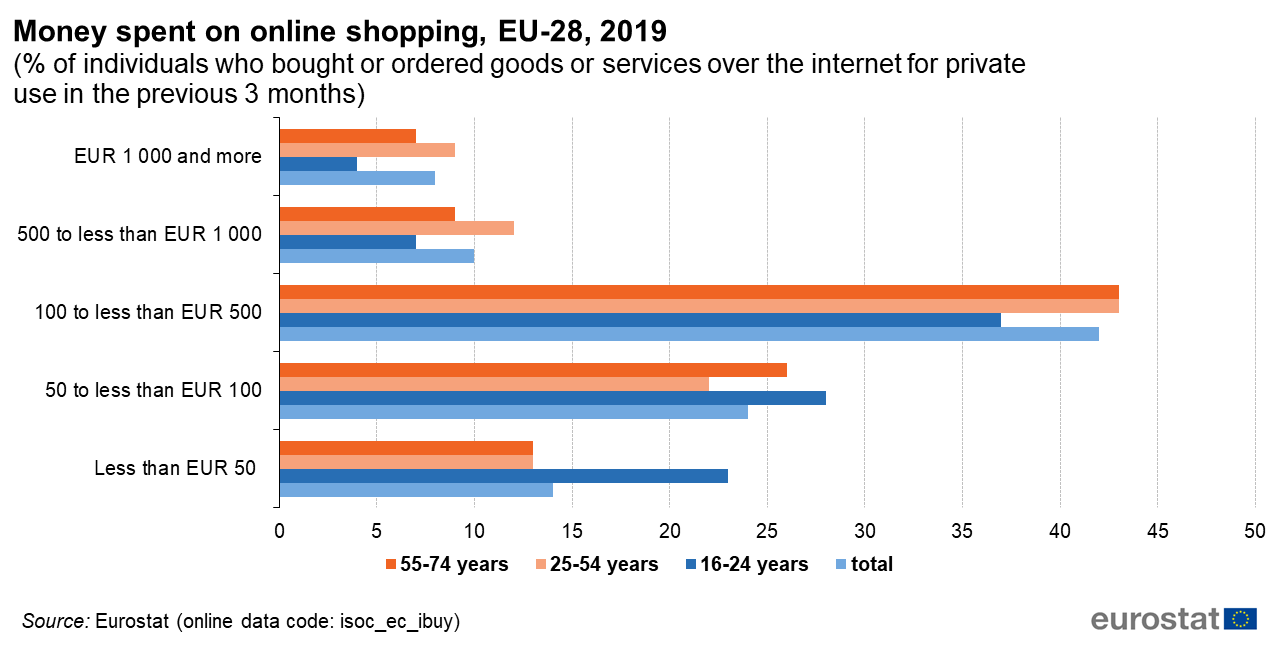
Money spent on online shopping, EU-28, 2019.png
(
file
)
59 KB
1
15:30, 21 January 2020
Problems encountered when buying over the internet, EU-28, 2019.png
(
file
)
71 KB
1
15:32, 21 January 2020
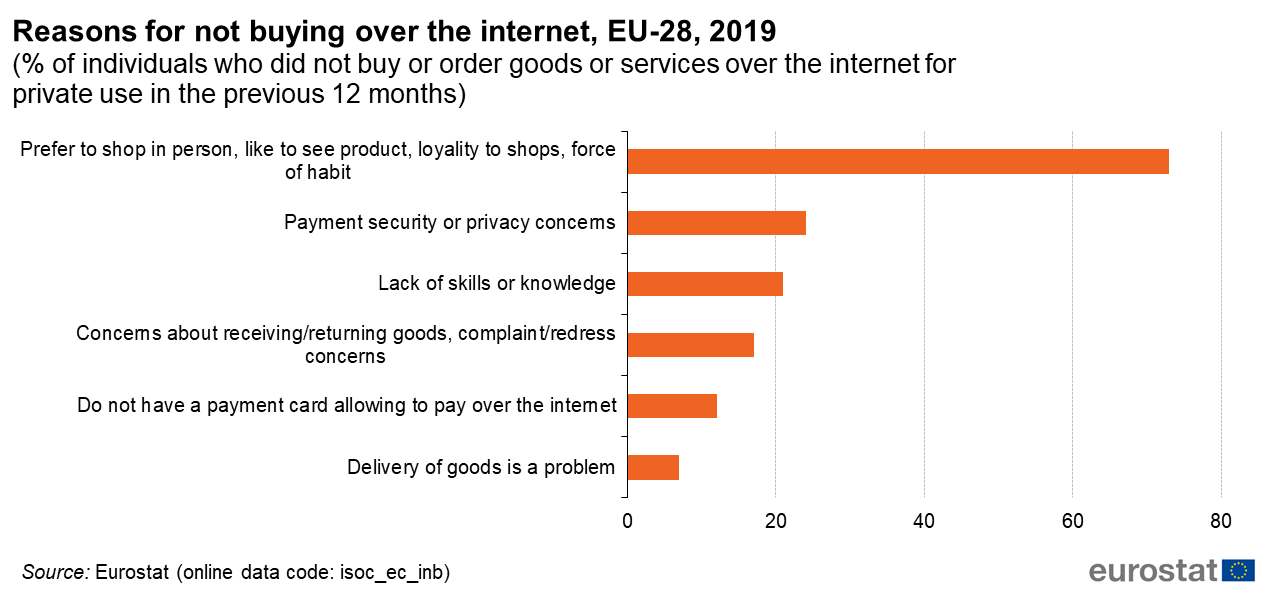
Reasons for not buying over the internet, EU-28, 2019.png
(
file
)
62 KB
1
15:35, 21 January 2020
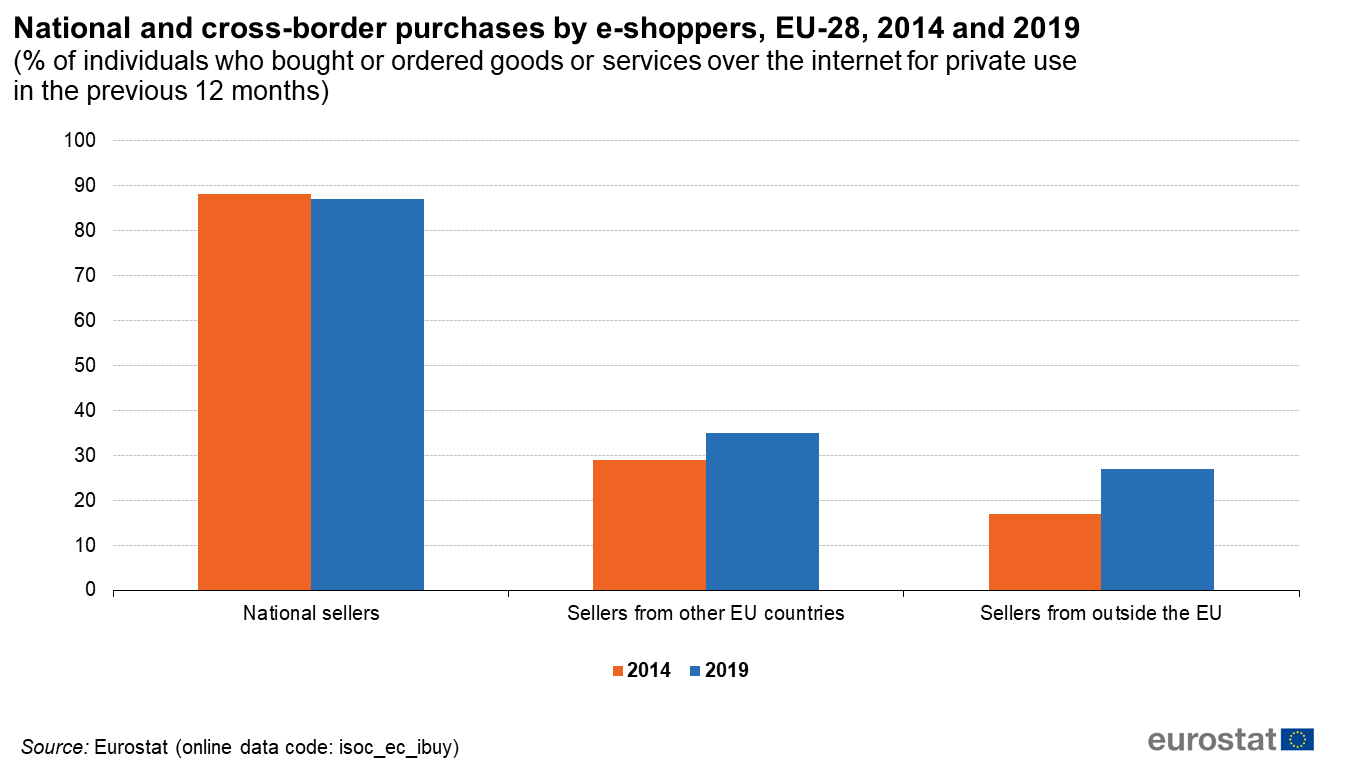
National and cross-border purchases by e-shoppers, EU-28, 2014 and 2019.png
(
file
)
60 KB
1
15:36, 21 January 2020
Online purchases from abroad, EU-28, 2017.png
(
file
)
66 KB
1
15:54, 21 January 2020
E-commerce statistics for individuals 2019 final.xlsx
(
file
)
102 KB
1
17:12, 28 January 2020
Enterprises using social networks, 2013 and 2019 (% of enterprises).png
(
file
)
124 KB
1
17:13, 28 January 2020
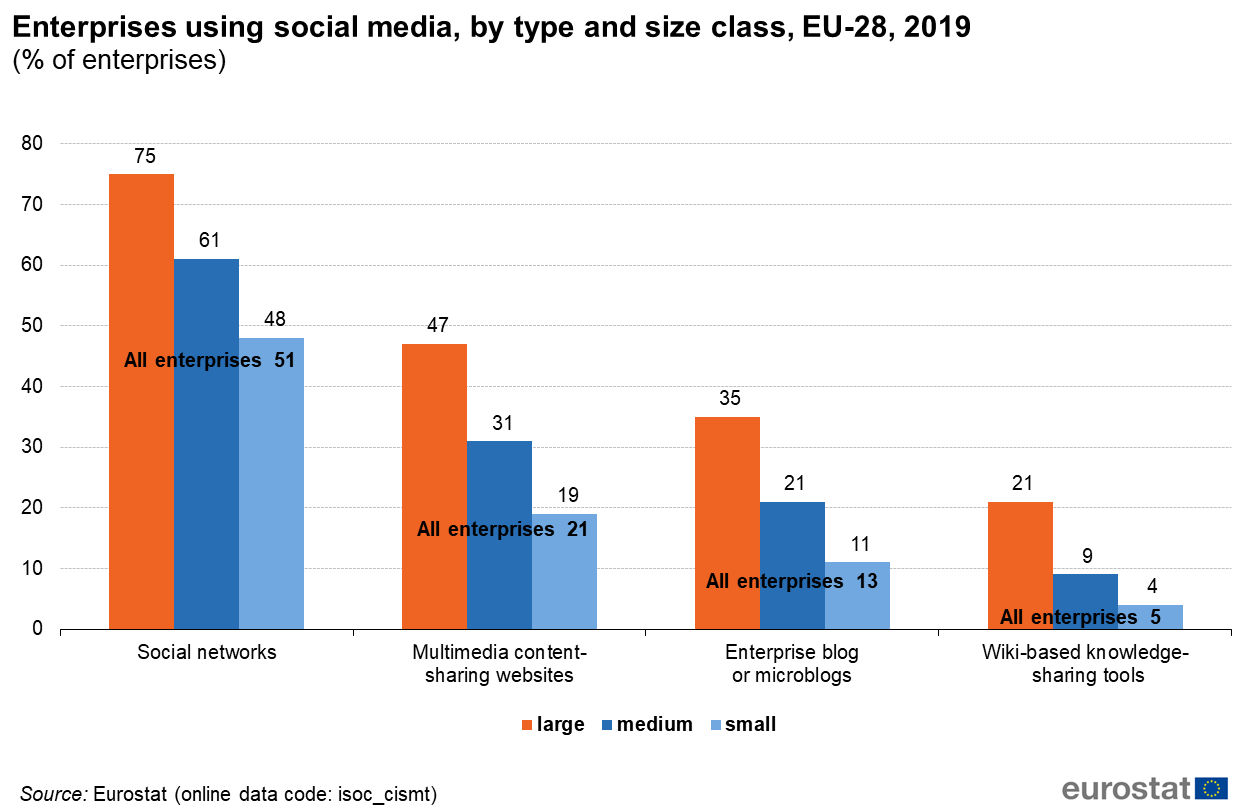
Enterprises using social media, by type and size class, EU-28, 2019 (% of enterprises).png
(
file
)
72 KB
1
17:14, 28 January 2020
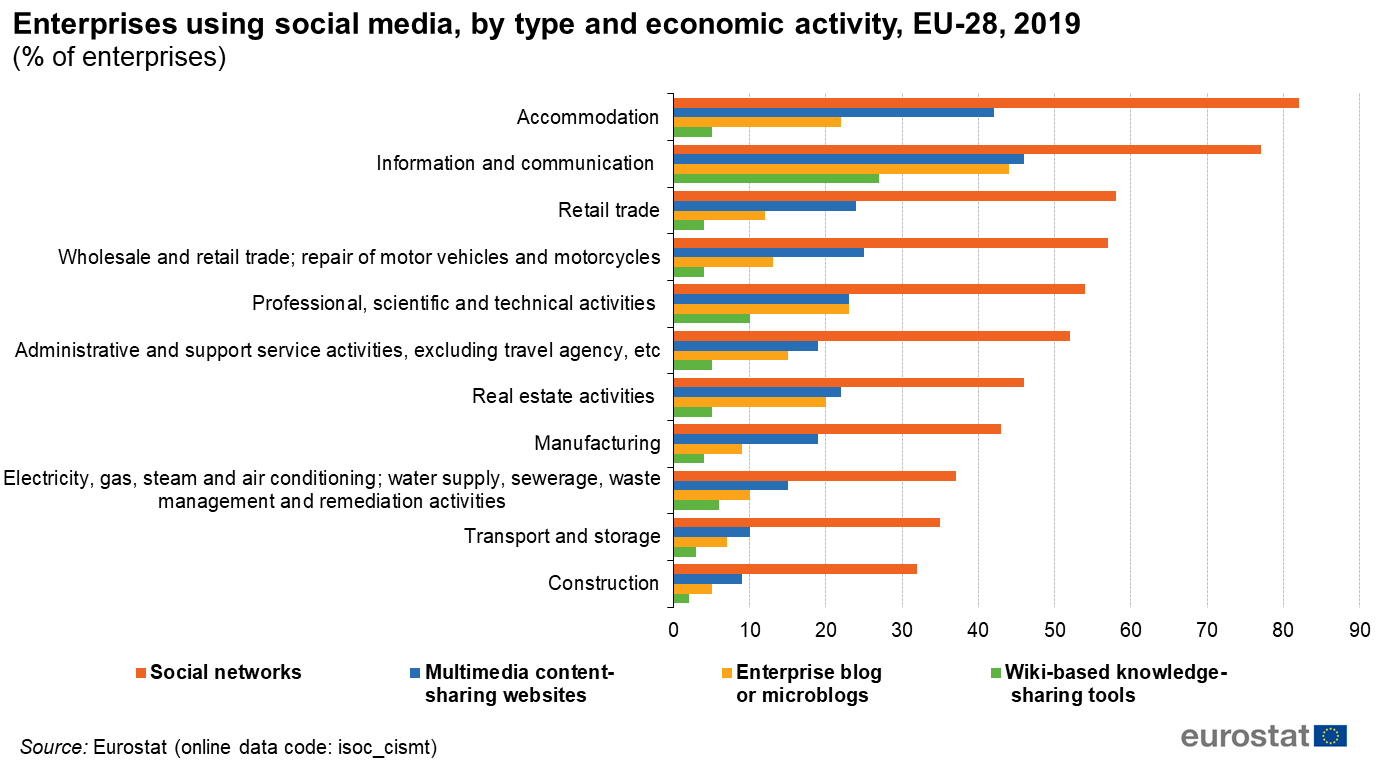
Enterprises using social media, by type and economic activity, EU-28, 2019 (% of enterprises).png
(
file
)
83 KB
1
First page
Previous page
Next page
Last page
Special page
ISSN 2443-8219
v2.png)
v2.png)
v2.png)
v2.png)
v2.png)
v2.png)
v2.png)
v2.png)
.png)
3.png)
.png)
.png)
.png)
.png)
.png)
.png)
.png)
.png)
.png)
.png)
.png)
_.png)
.png)
.png)
.png)
.png)
.png)
.png)
_.png)
.png)
.png)
.png)
.png)
.png)


.png)
.png)
.png)