Tutorials
Log in
Statistics Explained
menu
search
search
Navigation
Main page
Statistical themes
Glossary
Categories
Statistics 4 beginners
Tutorials
Help
Eurostat home
Education corner
Online publications
Regional yearbook
Sustainable development
Full list
Tools
User contributions
Logs
View user groups
Special pages
search
Navigation
Main page
Statistical themes
Glossary
Categories
Statistics 4 beginners
Tutorials
Help
Eurostat home
Education corner
Online publications
Regional yearbook
Sustainable development
Full list
Tools
User contributions
Logs
View user groups
Special pages
Navigation
Main page
Statistical themes
Glossary
Categories
Statistics 4 beginners
Tutorials
Help
Eurostat home
Education corner
Online publications
Regional yearbook
Sustainable development
Full list
Tools
User contributions
Logs
View user groups
Special pages
Uploads by Bassama
This special page shows all uploaded files.
File list
Items per page:
20
50
100
250
500
Search for media name:
Username:
Include old versions of files
Go
First page
Previous page
Next page
Last page
Date
Name
Thumbnail
Size
Description
Versions
11:17, 28 November 2012
EU-27 Evolution of electricity supplied, 2002-2011 (inGWh).png.xls
(
file
)
287 KB
1
12:04, 28 November 2012
Electricity generation by source, 2011 (in%).png.xls
(
file
)
287 KB
2
12:44, 28 November 2012
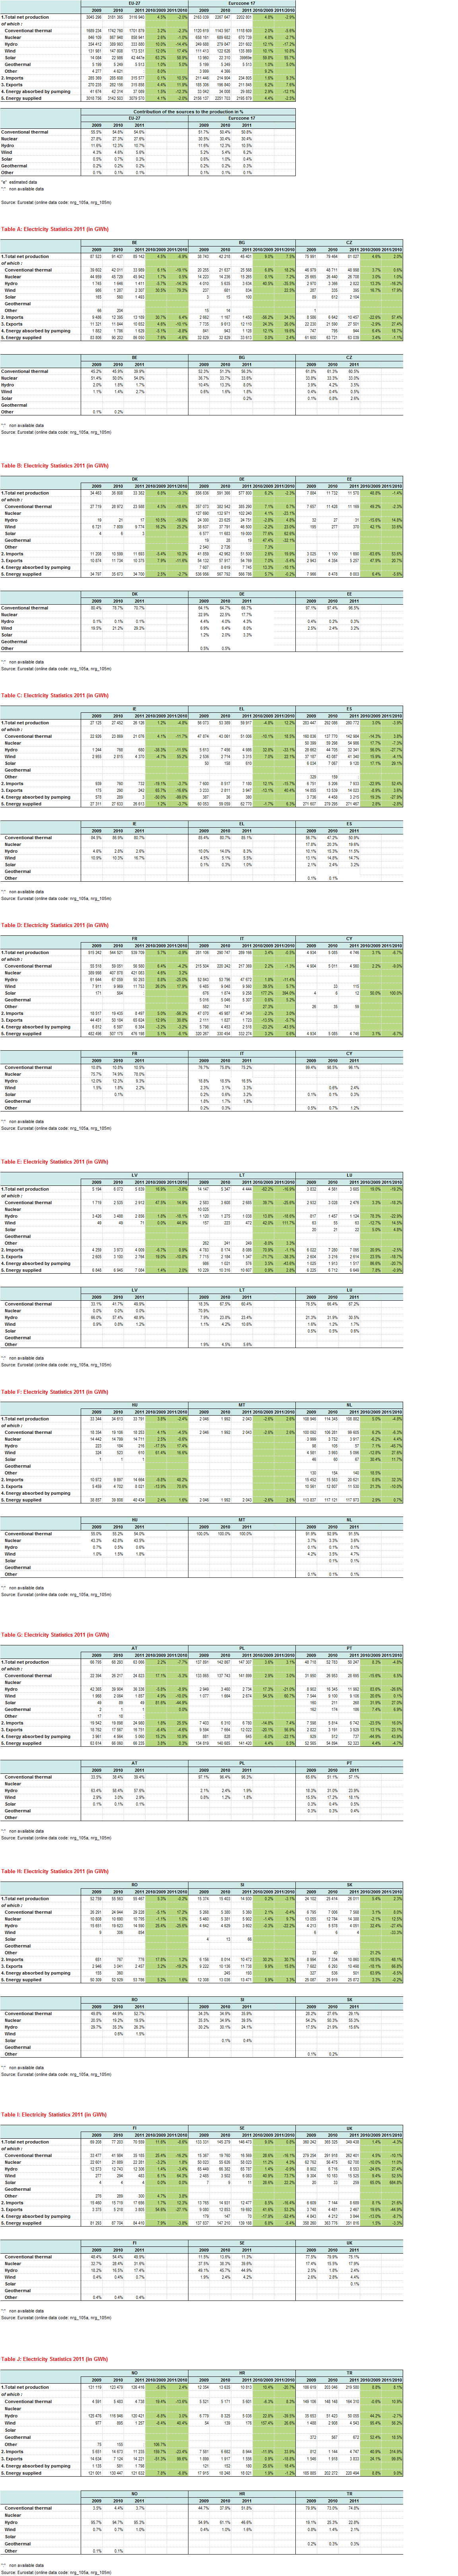
Electricity statistics, 2011.png.xls
(
file
)
287 KB
2
12:46, 28 November 2012
Electricity Statistics, 2011.png
(
file
)
540 KB
2
14:52, 28 November 2012
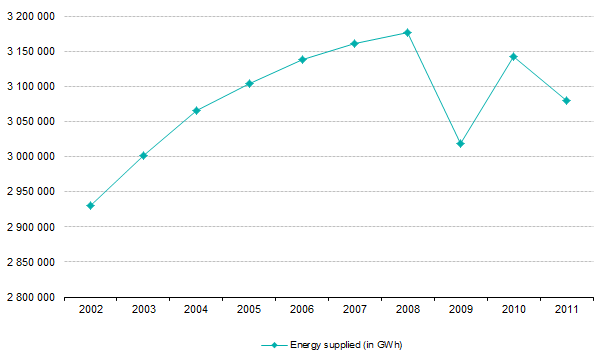
EU-27 Evolution of electricity supplied, 2002-2011 (in GWh).png
(
file
)
7 KB
2
14:53, 28 November 2012
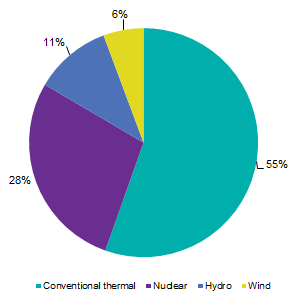
EU-27 Electricity generation by source, 2011 (in %).png
(
file
)
6 KB
2
14:56, 28 November 2012
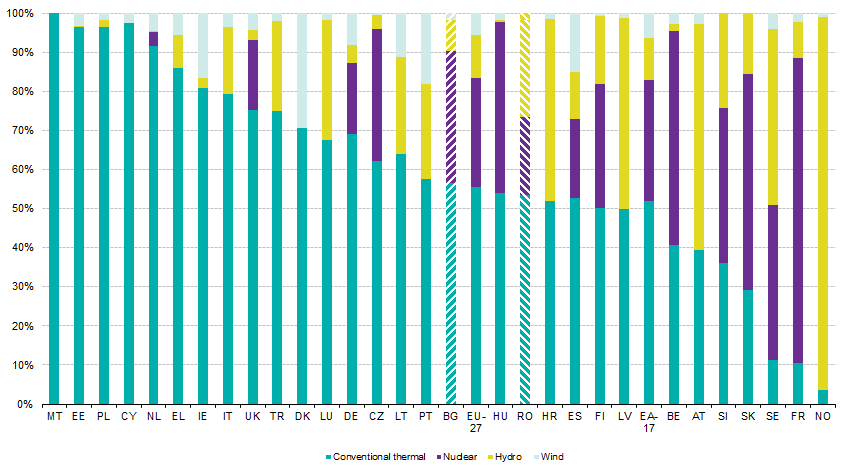
Breakdown of electricity generation by source, 2011 (in %).png
(
file
)
13 KB
2
13:53, 24 April 2013
EU-27 Evolution of electricity supplied, 2002-2012 (in GWh).png
(
file
)
8 KB
1
13:53, 24 April 2013
EU-27 Electricity generation by source, 2012 (in %).png
(
file
)
6 KB
1
13:53, 24 April 2013
Electricity Statistics, 2012 (in GWh).png
(
file
)
25 KB
1
13:54, 24 April 2013
Breakdown of electricity generation by source, 2012 (in %).png
(
file
)
12 KB
1
13:54, 24 April 2013
Share of renewables in electricity generation, 2012 (in %).png
(
file
)
10 KB
1
13:54, 24 April 2013
Electricity Statistics 2012.xls
(
file
)
202 KB
1
08:29, 29 April 2013
Share of renewables in electricity production, 2012 (in %).png
(
file
)
10 KB
1
08:36, 29 April 2013
Electricity Statistics 2012 (in GWh).png
(
file
)
25 KB
4
08:41, 29 April 2013
Breakdown of electricity production by source, 2012 (in %).png
(
file
)
12 KB
3
09:24, 29 April 2013
EU 27 Electricity production by source, 2012 (in%).png
(
file
)
6 KB
4
15:32, 30 April 2014
EU-28 Evolution of electricity supplied, 2004-2013 (inGWh).png
(
file
)
8 KB
1
10:55, 5 May 2014
EU 28 Electricity production by source, 2013 (in%).png
(
file
)
6 KB
1
10:55, 5 May 2014
Breakdown of electricity production by source, 2013 (in %).png
(
file
)
12 KB
1
10:56, 5 May 2014
Share of renewables in electricity production, 2013 (in %).png
(
file
)
10 KB
1
14:57, 5 May 2014
EU-28 Electricity production by source, 2013 (in%).png
(
file
)
6 KB
1
10:11, 8 May 2014
Breakdown of electricity production by source, 2013 (in%).png
(
file
)
36 KB
1
10:12, 8 May 2014
Share of renewables in electricity production, 2013 (in%).png
(
file
)
30 KB
1
10:36, 8 May 2014
EU-28 Evolution of electricity supplied, 2004-2013 (in GWh).PNG
(
file
)
13 KB
1
10:37, 8 May 2014
Electricity Statistics 2013 (in GWh).PNG
(
file
)
44 KB
1
11:36, 8 May 2014
Electricity Statistics 2013 (in GWh).png
(
file
)
25 KB
10
11:41, 21 May 2014
EU-28 Evolution of electricity supplied (in GWh), 2000-2013 annual data; 2008-2013 monthly cumulated data.PNG
(
file
)
8 KB
3
11:57, 21 May 2014
Electricity Statistics 2013 (2).xls
(
file
)
206 KB
1
12:08, 21 May 2014
EU-27 Evolution of electricity supplied, 2003-2012 (in GWh).png
(
file
)
8 KB
5
12:11, 21 May 2014
EU-28 Evolution of electricity supplied, 2004-2013 (in GWh).png
(
file
)
8 KB
11
14:32, 21 May 2014
Electricity Statistics 2013.xls
(
file
)
206 KB
11
14:35, 21 May 2014
Electricity Statistics 2013r.xls
(
file
)
206 KB
1
14:39, 21 May 2014
EU-28 Evolution of electricity supplied (in GWh), 2000-2013 annual data; 2008-2013 monthly data.png
(
file
)
8 KB
1
15:29, 5 May 2015
EU-28 Evolution of electricity supplied (in GWh), 2000-2014 annual data; 2008-2014 monthly data.png
(
file
)
11 KB
1
15:33, 5 May 2015
EU-28 Electricity production by source, 2014 (in%).png
(
file
)
8 KB
1
15:36, 5 May 2015
Electricity Statistics 2014 (in GWh).png
(
file
)
41 KB
1
15:38, 5 May 2015
Breakdown of electricity production by source, 2014 (in%).png
(
file
)
46 KB
1
15:40, 5 May 2015
Share of renewables in electricity production, 2014 (in %).png
(
file
)
44 KB
1
08:49, 19 May 2015
EU-28 Electricity production by source, 2014 (in %).PNG
(
file
)
9 KB
1
08:50, 19 May 2015
Electricity Statistics 2012-2014 (in GWh).PNG
(
file
)
41 KB
1
08:51, 19 May 2015
Electricity Statistics 2012-2014 (in GWh).png
(
file
)
41 KB
1
08:52, 19 May 2015
Breakdown of electricty production by source, 2014 (in %).PNG
(
file
)
48 KB
1
08:53, 19 May 2015
Share of renewables in electricity production, 2014 (in %).PNG
(
file
)
44 KB
1
09:02, 19 May 2015
EU-28 Evolution of electricity supplied (in GWh), 2000-2014 annual data; 2008-2014 monthly data (in GWh).PNG
(
file
)
12 KB
3
10:55, 19 May 2015
!working doc - tables Electricity Statistics 2014r.xls
(
file
)
232 KB
10
10:34, 20 May 2015
!working doc-tables Electricity Statistics 2014r.xls
(
file
)
232 KB
3
10:40, 20 May 2015
Electricity Statistics 2014r.xls
(
file
)
229 KB
2
09:54, 9 July 2015
Primary production of Crude oil, 1990-2013, in thousand toe.png
(
file
)
41 KB
1
10:38, 9 July 2015
Extra-EU imports of Crude oil and Refinery feedstocks, 2000-2005-2013, in thousand tonnes.png
(
file
)
27 KB
1
First page
Previous page
Next page
Last page
Special page
ISSN 2443-8219
.png.xls)
.png.xls)


.png)
.png)
.png)
.png)
.png)
.png)
.png)
.png)
.png)
.png)
.png)
.png)
.png)
.png)
.png)
.png)
.png)
.png)
.png)
.PNG)
.PNG)
.png)
,_2000-2013_annual_data;_2008-2013_monthly_cumulated_data.PNG)
.png)
.png)
,_2000-2013_annual_data;_2008-2013_monthly_data.png)
,_2000-2014_annual_data;_2008-2014_monthly_data.png)
.png)
.png)
.png)
.png)
.PNG)
.PNG)
.png)
.PNG)
.PNG)
,_2000-2014_annual_data;_2008-2014_monthly_data_(in_GWh).PNG)

