Data extracted in September 2024.
Planned article update: October 2025.
Highlights
In 2022, domestic production in the EU accounted for 91.1% of the total supply of products, while imports accounted for the remaining 8.9%.
In 2022, nearly half (48.7%) of all products in the EU were used for intermediate consumption (to make other products), just under a third (31.2%) for final consumption, and approximately a tenth for gross capital formation (10.6%) and exports (9.5%).
In the EU, imports on the supply side and intermediate consumption on the use side increased considerably from 2021 to 2022, reflecting, at least in part, the sharp rise in global energy prices; this led to a deterioration in the external balance for goods and services.
This article presents an analysis of supply and use tables for the European Union (EU) and the euro area for the period 2010 to 2022. Supply and use tables are the backbone of national accounts. Firstly, they balance data from different sources at the most detailed level in a coherent and consistent framework, facilitating the compilation of a single and coherent estimate of gross domestic product (GDP) based on production, expenditure and income approaches. Secondly, they facilitate an analysis by product using the statistical classification of products by activity (CPA 2.1). The fundamental equations behind the supply-use system can be expressed as:
- total supply = production + imports = intermediate consumption + final consumption + gross capital formation + exports = total use; this equation is satisfied for any given product category;
- value added = production – intermediate consumption = compensation of employees + gross operating surplus and mixed income + other taxes less subsidies on production; this equation is satisfied for any given economic activity.
In this article, the supply and use tables are derived from the FIGARO tables (full international and global accounts for research in input-output analysis) that present the EU's inter-country supply, use and input-output tables (IC-SUIOT). The supply and use tables analysed in this article have some particularities compared with national supply use tables:
- All the transactions are measured at basic prices, not at purchasers' prices. Purchasers' prices can be derived by adding the taxes less subsidies on products.
- The EU and the euro area are considered as single entities/economies. Transactions between countries belonging to these economic areas (the EU or the euro area) are considered as domestic transactions, rather than exports and imports, and they are balanced.
- Exports and imports of goods and services exclude re-exported products imported from non-EU or non-euro area countries. For example, imports into Belgium from China that are re-exported to Norway won't be counted as an export from the EU to Norway or as an import into the EU from China, only a trade margin is recorded.
- The years 2021 and 2022 aren't generally available in national supply use tables but data for these 2 reference years have been estimated through the FIGARO methodology using other national accounts indicators.
This article focuses on the supply and use tables of the EU and the euro area. It is complemented by another article that examines supply and use relationships for individual EU, EFTA and enlargement countries.
Supply and use overview for the EU and euro area
In 2022, goods and services valued at €31 674 billion were produced within the EU, while imports from outside of the EU (therefore, excluding intra-EU trade) were valued at €3 106 billion. In the same year, production in the euro area amounted to €26 767 billion and imports from outside the euro area were valued at €3 183 billion. The sum of domestic production and imports represents the total supply of goods and services in the economy.
During the period 2010 to 2019, the share of domestic production in the total supply fell most years in the EU and in the euro area. It rose in 2020 but thereafter returned to its downward trend. The fall in 2022 was particularly steep, declining to its lowest level in both the EU and the euro area (91.1% for the EU and 89.4% for the euro area) – see Figure 1. This decline can be explained by a significant increase in the value of imports in 2022, reflecting, at least in part, the rising cost of energy and of various commodity prices.

(%)
Source: Eurostat (naio_10_cp15)
What use was made of these products? In value terms, nearly half (48.7% for the EU and 47.6% for the euro area) of all production in 2022 was used for intermediate consumption, in other words, to make other products. The next largest share, just below a third (31.2% for the EU and 31.0% for the euro area), was used for final consumption, typically by households or the government sector. Approximately a tenth (10.6% for the EU and 10.3% for the euro area) of the supply was used for gross capital formation, mainly for investment; this share also includes any changes in the stock levels of products between the beginning and the end of the year as well as acquisitions less disposals of valuables. Exports of products were valued at €3 291 billion for the EU and €3 332 billion for the euro area (around 6% more than the value of imports in the EU and 5% more than for the value of imports in the euro area); exports accounted for the remaining 9.5% of total supply for the EU and 11.1% for the euro area.
Looking at the period 2010 to 2022, in both the EU and the euro area the share of intermediate consumption in total use peaked and the share of final consumption expenditure reached a low point in 2022.
Figure 2: Distribution of total uses, EU, 2010–22
(%)
Source: Eurostat (naio_10_cp1610)Figure 3: Distribution of total uses, euro area, 2010–22
(%)
Source: Eurostat (naio_10_cp1610)
Understanding 2022 developments for the EU
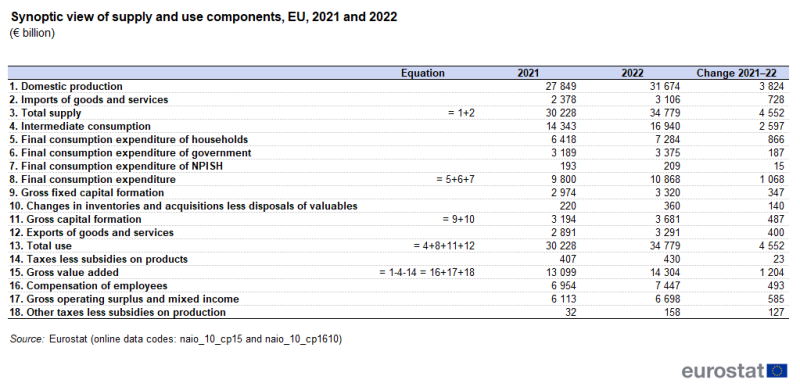
As shown above, based on an analysis of EU data for the period 2010 to 2022, imports and intermediate consumption recorded their most shares of total supply/use in 2022, while domestic production and final consumption expenditure recorded their least shares in the same year. Table 1 provides an overview of the latest EU values for 2021 and 2022 as well as information on the change between these 2 years for the main components of the supply and use tables.
From the supply side, EU imports increased by €728 billion and the EU's domestic production by €3 824 billion between 2021 and 2022, making up a total increase in the supply of €4 552 billion. Intermediate consumption accounted for 57.0% (or €2 597 billion) of this increase, which was unusually high and may be attributed, at least in part, to an increase in the price of several imported products, especially oil and gas. On the opposite side, some 19.0% (or €866 billion) of the increase in the supply was accounted for by final consumption expenditure of households. Exports increased considerably less than imports, up €400 billion in 2022 (compared with an increase of €728 billion for imports). This led to a deterioration of the external balance, which nevertheless remained positive (down from €513 billion to €185 billion).
The higher relative increase of intermediate consumption compared with domestic production resulted in the EU's gross value added increasing by €1 204 billion in 2022, with the following developments for its constituent parts: the compensation of employees increased €493 billion, while the gross operating surplus and mixed income rose €585 billion. It is also interesting to note that the value of other taxes less subsidies on production was €158 billion in 2022, having fallen to €32 billion in 2021 (this relatively low value in 2021 was, at least in part, a reflection of various subsidies provided by government to allow enterprises to tackle the impact of the COVID-19 pandemic at that time).

(€ billion)
Source: Eurostat (naio_10_cp15) and (naio_10_cp1610)
Domestic production, imports and total supply for the EU
Domestic production
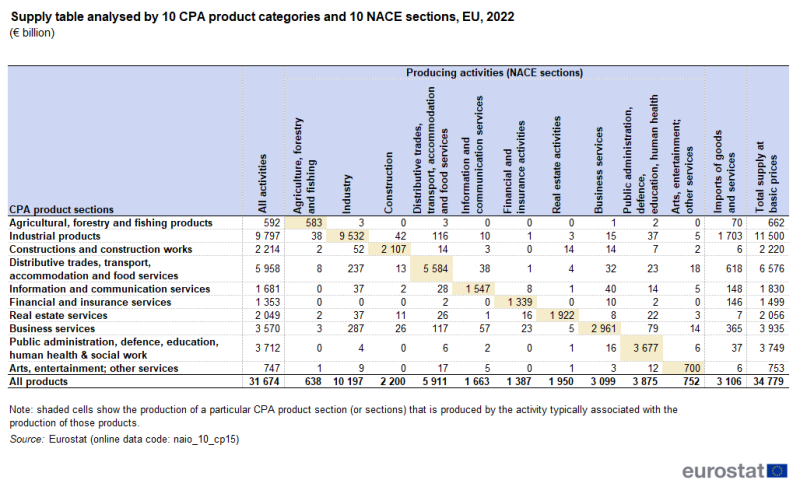
In 2022, the EU produced goods and services valued at €31 674 billion. The domestic production quadrant of the supply table shows which NACE sections (columns) produced different CPA products (rows). Table 2 presents the supply table for the EU in 2022 for 10 economic activities (NACE) and 10 CPA products. For example, the domestic production of industry amounted to €10 197 billion, of which €9 532 billion corresponded to industrial products (CPA Sections B "mining and quarrying", C "manufactured products", D "electricity, gas, steam and conditioning" and E "water supply, sewerage, waste management and remediation services") and €665 billion (€10 197 billion minus €9 532 billion) to other products.
As the activity and product classifications are linked, most activities tend to produce the corresponding products of that activity. On average, 94.6% of total output in the EU was produced by activities specialised in these corresponding products in 2022. However, this share depends on the level of aggregation, as a highly aggregated classification typically concentrates most of the production along the diagonal of the matrix while a more detailed classification results in a greater proportion of production being allocated outside the diagonal. Using a 64 product and activity classification, about 90% of total production in the EU was accounted for by products along the diagonal of the matrix.
Imports
Next to production, the supply table shows a column of imports by product category. Of the €3 106 billion of goods and services that were imported into the EU in 2022, more than half (54.8%) corresponded to industrial products. Comparing imports with total supply, it is possible to obtain a dependency ratio by type of product. For industrial products, this ratio was 14.8% (€1 703 billion of imports compared with €11 500 billion of total supply). A similar comparison for agricultural, forestry and fishing products gives a dependency ratio of 10.5% (€70 billion of imports compared with €662 billion of total supply), while the dependency ratio was very low (1% or less) for constructions and construction works as well as for several service products, including real estate services and arts, entertainment and other services.
Total supply
Adding domestic production and imports together, the result provides the total supply by product, which was €34 779 billion across the EU for all products in 2022. Almost a third (33.1%) of total supply corresponded to industrial products and a fifth (18.9%) to distributive trades, transport, accommodation and food services.

(€ billion)
Source: Eurostat (naio_10_cp15)
Intermediate consumption for the EU
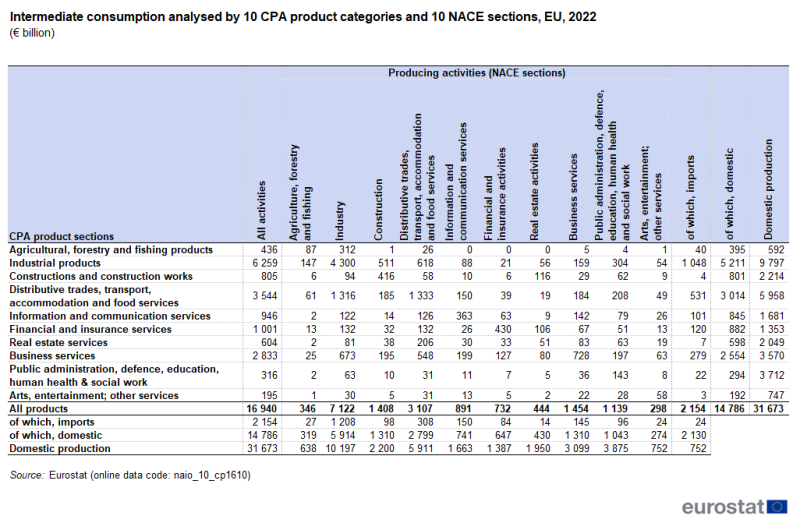
The intermediate consumption quadrant of the use table (Table 3) provides an analysis of the value and type of inputs needed in the production processes of different activities. The columns show the industries' uses for intermediate consumption and the rows the products. The EU used €16 940 billion of intermediate products to produce €31 674 billion of goods and services in 2022. As such, more than half (53.5%) of all products were used as intermediate consumption to produce other goods and services. More than a third (36.9%) of the EU's intermediate consumption corresponded to industrial products (€6 259 billion of industrial products in a total of €16 940 billion for all products), with the next largest share for distributive trades, transport, accommodation and food services (20.9%). The relative importance of intermediate consumption varies widely across activities. For example, intermediate consumption was valued at 69.8% of total output for industry, while for public administration, defence, education, human health and social work the share was 29.4%.
It is possible to add an extra row and an extra column to the analyses in order to provide information on the origin (domestic or imported) of intermediate inputs. For example, Table 3 shows that in 2022 some 12.7% of the products used for intermediate consumption in the EU were imported (€2 154 billion of imports in relation to €16 940 billion of intermediate consumption for all products). The largest share of imported products in intermediate consumption was recorded for industrial products (16.7%).

(€ billion)
Source: Eurostat (naio_10_cp1610)
Final uses for the EU
Products that aren't used within the economy as intermediate consumption are available for final use as final consumption expenditure, gross capital formation or exports. Final consumption expenditure can be broken down by sector into households, non-profit institutions serving households and general government, while gross capital formation can be broken down between gross fixed capital formation on one hand and changes in inventories and acquisition less disposals of valuables on the other.
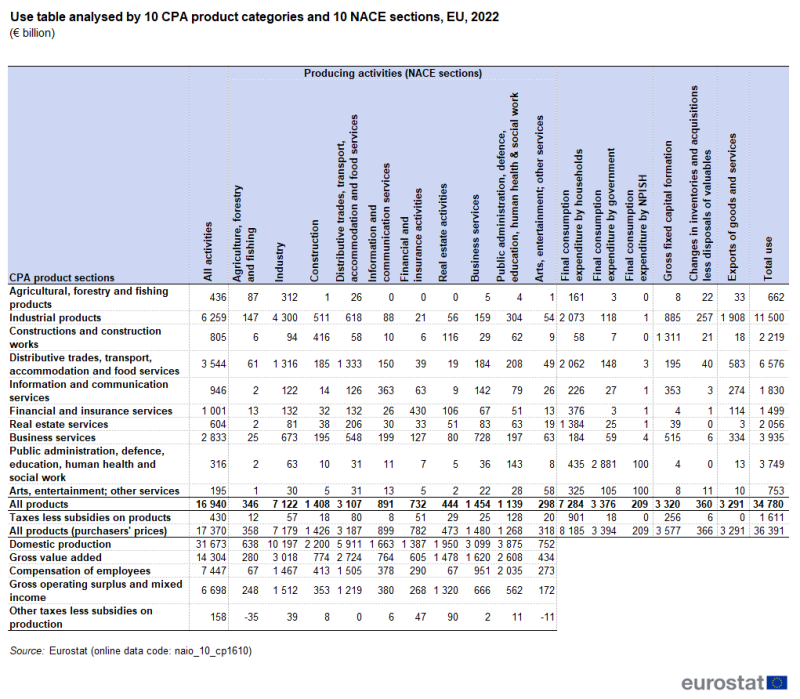
Final consumption represented 31.2% of total use across the EU in 2022. By far the largest component of final use was final consumption expenditure by households (20.9%), with final consumption expenditure by government next (9.7%), closely followed by gross fixed capital formation and by exports (both 9.5%).
Across different economic activities, there were considerable differences in the relative importance of the different components:
- household final consumption expenditure was concentrated in industrial products (covering manufactured products but also electricity, gas, steam and conditioning; water supply, sewerage, waste management and remediation services; and less importantly in this case mining and quarrying) (€2 073 billion), distributive trades, transport, accommodation and food services (€2 062 billion) and real estate services (€1 384 billion); together these 3 product sections accounted for 75.8% of household final consumption expenditure (please note that the purchase of a dwelling is classified as an investment not a consumption expenditure);
- government final consumption was concentrated in public administration, defence, education, human health and social work (€2 881 billion);
- gross fixed capital formation was concentrated in constructions and construction works (€1 331 billion);
- exports of goods and services were concentrated in industrial products (€1 908 billion).
It is also possible to add extra rows and an extra column to know the origin (domestic or imported) of the final uses. For example, imported goods and services accounted for 5.3% of total final use within the EU in 2022. Among final uses, the largest share of imported goods and services was recorded for gross capital formation (11.7%).
Value added
In order to complete the use table with value added components (from which GDP can be calculated using 3 different approaches), it is necessary to convert intermediate consumption and final uses in basic prices to market prices by adding taxes less subsidies on products, as shown at the bottom of Table 4.
Final consumption expenditure by households paid more than half (55.9%) of these taxes in the EU in 2022 (calculated as €901 billion divided by €1 611 billion), followed by intermediate consumption (26.7%) and gross fixed capital formation (15.9%). The implicit tax rate for households in the EU was 12.4% (calculated as €901 billion divided by €7 284 billion), much higher than for gross fixed capital formation (7.7%) or intermediate consumption (2.5%).
Following this adjustment, gross value added can be calculated using the output approach as domestic production minus intermediate consumption of all products at purchasers' prices. Alternatively, gross value added may be calculated using the income approach as the sum of the compensation of employees, gross operating surplus and mixed income, and other taxes less subsidies on production, thereby completing the use table.

(€ billion)
Source: Eurostat (naio_10_cp1610)
Source data for tables and graphs
Data sources
Supply, use and input-output tables form part of the national accounts as defined in the European system of accounts (ESA 2010). The concepts and definitions in ESA 2010 are fully consistent with the United Nation's System of national accounts (SNA 2008).
Eurostat collects, validates and publishes supply, use and input-output tables for the EU, EFTA and enlargement countries some 3 years after the end of the reference period. The scope and modalities of the data collection are defined in the ESA 2010 transmission programme. Countries transmit data on a mandatory basis each year for i) the supply table at basic prices including transformation into purchasers' prices and ii) the use table in purchasers' prices. Every 5 years (years ending with a '0' or '5'), the transmission also includes i) the use table at basic prices, ii) a table for trade and transport margins, iii) a table for taxes less subsidies on products and iv) input-output tables. All tables have to be delivered no later than 3 years after the reference period. Eurostat welcomes voluntary data transmissions and publishes data, as they become available.
The tables distinguish 64 product and industry categories according to CPA 2.1 and NACE Rev. 2; all transactions are valued in monetary units.
Context
Supply and use tables are matrices that depict monetary transactions within the economy presented by product (in rows) and industry (in columns). The supply table captures domestic production or output (by product and industry) and imports (by product). It also includes data on trade and transport margins and taxes less subsidies on products such that supply data can be transformed from basic prices into purchasers' prices. The use table reveals how domestic production and imports are used for intermediate consumption (analysed by product and industry) and final uses (analysed by product and disaggregated for final consumption expenditure, gross capital formation and exports). The use table also provides information on gross value added by industry (disaggregated into the compensation of employees, consumption of fixed capital, other net taxes on production, net operating surplus and mixed income).
Supply and use tables are central to national accounts. They adhere to a common set of definitions for all products, activities and institutional sectors to show a consistent picture of how goods and services are brought into the economy, how they are used and how value is created in the process. Supply and use tables respect the following identities:
- total supply = total use – the supply of goods and services (either through domestic production or imports) must be equal to the use of goods and services (either through intermediate consumption, final consumption, gross capital formation or exports);
- total output = total input – for each industry, the output of goods and services produced must be equal to intermediate and primary inputs (products for intermediate consumption, the compensation of employees, consumption of fixed capital, other taxes less subsidies on production, net operating surplus).
Supply and use tables help determine a single and consistent estimate of GDP, based on 3 approaches considering production, expenditure and income within an economy:
- production approach – GDP is the sum of the gross value added of all industries, plus taxes less subsidies on products (which aren't allocated to industries);
- expenditure approach – GDP is the sum of final uses of goods and services (including final consumption expenditure by households, general government and non-profit institutions serving households, gross capital formation and exports) minus imports of goods and services;
- income approach – GDP is the sum of income earned by individuals and businesses (including the compensation of employees, consumption of fixed capital, taxes on production and imports less subsidies, net operating surplus and mixed income).
Supply and use tables provide the basis for input-output tables that capture the supply and use of products in a single matrix. Input-output tables are obtained by transforming either the products in the rows into industries or the industries in the columns into products. The transformation involves several assumptions and results in a symmetric, intermediate consumption matrix, showing only products or industries in both rows and columns. Input-output tables thereby depict the supply and use of goods and services with a single classification (either analysed by product or by industry).
Together, supply, use and input-output tables help determine input-output coefficients and multipliers for Leontief-type input-output modelling. They underpin a wealth of macro-economic and econometric analyses, for example, general equilibrium models. Supply, use and input-output tables capture the value chains of goods and services produced and consumed within an economy as well as import and export flows from and to other countries. Supply, use and input-output tables can be extended to trace the economic impacts of specific domains (for example tourism, the digital industry or the space economy) or environmental impacts (for example resource use, deforestation or emission footprints).
Explore further
Other articles
Database
- Supply, use and Input-output tables - current prices (naio_10_cp)


