Data extracted in November 2024.
Planned article update: 10 November 2025.
Highlights
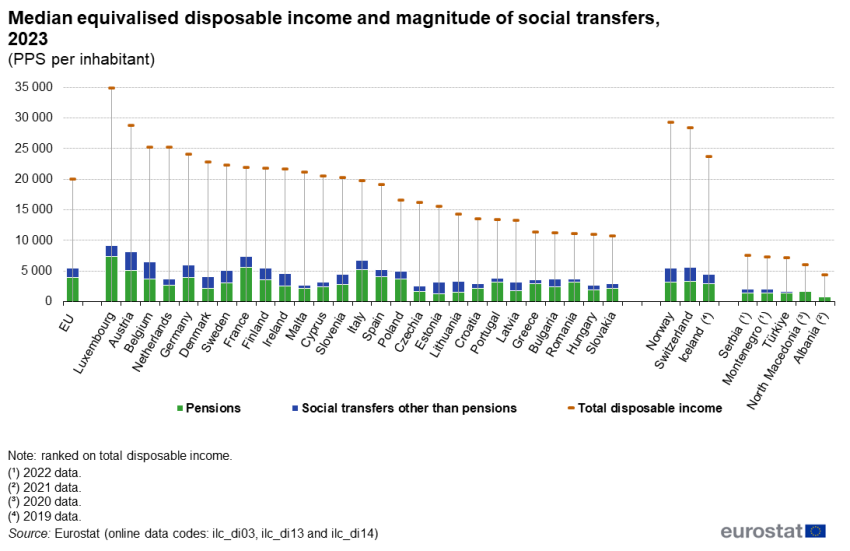
In 2023, social transfers (including pensions) accounted for 5 538 PPS of the EU median disposable income, with 1 558 PPS from transfers other than pensions.
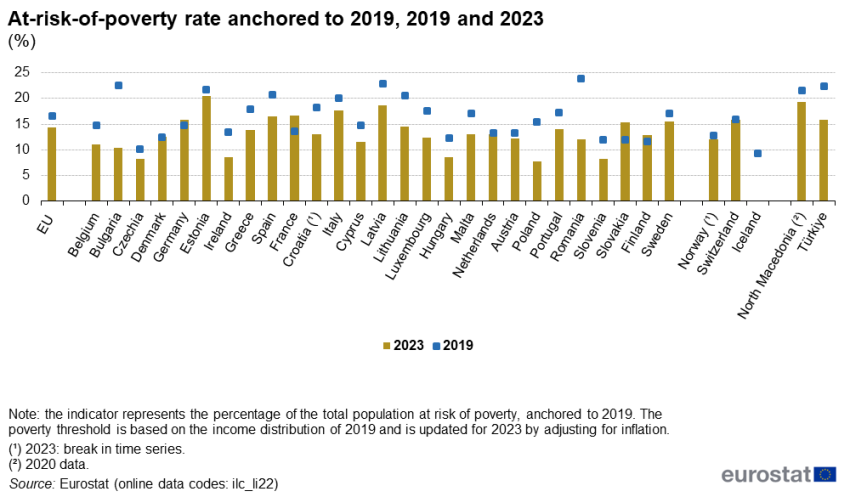
The EU's at-risk-of-poverty rate anchored to 2019 decreased to 14.3% in 2023, down from 16.5% in 2019.
This article focuses on income distribution and poverty risk in the European Union (EU) in 2023. It examines median disposable income, the role of social transfers, regional disparities in poverty risk, and income inequality as measured by the Gini coefficient..
All figures are based on EU statistics on income and living conditions (EU-SILC) available from Eurostat's online database. EU-SILC data are available for all EU Member States, as well as for most of the EFTA and candidate countries.
Key findings
- EU median annual disposable income per inhabitant stood at 19 955 PPS in 2023.
- It varied considerably across the EU countries, ranging from 10 670 PPS in Slovakia to 34 777 PPS in Luxembourg.
- Social transfers, including pensions, accounted for 5 538 PPS of the EU median disposable income, with 1 558 PPS from transfers other than pensions.
- Social transfers, including pensions, ranged from 1.7 times higher than social transfers other than pensions in Estonia to 7.3 times in Romania.
- The share of people at risk of poverty exceeded 45% in one region in France’s overseas departments, while 9 regions across southern and eastern Europe as well as other France’s overseas departments reported shares between 30.0% and 44.9%. Conversely, 26 regions recorded shares below 10%, primarily in Central, Western, and Southern Europe.
- The at-risk-of-poverty rate anchored to 2019 decreased to 14.3% in 2023 at the EU level, with the largest reductions in Bulgaria, Romania, and Poland. In contrast, increases were recorded in Germany, Finland, France, and Slovakia.
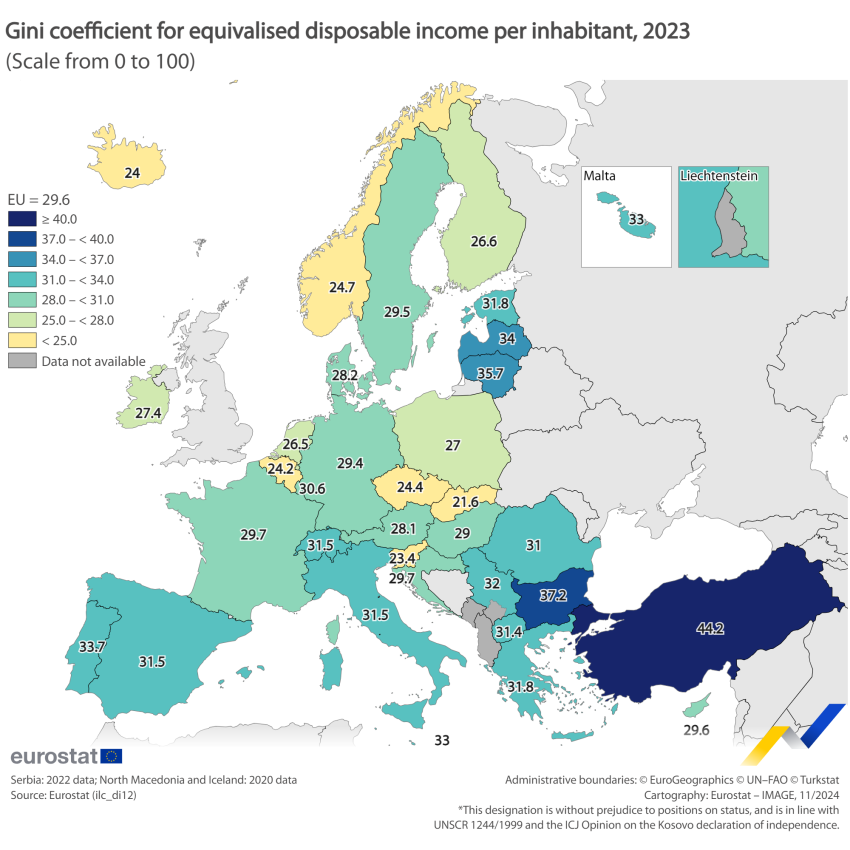
- In 2023, the Gini coefficient for the EU was 29.6. In 2023, the highest levels of inequality in terms of disposable income in the EU were in Bulgaria (37.2), Lithuania (35.7) and Latvia (34.0). On the other hand, among the EU countries, income was most equally distributed in Slovakia (21.6), Slovenia (23.4), Belgium (24.2) and Czechia (24.4).
Income distribution
Median annual disposable income in 2023 highest in Luxembourg and lowest in Slovakia
In 2023, the median annual disposable income was 19 955 PPS per inhabitant in the EU. Across the EU countries, it ranged from 34 777 PPS in Luxembourg and 28 690 PPS in the Austria to 10 670 PPS in Slovakia and 10 960 PPS in Hungary.
Figure 1shows the contribution of social transfers to disposable income. This information is split between transfers for pensions and other social transfers, for example, social security benefits and social assistance that aim to alleviate or reduce the risk of poverty.
In 2023, for the EU as a whole, social transfers (including pensions) accounted for 5 538 PPS per inhabitant of the median disposable income, with social transfers other than pensions accounting for 1 558 PPS.
Among the EU countries, there were considerable variations in the contribution made by social transfers to median disposable income in 2023. The largest transfers were observed in Luxembourg, where social transfers (including pensions) increased the median disposable income by 9 175 PPS per inhabitant. Social transfers (including pensions) were also relatively high in Austria (8 190 PPS) and France (7 338 PPS).
A somewhat different pattern emerges if pensions are excluded from the analysis. In 2023, social transfers other than pensions contributed more than 2 500 PPS per inhabitant to median disposable income in Austria (3 028 PPS) and Belgium (2 761 PPS).
It is interesting to compare the level of social transfers across the EU countries including and other than pensions. In Estonia, social transfers including pensions in 2023 were only around 1.7 times higher than social transfers excluding pensions. By contrast, in Romania, the value of social transfers including pensions was 7.3 times higher than social transfers other than pensions. Finally, in Portugal, Greece and Luxembourg social transfers including pensions were respectively 6.1, 5.7 and 5.1 times higher than transfers other than pensions.

(PPS per inhabitant)
Source: Eurostat (ilc_di03), (ilc_di13) and (ilc_di14)
Regional disparities observed in shares of people at risk of poverty across the EU
Map 1 shows the share of people at risk of poverty at regional NUTS level 2 in 2023. Among all EU regions, one region in France's overseas departments (Guyane) recorded the highest percentage of people at risk of poverty, exceeding 45%.
Across the EU, 9 regions had a share of people at risk of poverty ranging from 30.0% to 44.9%. These regions specifically include one of France's overseas departments (La Réunion), 2 of Spain’s autonomous cities (Ciudad de Ceuta and Ciudad de Melilla), one region in Spain (Andalucía), 3 regions in Italy (Campania, Calabria and Sicilia), and 2 regions in Romania (Nord-Est and Sud-Vest Oltenia).
Conversely, 26 regions in the EU recorded shares of people at risk of poverty below 10% in 2023, primarily located in central, western, and southern Europe. These included five regions each in Germany (Stuttgart, Tübingen, Oberbayern, Oberpfalz and Trier) and Belgium (Prov. Limburg, Prov. Oost-Vlaanderen, Prov. Vlaams-Brabant, Prov. West-Vlaanderen and Prov. Brabant wallon), 4 regions in Czechia (Praha, Střední Čechy, Jihozápad and Severovýchod), 3 regions each in Hungary (Budapest, Közép-Dunántúl and Nyugat-Dunántúl) and Italy (Provincia Autonoma di Bolzano/Bozen, Provincia Autonoma di Trento and Emilia-Romagna), 2 regions in Poland (Śląskie and Warszawski stołeczny), and 1 region each in Finland (Helsinki-Uusimaa), Austria (Burgenland), Slovakia (Bratislavský kraj), and Romania (Bucureşti-Ilfov).
Figure 2 shows that the at-risk-of-poverty rate anchored to 2019 decreased across the EU, reaching 14.3% in 2023, compared to 16.5% in 2019. This decline reflects an overall improvement in living standards for low-income groups, likely supported by inclusive economic growth. It suggests that the real equivalised disposable incomes of these groups, adjusted for inflation, have increased compared to the 2019 baseline, lifting many out of poverty. The largest reductions were observed in Bulgaria (down 12.2 percentage points (pp) to 10.4%) and Romania (down 11.8 pp to 12.0%). Similarly, significant improvements were recorded in Poland, where the rate dropped by 7.7 pp to 7.7%, the lowest rate among EU countries in 2023.
However, some countries recorded increases in their anchored at-risk-of-poverty rates. Germany saw its rate rise by 1.0 pp to 15.8%, while Finland experienced an increase of 1.3 pp, reaching 12.9% in 2023. France reported a more significant rise of 3.0 pp to 16.6%, and Slovakia recorded the largest increase, up 3.5 pp to 15.4%.

(%)
Source: Eurostat (ilc_li22)
Income inequality
Median disposable income provides a measure of average living standards, but it does not capture the distribution of income within the population. The Gini coefficient gives the extent to which the distribution of income within a country deviates from a perfectly equal distribution. A Gini value of 100 means that only one person receives all the income in the country, while a Gini value of 0 means that income is distributed equally across the population.
Income inequality as measured by Gini coefficient above the EU average in 13 EU countries
In 2023, the Gini coefficient for the EU was 29.6, as shown in Map 2. The highest income disparities among the EU countries were recorded in Bulgaria (37.2), Lithuania (35.7) and Latvia (34.0). In France, Croatia, Cyprus, Sweden and Germany, the Gini coefficients were close to the EU average, indicating income distributions consistent with the EU coefficient. At the other end of the scale, income was more evenly distributed in Slovakia, Slovenia, Belgium and Czechia, where the Gini coefficient was less than 25.0.

(%)
Source: Eurostat (ilc_di12)
Source data for tables and graphs
Data sources
The data used in this article are derived from EU statistics on income and living conditions (EU-SILC). EU-SILC data are compiled annually and are the main source of statistics that measure income and living conditions in Europe. It is also the main source of information used to link different aspects relating to the living conditions of households and individuals.
The reference population for the information presented in this article is all private households and their current members residing in the territory of an EU Member State (or non-EU member country) at the time of data collection. Persons living in collective households and in institutions are generally excluded from the target population. The data for the EU are population-weighted averages of national data. The reference time for information on income is 2021, while the other households' characteristics are referenced to 2023.
Context
To consider differences in household size and composition, and thus enable comparisons of income levels across countries and population groups, the concept of equivalised disposable income is used. This measure is based on the total net (also referred to as disposable) household income divided by the number of ’equivalent adults’ in the household, using a standard (equivalence) scale. Eurostat employs the ’modified OECD scale’, which assigns a weight of 1.0 to the household head, 0.5 to each additional adult (aged 14 and over), and 0.3 to each child (aged under 14). The weights are summed to calculate an equivalised household size, which is then used to divide the total household income and determine the equivalised disposable income attributed to each household member – more details are provided in the glossary).
For the anchored at-risk-of-poverty rate, the equivalised disposable income is compared to a fixed poverty threshold, which is calculated using the income distribution of the base year (2019). This anchored poverty line remains constant over time but is adjusted for inflation to maintain its real value. The anchored poverty threshold enables comparisons across years, providing a consistent baseline to assess changes in living standards for low-income groups.
The median of the equivalised disposable income distribution is typically used in the EU as a key measure for analysing standards of living within each economy. It is simply the income level that divides the population into two groups of equal size: one group encompasses half the population with a level of disposable income above the median and the other group encompasses the half of the population with a level of disposable income below the median. The use of the median (rather than the arithmetic mean) avoids any potential distortion that may be caused by the existence of extreme values, such as a few extremely rich households that may raise the arithmetic mean.
The at-risk-of-poverty rate (AROP) is part of the at risk of poverty or social exclusion rate (AROPE). The AROPE ratio is the share of the total population which is at risk of poverty or social exclusion. The headline target (EU2030 target) on poverty and social inclusion of the European Pillar of Social Rights Action Plan is to reduce the number of people at risk of poverty or social exclusion by at least 15 million by 2030. Progress towards this target is monitored through the AROPE rate, published by Eurostat.
Explore further
Other articles
Online publication
- All articles from Living conditions in Europe
- EU statistics on income and living conditions (EU-SILC) methodology - people at risk of poverty or social exclusion
- Living conditions in Europe - poverty and social exclusion
Other statistical articles
- Migrant integration statistics — at risk of poverty and social exclusion
- SDG 10 — Reduced inequalities
Background articles
Thematic section
Selected datasets
Methodology
External links
Legislation
- Detailed list of legislative information on EU-SILC provisions for survey design, survey characteristics, data transmission and ad-hoc modules
- Regulation (EC) No 2019/1700 - the central piece of legislation for social surveys including EU-SILC
- Regulation (EC) No 2019/2242 — additional central piece of legislation for EU-SILC
- Summaries of EU Legislation: EU statistics on income and living conditions

