Data extracted in February 2025
Planned article update: February 2026
Highlights
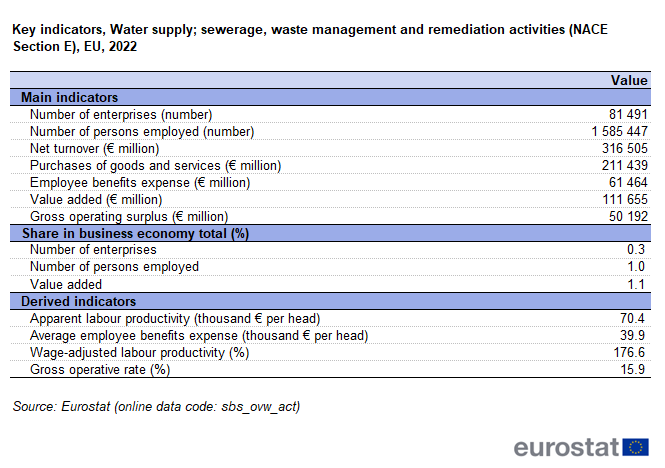
The water supply, sewerage, waste management and remediation activities sector accounted for 81 500 enterprises in the EU in 2022 and generated €316.5 billion of net turnover.
The water supply, sewerage, waste management and remediation activities sector employed 1.6 million people in the EU in 2022.
This article presents information relating to the European Union's (EU) water supply, sewerage, waste management and remediation activities, as covered by NACE Rev. 2 Section E. It belongs to a set of statistical articles on 'Business economy by sector'.
Structural profile
There were almost 81 500 enterprises classified within the EU's water supply, sewerage, waste management and remediation activities sector (Section E) in 2022, an increase of 2.3% compared with 2021. These enterprises employed 1.6 million persons, 1.6% more than the previous year. They generated €111.7 billion of value added, 4.3% more than in 2021 and €316.5 billion of net turnover, 9.3% more than in 2021.
Enterprises in the water supply, sewerage, waste management and remediation activities sector contributed only with 0.3% of the total number of enterprises in the EU's business economy (Sections B to N and P to R, as well as Divisions S95 and S96) in 2022, and accounted for only 1.0% of its employment and 1.1% of its value added. Compared with the other NACE sections within the business economy, the water supply, sewerage, waste management and remediation activities sector was the second smallest sector in terms of its number of enterprises: only mining and quarrying employed fewer persons. In terms of employment, the water supply, sewerage, waste management and remediation activities sector was the third smallest in 2022 – only the mining and quarrying sector and electricity, gas, steam and air conditioning supply employed less.

Source: Eurostat (sbs_ovw_act)
The average employee benefits expenses (average personnel costs) within the EU's water supply, sewerage, waste management and remediation activities sector were €39 900 per employee in 2022, a bit lower than the average in the business economy (€41 100). Apparent labour productivity in the water supply, sewerage, waste management and remediation activities sector was €70 400 per person employed. The wage-adjusted labour productivity ratio gives an idea of the extent to which apparent labour productivity relates to average personnel costs. For the EU's water supply, sewerage, waste management and remediation activities sector in 2022 this ratio was 176.6%; this was well above the business economy average (152.6%).
Sectoral analysis
In employment terms, waste collection, treatment and disposal activities and materials recovery (Division 38, hereafter referred to as waste and materials recovery) was the largest subsector in the EU, occupying more than two-thirds (69.4%) of the employment within the water supply, sewerage, waste management and remediation activities sector in 2022 — see Figure 1.
Water collection, treatment and supply (Division 36, hereafter referred to as water supply) contributed to less than one-quarter (21.3%) of the employment, followed by sewerage activities (Division 37) with 9.5% and remediation activities and other waste management services (Division 39) with 2.3%. Waste and materials recovery was the largest subsector in the EU also in value added terms, with 62.7% of the value added within the water supply, sewerage, waste management and remediation activities sector in 2022.

(% share of sectoral total)
Source: Eurostat (sbs_ovw_act)
In 2022, within the sector of water supply, sewerage, waste management and remediation activities sector, the subsector of materials recovery was the largest subsector, not only in terms of employment (1.1 million persons) and value added (€70.0 billion), but also in terms of number of enterprises (49 400 enterprises) and total employee benefits expense (€41.0 billion).

Source: Eurostat (sbs_ovw_act)
The apparent labour productivity varied considerably among the 4 subsectors, from €62 100 per person employed for remediation activities and other waste management services to €89 300 per person employed for the sewerage subsector. Average employee benefits expense for the water supply, sewerage, waste management and remediation activities sector was €39 900 per employee in 2022. For the 4 subsectors, the values for the average employee benefits expense were quite similar, ranging from €37 600 for the water collection, treatment and supply to €45 100 for the remediation activities and other waste management services.

Source: Eurostat (sbs_ovw_act)
Country overview
As was the case for electricity, gas, steam and air conditioning supply, the water supply, sewerage, waste management and remediation activities sector contributed a relatively large share of the business economy employment in a number of EU countries in Central and Eastern Europe.
The water supply, sewerage, waste management and remediation activities sector provided employment to 1.0% of the total business economy persons employed in 2022 in the EU. The highest employment rate was registered in Croatia, where 2.5% of the persons employed in the business economy were employed in the water supply, sewerage, waste management and remediation activities sector. In Romania the employment share was 1.8% and in Bulgaria and Slovenia the share was 1.4%. On the other side, in Luxembourg and the Netherlands this sector contributed to only 0.4% of the business economy employment. The water supply, sewerage, waste management and remediation activities sector accounted for a similar share of business economy value added as employment in the majority of the EU countries in 2022 (see Figure 2).

(% share of value added and employment in the business economy total)
Source: Eurostat (sbs_ovw_act)

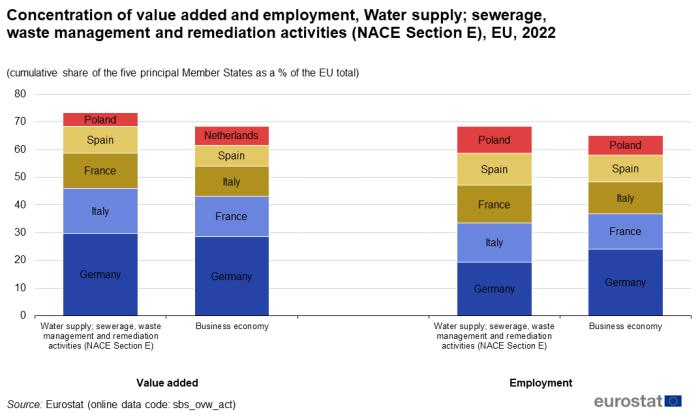
(cumulative share of the 5 principal EU countries as a % of the EU total)
Source: Eurostat (sbs_ovw_act)
Germany had the most value added for the total of the water supply; sewerage, waste management and remediation activities (29.8% of the EU total), as well as for all the 4 subsectors. Table 3 shows that there were a number of country-specific cases of specialisation within the water supply, sewerage, waste management and remediation activities sector. In Croatia this sector contributed 2.3% of business economy value added in 2022. Croatia was also most specialised in the waste management and materials recovery sector, which represented 1.6% of the country's business economy value added and in remediation activities and other waste management services (0.1%). The water supply subsector was dominated by Portugal (0.6%), while the sewerage subsector was dominated by Cyprus with 0.4% of business economy value added.

Source: Eurostat (sbs_ovw_act)
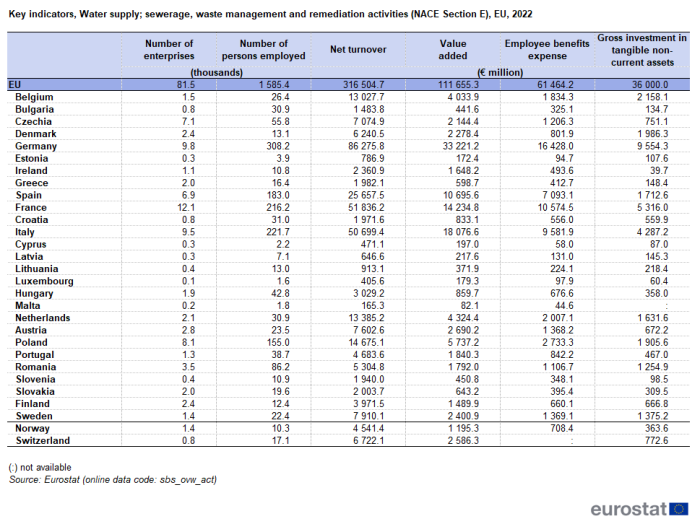
In absolute terms, Germany, Italy and France had the largest number of persons employed in the water supply, sewerage, waste management and remediation activities sector in 2022, each with more than 210 000 persons employed, followed by Spain and Poland with 183 000 and 155 000 persons employed respectively. In terms of value added, Germany had by far the largest water supply, sewerage, waste management and remediation activities sector, generating €33.2 billion, or 29.8% of overall value added in the sector. It was followed by Italy (18.1%), France (14.2%), Spain (10.7%) and Poland (5.7%).

Source: Eurostat (sbs_ovw_act)
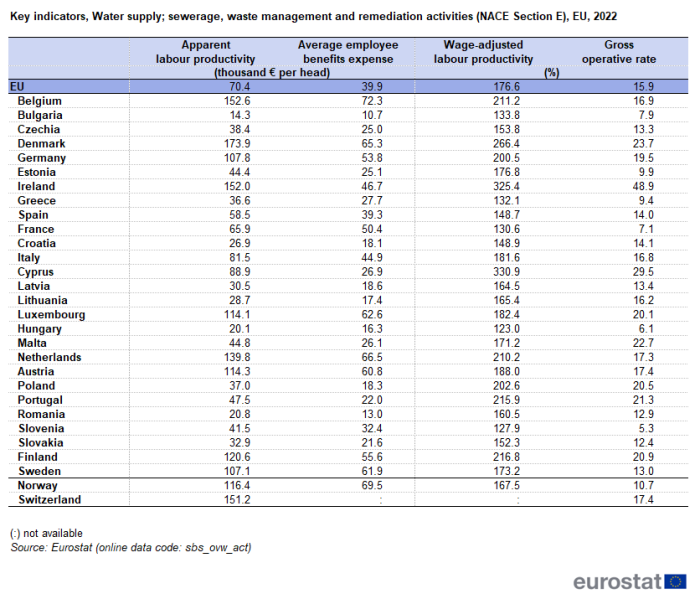
These very different levels were reflected in the apparent labour productivity figures, with Germany averaging a value added of €107 800 per person employed and Italy with €81 500, far ahead of the EU average of €70 400 per person employed. However, there were EU countries with even higher apparent labour productivity, e.g. Denmark (€173 900 per person employed), Belgium (€152 600 per person employed), Ireland (€152 000 per person employed) and the Netherlands (€139 800 per person employed). The highest wage-adjusted labour productivity ratios with values above 250% in the water supply, sewerage, waste management and remediation activities sector were recorded in Cyprus (330.9%), Ireland (325.4%) and Denmark (266.4%).

Source: Eurostat (sbs_ovw_act)
Source data for tables and graphs
Data sources and availability
Coverage
This article presents an overview of statistics for the EU's water supply, sewerage, waste management and remediation activities sector, as covered by NACE Rev. 2 Section E. This NACE section is composed of 4 NACE divisions, namely:
- water supply (Division 36) which concerns the collection, purification, desalinisation and distribution of water. Some water, particularly when used in production processes, does not come from the public water supply system, but rather is extracted directly from its source. The (typically long distance) transport of water via pipelines is excluded.
- sewerage activities (Division 37) which concern the operation of sewer systems or sewage treatment facilities that collect, treat, and dispose of sewage. Activities of water supply are often carried out in connection with, or by units also engaged in, the treatment of sewerage.
- the management (including collection, treatment and disposal) of other forms of waste (Division 38), whether solid or non-solid waste, industrial or household waste, including the dismantling of wrecks and the operation of materials recovery facilities. Materials recovery includes the processing of metal and non-metal waste and scrap and other articles into secondary raw materials: the processing may involve a number of stages such as separating, sorting, crushing, shredding, cutting, melting, grinding, pressing, stripping, cleaning and composting. The output of the waste or sewage treatment process can either be disposed of or become an input into other production processes. Materials recovery does not extend to the production of new final products, nor does it include wholesaling of recoverable materials. Materials recovery does not cover reprocessing of nuclear fuels. Note also that substantial materials recovery may be carried out by enterprises as ancillary activities, without the involvement of enterprises in the waste management subsector.
- remediation activities (Division 39) such as decontamination.
Data sources
The analysis presented in this article is based on the main dataset for structural business statistics (SBS), size class data and regional data, all of which are published annually. The main series provides information for each EU Member State as well as a number of non-member countries at a detailed level according to the activity classification NACE. Data are available for a wide range of variables. Structural business statistics cover the 'business economy', which includes industry, construction and many services (NACE Rev. 2 sections B to N, P to R as well as division S95 and S96). Structural business statistics do not cover agriculture, forestry and fishing, nor public administration. Structural business statistics describe the business economy through the observation of units engaged in an economic activity; the unit in structural business statistics is generally the enterprise. An enterprise carries out 1 or more activities, at 1 or more locations, and it may comprise 1 or more legal units. Enterprises that are active in more than 1 economic activity (plus the value added and turnover they generate, the people they employ, and so on) are classified under the NACE heading corresponding to their principal activity; this is normally the 1 which generates the largest amount of value added.
In structural business statistics, size classes are generally defined by the number of persons employed. A limited set of the standard structural business statistics variables (for example, the number of enterprises, turnover, persons employed and value added) are analysed by size class, mostly down to the 3-digit (group) level of NACE. The main size classes used in this article for presenting the results are:
- small and medium-sized enterprises (SMEs): with 1 to 249 persons employed, further divided into:
- micro enterprises: with less than 10 persons employed;
- small enterprises: with 10 to 49 persons employed;
- medium-sized enterprises: with 50 to 249 persons employed;
- large enterprises: with 250 or more persons employed.
Structural business statistics also include regional data. Regional SBS data are available at NUTS levels 1 and 2 for the EU Member States, Iceland and Norway, mostly down to the 2-digit (division) level of NACE. The main variable analysed in this article is the number of persons employed. The type of statistical unit used for regional SBS data is normally the local unit, which is an enterprise or part of an enterprise situated in a geographically identified place. Local units are classified into sectors (by NACE) normally according to their own main activity, but in some EU Member States the activity code is assigned on the basis of the principal activity of the enterprise to which the local unit belongs. The main SBS data series are presented at national level only, and for this national data the statistical unit is the enterprise. It is possible for the principal activity of a local unit to differ from that of the enterprise to which it belongs. Hence, national SBS data from the main series are not necessarily directly comparable with national aggregates compiled from regional SBS.
Context
Water
The organisation of water supply within the EU varies between Member States, with state-owned, private and mutual enterprises, as well as municipalities involved in terms of the ownership or operation of infrastructure. Among the key issues that affect this sector are the quality of drinking water, and the efficient use of water resources, the latter concerning issues such as pricing, repair of leakages, metering of water use, and water-efficient practices. Furthermore, the cost of related services (such as wastewater collection and treatment) is an important factor, as is the impact of changes in consumption patterns, for example, the increased use of water related to growth in tourism particularly in areas with scarce water resources.
Adopted in 2000, the Water framework Directive provides the basis for water policy within the EU. This framework directive is built on 4 main pillars:
- coordinated action to achieve 'good status' for all EU waters, including surface and groundwater, by 2015;
- setting-up a water-management system based on natural river basin districts, crossing regional and national boundaries — at the time of writing most but not all river basin management plans had been adopted;
- integrated water management, bringing different water management issues into1 framework;
- active involvement of interested parties and consultation of the public.
Other relevant directives include the Urban Waste Water Directive, the Nitrates Directive, the Drinking Water Directive and the Groundwater Directive.
Waste
In November 2008, a Waste framework Directive was adopted which introduces a binding 5-step waste hierarchy, whereby prevention is the preferred option, followed by re-use, recycling and other forms of recovery, with disposal such as landfill used only as a last resort. Unless properly regulated, the disposal of waste may have a serious environmental impact: landfills, for example, can take up land space and may cause air, water and soil pollution, while incineration can result in emissions of dangerous air pollutants. The Waste Framework Directive lays down some basic waste management principles. It requires that waste be managed
- without endangering human health and harming the environment,
- without risk to water, air, soil, plants or animals,
- without causing a nuisance through noise or odours,
- and without adversely affecting the countryside or places of special interest.
It explains when waste ceases to be waste and becomes a secondary raw material, and how to distinguish between waste and by-products. The Directive also introduces the "polluter pays principle" and the "extended producer responsibility" (source European Environment Agency).
Explore further
Other articles
More detailed analysis of water supply; sewerage, waste management and remediation activities:
Thematic section
Publications
- Recent Eurostat publications on SBS
- Key figures on Europe – 2024 edition – see subchapter on Business
- Eurostat's Regional Yearbook – see chapter 8. Business
- News Release SBS – 2021 final data
Selected datasets
Methodology
External links
