Reference metadata describe statistical concepts and methodologies used for the collection and generation of data. They provide information on data quality and, since they are strongly content-oriented, assist users in interpreting the data. Reference metadata, unlike structural metadata, can be decoupled from the data.
Eurostat - Unit C.1: National accounts methodology; Standards and indicators
1.3. Contact name
Confidential because of GDPR
1.4. Contact person function
Confidential because of GDPR
1.5. Contact mail address
2920 Luxembourg LUXEMBOURG
1.6. Contact email address
Confidential because of GDPR
1.7. Contact phone number
Confidential because of GDPR
1.8. Contact fax number
Confidential because of GDPR
2.1. Metadata last certified
31 October 2025
2.2. Metadata last posted
31 October 2025
2.3. Metadata last update
31 October 2025
3.1. Data description
Financial flows and stocks data are often referred to collectively in the national accounts framework as ‘financial accounts’. Financial flows consist of transactions and other flows, and represent the difference between the opening financial balance sheet at the start of the year and the closing balance sheet at the end of the year. These terms are described in further detail in section 3.4.
Financial flows and stocks contain statistical information based on the European System of Accounts (ESA 2010) (see annex below), which came into force in September 2014. The data are compiled with reference to:
Financial balance sheets (nasa_10_f_bs)
Financial transactions (nasa_10_f_tr)
Revaluation accounts (nasa_10_f_gl)
Other changes in volume (nasa_10_f_oc)
Financial accounts: counterpart information (nasa_10_f_cp)
The financial assets held and the liabilities outstanding at a particular point in time are recorded in the balance sheet. Financial transactions result in changes between opening and closing balance sheets. However, changes between the opening balance sheet and the closing balance sheet are also due to other flows, which are not interactions between institutional units by mutual agreement. Other flows related to financial assets and liabilities are broken down into revaluations in financial assets and liabilities, and changes in the volume of financial assets and liabilities not due to financial transactions. Revaluations are recorded in the revaluation account and changes in volume in the other changes in the volume of assets account.
For more information, see also:
The dedicated website for Financial accounts and Sector accounts
The classification system follows the European System of Accounts (ESA 2010) (see annex below). The latter is an internationally compatible accounting framework for a systematic and detailed description of a total economy, its components and its relations with other total economies. Thus, the concepts, definitions and classifications are based on ESA 2010.
The institutional sectors of ESA 2010 are listed below. For detailed definitions of institutional sectors and sub-sectors, see ESA 2010 chapter 2.
Total economy (S.1): Total economy refers to the whole economy of a given region (country or aggregate).
Non-financial corporations (S.11): Non-financial corporations are independent legal entities and market producers, whose principal activity is the production of goods and non-financial services. This sector includes private and public corporations that are market producers principally engaged in the production of goods and non-financial services.
ESA2010 Definition: the non-financial corporations sector (S.11) consists of institutional units which are independent legal entities and market producers, and whose principal activity is the production of goods and non-financial services. The non-financial corporations sector also includes non-financial quasi-corporations.
Financial corporations (S.12): Financial corporations are independent legal entities and market producers, whose principal activity is the production of financial services. This includes banks, investments and pension funds, insurances.
ESA2010 Definition: the financial corporations sector (S.12) consists of institutional units which are independent legal entities and market producers, and whose principal activity is the production of financial services. Such institutional units comprise all corporations and quasi-corporations which are principally engaged in:
Also included are institutional units providing financial services, where most of either their assets or their liabilities are not transacted on open markets.
General government (S.13): General government are institutional units, which are non-market producers, whose output is intended for individual and collective consumption.
ESA2010 Definition: the general government sector (S.13) consists of institutional units which are non-market producers whose output is intended for individual and collective consumption, and are financed by compulsory payments made by units belonging to other sectors, and institutional units principally engaged in the redistribution of national income and wealth.
Households (S.14): Households are individuals consuming or producing market output for their own private use.
ESA2010 Definition: the households sector (S.14) consists of individuals or groups of individuals as consumers and as entrepreneurs producing market goods and non-financial and financial services (market producers) provided that the production of goods and services is not by separate entities treated as quasi-corporations. It also includes individuals or groups of individuals as producers of goods and non-financial services for exclusively own final use.
Non-profit institutions serving households (S.15): Non-profit institutions serving households are entities that supply non-market output for individual consumption.
ESA2010 Definition: the non-profit institutions serving households (NPISHs) sector (S.15) consists of non-profit institutions which are separate legal entities, which serve households and which are private non-market producers. Their principal resources are voluntary contributions in cash or in kind from households in their capacity as consumers, from payments made by general government and from property income.
Rest of the World (S.2): Rest of the world refers to all countries except the EU-27.
ESA2010 Definition: the rest of the world sector (S.2) is a grouping of units without any characteristic functions and resources; it consists of non-resident units insofar as they are engaged in transactions with resident institutional units, or have other economic links with resident units. Its accounts provide an overall view of the economic relationships linking the national economy with the rest of the world. The institutions of the EU and international organisations are included.
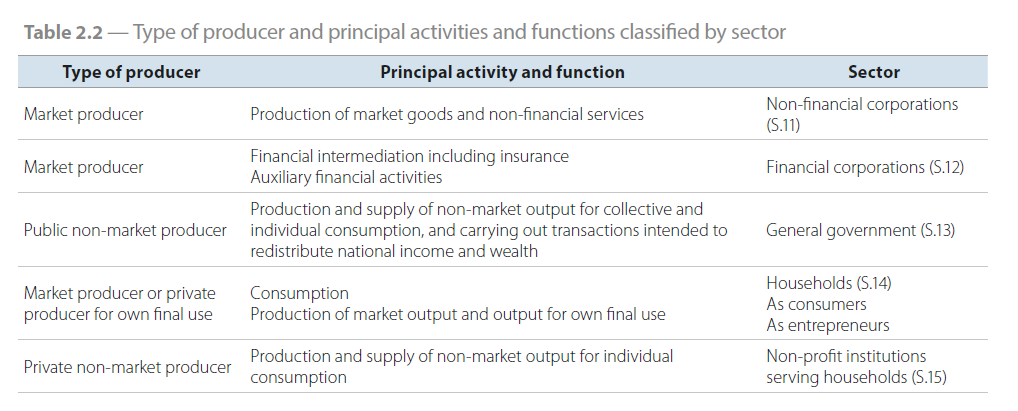
Table 2.2 below shows the type of producer and prinicipal activitites and functions classified by sector, as defined in ESA2020 chapter 2. Source: ESA2010.
3.3. Coverage - sector
The coverage of data reported in the financial accounts domain is given by Tables 6 and 7 of the ESA 2010 Transmission Programme.
This document presents the programme of national accounts data delivery within the framework of the new European System of National and Regional Accounts (ESA 2010), as defined in Annex B of the Council Regulation (EU) No 549/2013 of the European Parliament and of the Council of 21 May 2013 and EU regulation 2023/734 amending the European system of regional and national accounts (ESA 2010)
For financial accounts, data are requested in general terms starting from reference year 1995 for stocks, transactions, other changes in volume and revaluation accounts. Data are requested in both consolidated and non-consolidated form.
For other changes in volume and revaluation accounts, data are mandatory only from reference year 2012 and in non-consolidated form for main sectors and financial instruments. Counterpart information is voluntary.
The exact list of data requested in terms of sectors, sub-sectors and financial instruments is provided in the ESA 2010 Transmission Programme.
Additional data may be transmitted by countries on voluntary basis, according to the Data Gap Initiative 2 recommendations.
3.4. Statistical concepts and definitions
The concepts, definitions and classifications are based on the European System of Accounts (ESA 2010) (see annex below).
Financial transactions take place between resident institutional units, and between them and the rest of the world. They are recorded in the financial account, which shows how the surplus or deficit of the capital account is financed by transactions in financial assets and liabilities.
The financial account indicates how net borrowing sectors obtain resources by incurring liabilities or reducing assets, and how net lending sectors allocate their surpluses by acquiring assets or reducing liabilities. The financial account also shows the contributions to these transactions of the various types of financial assets, and the role of financial intermediaries. Most transactions involving the transfer of ownership of goods or assets or the provision of services have some counterpart entry in the financial account. Moreover, many transactions are recorded entirely within the financial account, where one financial asset is exchanged for another or a liability is repaid with an asset. Financial assets may also be created through the incurrence of liabilities. Such transactions change the distribution of the portfolio of financial assets and liabilities and may change their total amounts but do not affect the net lending / net borrowing (B.9).
Balance sheets are statements of the value of the stocks of assets and liabilities at a particular point of time. They can be drawn up for institutional units, institutional sectors and the whole economy. The balancing item of the financial balance sheet (i.e., excluding non-financial assets) is the 'net financial assets' (BF.90). The net financial asset is calculated as the difference between total financial assets and total liabilities. A closing financial balance sheet is equal to the opening balance sheet plus changes resulting from financial transactions and other flows (revaluations and other changes in volume of financial assets/liabilities).
Other changes in assets record changes that are not the result of transactions. They are either a) Other changes in the volume of assets and liabilities, or b) holding gains and losses. Other changes in volume include the normal appearance and disappearance of assets other than by transactions, changes in assets and liabilities due to exceptional or unanticipated events, which are not economic in nature, and changes in classification and structure. Holding gains and losses are recorded in the revaluation account, and occur when there are changes in the prices of assets or liabilities over time, without transforming them in any way.
Financial assets and liabilities: Definitions of the categories and sub-categories are provided in ESA 2010 chapter 5.
Time of recording: In principle, flows are recorded on an accrual basis, i.e. accumulated over time. Thus, economic value is created, transformed or extinguished, or when claims and obligations arise, are transformed or are cancelled; the time of recording is often not when cash is exchanged. See ESA 2010.
Valuation rules: In principle, financial flows and stocks are recorded at exchange or market value. For detailed valuation rules that apply to some categories of financial instruments, see ESA 2010.
Consolidation: Consolidation refers to the elimination of reciprocal flows or stock positions in financial assets and liabilities between units when the latter are grouped. See ESA 2010.
3.5. Statistical unit
The main statistical units are the Institutional units, as defined in ESA 2010, Chapter 2, § 2.12-2.13. This can refer to, for example, a corporation, a household or a government agency.
3.6. Statistical population
The national accounts population of a country consists of all resident statistical units. A unit is a resident unit of a country when it has a centre of predominant economic interest on the economic territory of that country, that is, when it engages for an extended period (one year or more) in economic activities on this territory.
National accounts are exhaustive. This means that all resident statistical units are covered.
The population of the countries' national accounts data as published by Eurostat includes, in principle, all resident statistical units. The population of the euro area and EU aggregates includes, in principle, all statistical units resident in the euro area respectively the EU. However, deviations might occur where the population in the received country data does not include all resident units. In addition, contrary to non-financial and financial accounts by institutional sector, the data for the quarterly and annual main aggregates of the euro area and the EU do not include the euro area respectively the EU international organisations.
Thus, the target population consists of the sectors of the national economy, including its relations with the rest of the world.
For description of the covered sectors, please see section 3.2.
3.7. Reference area
Eurostat collects and disseminated data on the European Union and Euro Area (including aggregates, where completeness of country data is sufficient), EU Member States, three EFTA Member States (Iceland, Norway, Switzerland) and enlargement countries whenever available (Türkiye, Montenegro, North Macedonia, Albania and Serbia).
3.8. Coverage - Time
According to the European System of Accounts (ESA 2010) (see annex below), EU countries should transmit data from 1995 onwards.
The length of the series may vary according from one country to another.
3.9. Base period
Not applicable.
Data are provided in Euro/ECU, national currency, and as % of GDP. Balance sheet data are also presented in terms of percentage change over previous year. For flow data, annual average exchange rates are used. For balance sheet data, end year exchange rates are used.
National currency series (NAC) (including fixed euro series for euro area Member States) are transmitted by Member States and correspond in principle to nationally published figures. They are suitable for studying the development of a variable in a single country over time.
Euro series (EUR) are derived from transmitted national currency series using historic exchange rates. They are suitable for internal comparison and aggregation. When comparing them over time, account must be taken of exchange rate effects.
The reference period is the calendar year.
6.1. Institutional Mandate - legal acts and other agreements
National accounts are compiled in accordance with the European accounting framework the European System of Accounts (ESA 2010), and are transmitted by the concerned countries in line with the following regulations.
ESA 2010 is defined in Annex B of Regulation (EU) No 549/2013 of the European Parliament and of the Council of 21 May 2013 and EU regulation 2023/734 amending the European system of regional and national accounts (ESA 2010).
6.2. Institutional Mandate - data sharing
Data received via the ESA2010 transmission programme are shared with other international institutions in accordance with specific agreements, notably with the ECB and the OECD.
Data sharing with ECB is governed by a service level agreement signed between Eurostat and ECB in October 2020.
A Protocol for co-operation between Eurostat and the OECD in the area of National Accounts signed in 2024 specifies agreed data exchange and data validation arrangements.
7.1. Confidentiality - policy
Regulation (EC) No 223 on European statistics (Article 20(4) of 26 December 2024 (02009R0223, p. 23)), stipulates the need to establish common principles and guidelines ensuring the confidentiality of data used for the production of European statistics and the access to those confidential data with due account for technical developments and the requirements of users in a democratic society.
7.2. Confidentiality - data treatment
Confidential data are only disseminated when they are combined with other data, in a form that ensures that statistical units cannot be (directly or indirectly) identified. If a Member State has declared data confidential in line with national legislation or practice, such data are transmitted to Eurostat marked with a special confidentiality flag.
Similarly, some data may be transmitted by Member State to Eurostat before the publication, and are then put under embargo.
Data flagged as confidential by the data compilers or with an embargo date is not disseminated, until the confidentiality flag is lifted in a subsequent data transmission or the embargo date is expired.
8.1. Release calendar
For EU countries, the official deadlines for submitting data under the European System of Accounts (ESA 2010) transmission programme, as amended by EU regulation 2023/734, are T + 4 and T + 9 months. This means that countries must submit their data twice per year, within 4 months and within 9 months after the reference period.
Once the data of a country is checked and validated by Eurostat, it is released on the public web site. All data of EU Member States should be validated and published by the third week of October.
8.2. Release calendar access
Not applicable.
8.3. Release policy - user access
In line with the Community legal framework and the European Statistics Code of Practice Eurostat disseminates European statistics on Eurostat's website (see item 10 - 'Accessibility and clarity') respecting professional independence and in an objective, professional and transparent manner in which all users are treated equitably. The detailed arrangements are governed by the Eurostat protocol on impartial access to Eurostat data for users.
Data are disseminated twice per year. More frequent updates may occur when countries submit the dataset more often.
10.1. Dissemination format - News release
There are no specific news releases relating to annual financial accounts.
10.2. Dissemination format - Publications
Series may appear in various Eurostat publications.
The latest Statistics Explained articles are available here:
Documentation on sources and methods is available from national statistical offices, national central banks, and Eurostat.
10.7. Quality management - documentation
Not available.
11.1. Quality assurance
Quality is assured by application of the European System of Accounts (ESA 2010) concepts and by a validation process on the data delivered by countries.
11.2. Quality management - assessment
The European System of Accounts (ESA 2010) data transmissions are subject to regular quality assessment reviews. Article 4 of Regulation (EU) No 549/2013 (ESA 2010 Regulation) specifies that the data covered by that Regulation is subject to the quality criteria, namely relevance, accuracy, timeliness and punctuality, accessibility and clarity, comparability and coherence, as set out in Article 12(1) of Regulation (EC) No 223 of 26 December 2024 (02009R0223, p. 10) of the European Parliament and of the Council.
Member States are to provide the Commission with a report on the quality of the transmitted data on national and regional accounts. The modalities, structure, periodicity and assessment indicators of the quality reports on data transmitted have been specified in a Commission Implementing Regulation 2016/2304 of 19 December 2016.
The implementation of the quality reporting and assessment exercise started in 2017 and is carried out annually. As part of the annual exercise, Eurostat assesses the results, prepares and publishes an overall assessment based on the national quality reports and other available information. The Commission also, on a 5 year basis, reports to the European Parliament and the Council on the application of the ESA 2010 Regulation, including the quality of data on national and regional accounts. The first of such reports was published in 2018: REPORT FROM THE COMMISSION TO THE EUROPEAN PARLIAMENT AND THE COUNCIL on the application of Regulation (EU) No 549/2013.
12.1. Relevance - User Needs
The Macroeconomic Imbalance Procedure (MIP) is a surveillance mechanism that aims to identify potential macroeconomic risks early on, prevent the emergence of harmful macroeconomic imbalances and correct the imbalances that are already in place. It is therefore a system for monitoring economic policies and detecting potential harm to the proper functioning of the economy of a Member State, of the Economic and Monetary Union, and of the European Union as a whole. This procedure lies on the computation of MIP indicators, which are aggregates of financial accounts’ data.
The Scoreboard for the surveillance of macroeconomic imbalances includes thirteen headline indicators for the identification and monitoring of external and internal macroeconomic imbalances as well as employment and social developments in order to gain a broader understanding of the social consequences of macroeconomic imbalance.
The MIP Scoreboard indicators cover:
External imbalances and competitiveness:They may arise from the evolution of the current account and the net investment positions of Member States, the real effective exchange rates, share of world exports and nominal unit labour cost;
Internal imbalances: These are imbalances that may arise from public and private indebtedness; financial and asset market developments, including housing and private sector credit flow, unemployment rate;
Employment indicators: These are activity rate, long-term and youth unemployment rates.
In addition, the economic reading of the MIP Scoreboard takes into account 23 complementary auxiliary indicators. They allow a better understanding of the risks and and help fine-tuning the policy recommendations that fall under the scope of the MIP.
The main indicators for Financial accounts are the following:
Private sector debt
The private sector debt is the stock of liabilities (at the end of the year) held by the sectors Non-financial corporations (S.11) and Households and Non-profit institutions serving households (S.14_S.15) combined. The instruments taken into account to compile the household sector debt, the non-financial corporations sector debt, and the private sector debt, are Debt securities (F.3) and Loans (F.4). Data are expressed as percentage of GDP and presented in consolidated terms, i.e. they do not take into account transactions within the same sector.
The MIP scoreboard indicators are:
Household debt (including NPISH), as a percentage of GDP
Non-financial corporations debt, as a percentage of GDP
The calculation formulas are:
[ HHDt / GDPt ] * 100 ; and
[ NFCDt / GDPt ] * 100.
The indicative thresholds are 55% and 85% respectively.
The considered institutional sectors are Non-Financial corporations (S.11) and Households and Non-Profit institutions serving households (S.14_S.15), as defined in section 3.3. The instruments taken into account are Debt securities (F.3) (these are negotiable financial instruments serving as evidence of debt) and Loans (F.4) - loans are created when creditors lend funds to debtors. Foreign direct investments (which is excluded from the non-financial corporations debt in one additional published indicator) are taken from from the (annualised) quarterly financial accounts dataset transmitted to the ECB.
Private sector credit flow
The Private sector credit flow represents the net amount of liabilities (debt securities (F.3) and loans (F.4)) which the sectors Non-Financial corporations (S.11) and Households and Non-Profit institutions serving households (S.14_S.15) combined have incurred through the year.
The MIP scoreboard indicators are:
Household (incl. NPISH) credit flow, as a percentage of the debt stock (t-1).
Non-financial corporations credit flow (excl. FDI), as a percentage of the debt stock (t-1, excl. FDI)
The indicative thresholds are 14% and 13% respectively.
The considered institutional sectors are Non-Financial corporations (S.11) and Households and Non-Profit institutions serving households (S.14_S.15), as defined in section 3.3. The instruments taken into account are Debt securities (F.3) - negotiable financial instruments serving as evidence of debt, and Loans (F.4) - loans are created when creditors lend funds to debtors. FDI are taken from the (annualised) quarterly financial accounts dataset transmitted to the ECB.
12.2. Relevance - User Satisfaction
Views and opinions of users of national accounts statistics can be collected and analysed as one of the tools to 'measure' the relevance of national accounts data.
12.3. Completeness
The dataset is complete with some exceptions. Any data flagged “not applicable” are shown as missing. Derogation exists for Switzerland (CH). Any other missing data is due to non-compliance issues.
13.1. Accuracy - overall
Eurostat checks internal consistency of the data, performs revision analysis and checks the presence of major events. Please see section 15.4 for further information.
13.2. Sampling error
Not applicable.
13.3. Non-sampling error
Not applicable.
14.1. Timeliness
For EU countries, the official deadlines for submitting data under the European System of Accounts (ESA 2010) transmission programme, as amended by EU regulation 2023/734, are T + 4 and T + 9 months. This means that countries must submit their data twice per year, within 4 months and within 9 months after the reference period.
The data should be transmitted to Eurostat no later than the day they are published by the national authority.
14.2. Punctuality
Countries generally meet the data transmission deadlines.
Wherever series are not comparable, data breaks are appropriately flagged in the Eurostat database.
15.3. Coherence - cross domain
Annual financial accounts are regularly checked against other tables of the ESA 2010, namely non-financial sector accounts (Table 8, vertical discrepancies by sector in net lending/net borrowing) and quarterly financial accounts of general government (Table 27).
Regular checks are also performed once a year against the quarterly financial accounts provided by the ECB.
15.4. Coherence - internal
Arithmetical consistency and other checks are made by Eurostat on each country's dataset. The EU and euro area aggregates are fully consistent with the country data, as these aggregates are automatically updated as soon as data for a country are revised.
Consistency checks on the data include the following:
Sector consistency
S.1 consolidation
Instrument balance
Instrument consolidation
Instrument consistency
S.2 consistency
Balance consistency
Market equilibrium
Stock variation
Non-plausible negative values
Flags consistency check
Revisions check
Counterpart consistency
False non-applicable / non-compiled values
Zero values
Eurostat does not validate and disseminate annual financial accounts data that shows internal discrepancies.
To further specify the general Eurostat revision policy, for annual financial accounts, National Statistical Offices and National Central Banks agreed to gradually implement the Harmonised European Revision Policy for Macroeconomic Statistics in national accounts and balance of payments statistics. This policy includes differentiated guidelines regarding the timing and depth of revisions of quarterly and annual data. It aims to improve adherence to the twofold principle of alignment between statistical domains at national level and coordinated alignment across countries at EU level. The policy provides guidelines for both 'routine' revisions and 'major' or 'benchmark' revisions.
National data are revised according to national schedules and policy of revisions. Annual financial accounts data are subject to routine revisions as new input data becomes available. Whenever new data are provided and validated, the already disseminated data are updated. Data are rarely flagged as provisional but may be subject to revision, as new input data become available. Improvements in sources and methods may also be implemented and might not be widely announced. Major changes in methodology are the result of legislation, and therefore announced in the Official Journal of the European Union.
18.1. Source data
Figures are collected and transmitted to Eurostat by the National Statistical Institutes of the EU Member States following ESA2010 transmission programme.
Information may be derived directly from the units of the institutional sector for which they are needed, or else indirectly from counterpart information on other sectors. The compilation relies on a variety of data sources, including administrative data, censuses, and statistical surveys of businesses and households. No single type of source data can be pointed out. In many cases, financial intermediaries or institutions are the counterpart, acting as debtor or creditor.
Information in which the financial sector is not involved normally has to be obtained directly. However, in some cases (particularly in the households and non-profit institutions serving households sectors) there is a lack of direct or counterpart information and estimates have to be made. Residual methods (residuals may be obtained after the recording of other items in the accounting framework) may be used for calculating such estimates.
In general, the most important sources used to compile national annual financial accounts are statistics on financial intermediaries, particularly monthly money and banking statistics, and quarterly data provided by other financial institutions. Other main sources are balance of payments and international investment position statistics, government finance statistics and securities data of government debt management bodies, capital market statistics, direct information on non-financial corporations, and surveys of businesses or households. Although source data may come from surveys, the compilation of financial accounts is intended to be exhaustive.
For the aggregation purposes (the euro area and EU aggregates), missing data concerning specific countries, transactions and sectors may be estimated by Eurostat, but such estimates are not published separately.
18.2. Frequency of data collection
Annual data twice per year. In some cases countries transmit the data to Eurostat more frequently, for example quarterly.
18.3. Data collection
ESA 2010 data are transmitted to Eurostat based on SDMX, with a standardised coding system and dataset identifiers.
National Accounts combine data from many source statistics, primarily transmitted from national authorities. Techniques of data collection vary widely, depending on the compilation approach, the source statistics available, the particular account in the system of accounts, the timeliness of data release and other factors.
18.4. Data validation
Eurostat regularly checks received data for accuracy, completeness and coherence. The validation process consists of arithmetic consistency and other quality checks.
For more information on accuracy of data, please see sections 13, 14 and 15.
18.5. Data compilation
Compilation of European aggregates: national data are converted if necessary into euro, or ECU (before 1999), and then summed. Intra-EU and intra-euro area asset and liability positions are not eliminated. The EU and euro area aggregates are published for a particular variable and year only when data for all the countries in the geographical entity are available.
Consolidation of S.1 (total economy): countries are expected to fully consolidate the data, in other words, all flows and positions between sectors of the economy should be eliminated, leaving only flows and positions with S.2 (rest of the world). All Member States have calculated the consolidated data for S.1.
18.6. Adjustment
Not applicable.
Specific country metadata for Annual Financial Accounts are available in the Excel file.
Financial flows and stocks data are often referred to collectively in the national accounts framework as ‘financial accounts’. Financial flows consist of transactions and other flows, and represent the difference between the opening financial balance sheet at the start of the year and the closing balance sheet at the end of the year. These terms are described in further detail in section 3.4.
Financial flows and stocks contain statistical information based on the European System of Accounts (ESA 2010) (see annex below), which came into force in September 2014. The data are compiled with reference to:
Financial balance sheets (nasa_10_f_bs)
Financial transactions (nasa_10_f_tr)
Revaluation accounts (nasa_10_f_gl)
Other changes in volume (nasa_10_f_oc)
Financial accounts: counterpart information (nasa_10_f_cp)
The financial assets held and the liabilities outstanding at a particular point in time are recorded in the balance sheet. Financial transactions result in changes between opening and closing balance sheets. However, changes between the opening balance sheet and the closing balance sheet are also due to other flows, which are not interactions between institutional units by mutual agreement. Other flows related to financial assets and liabilities are broken down into revaluations in financial assets and liabilities, and changes in the volume of financial assets and liabilities not due to financial transactions. Revaluations are recorded in the revaluation account and changes in volume in the other changes in the volume of assets account.
For more information, see also:
The dedicated website for Financial accounts and Sector accounts
The concepts, definitions and classifications are based on the European System of Accounts (ESA 2010) (see annex below).
Financial transactions take place between resident institutional units, and between them and the rest of the world. They are recorded in the financial account, which shows how the surplus or deficit of the capital account is financed by transactions in financial assets and liabilities.
The financial account indicates how net borrowing sectors obtain resources by incurring liabilities or reducing assets, and how net lending sectors allocate their surpluses by acquiring assets or reducing liabilities. The financial account also shows the contributions to these transactions of the various types of financial assets, and the role of financial intermediaries. Most transactions involving the transfer of ownership of goods or assets or the provision of services have some counterpart entry in the financial account. Moreover, many transactions are recorded entirely within the financial account, where one financial asset is exchanged for another or a liability is repaid with an asset. Financial assets may also be created through the incurrence of liabilities. Such transactions change the distribution of the portfolio of financial assets and liabilities and may change their total amounts but do not affect the net lending / net borrowing (B.9).
Balance sheets are statements of the value of the stocks of assets and liabilities at a particular point of time. They can be drawn up for institutional units, institutional sectors and the whole economy. The balancing item of the financial balance sheet (i.e., excluding non-financial assets) is the 'net financial assets' (BF.90). The net financial asset is calculated as the difference between total financial assets and total liabilities. A closing financial balance sheet is equal to the opening balance sheet plus changes resulting from financial transactions and other flows (revaluations and other changes in volume of financial assets/liabilities).
Other changes in assets record changes that are not the result of transactions. They are either a) Other changes in the volume of assets and liabilities, or b) holding gains and losses. Other changes in volume include the normal appearance and disappearance of assets other than by transactions, changes in assets and liabilities due to exceptional or unanticipated events, which are not economic in nature, and changes in classification and structure. Holding gains and losses are recorded in the revaluation account, and occur when there are changes in the prices of assets or liabilities over time, without transforming them in any way.
Financial assets and liabilities: Definitions of the categories and sub-categories are provided in ESA 2010 chapter 5.
Time of recording: In principle, flows are recorded on an accrual basis, i.e. accumulated over time. Thus, economic value is created, transformed or extinguished, or when claims and obligations arise, are transformed or are cancelled; the time of recording is often not when cash is exchanged. See ESA 2010.
Valuation rules: In principle, financial flows and stocks are recorded at exchange or market value. For detailed valuation rules that apply to some categories of financial instruments, see ESA 2010.
Consolidation: Consolidation refers to the elimination of reciprocal flows or stock positions in financial assets and liabilities between units when the latter are grouped. See ESA 2010.
The main statistical units are the Institutional units, as defined in ESA 2010, Chapter 2, § 2.12-2.13. This can refer to, for example, a corporation, a household or a government agency.
The national accounts population of a country consists of all resident statistical units. A unit is a resident unit of a country when it has a centre of predominant economic interest on the economic territory of that country, that is, when it engages for an extended period (one year or more) in economic activities on this territory.
National accounts are exhaustive. This means that all resident statistical units are covered.
The population of the countries' national accounts data as published by Eurostat includes, in principle, all resident statistical units. The population of the euro area and EU aggregates includes, in principle, all statistical units resident in the euro area respectively the EU. However, deviations might occur where the population in the received country data does not include all resident units. In addition, contrary to non-financial and financial accounts by institutional sector, the data for the quarterly and annual main aggregates of the euro area and the EU do not include the euro area respectively the EU international organisations.
Thus, the target population consists of the sectors of the national economy, including its relations with the rest of the world.
For description of the covered sectors, please see section 3.2.
Eurostat collects and disseminated data on the European Union and Euro Area (including aggregates, where completeness of country data is sufficient), EU Member States, three EFTA Member States (Iceland, Norway, Switzerland) and enlargement countries whenever available (Türkiye, Montenegro, North Macedonia, Albania and Serbia).
The reference period is the calendar year.
Eurostat checks internal consistency of the data, performs revision analysis and checks the presence of major events. Please see section 15.4 for further information.
Data are provided in Euro/ECU, national currency, and as % of GDP. Balance sheet data are also presented in terms of percentage change over previous year. For flow data, annual average exchange rates are used. For balance sheet data, end year exchange rates are used.
National currency series (NAC) (including fixed euro series for euro area Member States) are transmitted by Member States and correspond in principle to nationally published figures. They are suitable for studying the development of a variable in a single country over time.
Euro series (EUR) are derived from transmitted national currency series using historic exchange rates. They are suitable for internal comparison and aggregation. When comparing them over time, account must be taken of exchange rate effects.
Compilation of European aggregates: national data are converted if necessary into euro, or ECU (before 1999), and then summed. Intra-EU and intra-euro area asset and liability positions are not eliminated. The EU and euro area aggregates are published for a particular variable and year only when data for all the countries in the geographical entity are available.
Consolidation of S.1 (total economy): countries are expected to fully consolidate the data, in other words, all flows and positions between sectors of the economy should be eliminated, leaving only flows and positions with S.2 (rest of the world). All Member States have calculated the consolidated data for S.1.
Figures are collected and transmitted to Eurostat by the National Statistical Institutes of the EU Member States following ESA2010 transmission programme.
Information may be derived directly from the units of the institutional sector for which they are needed, or else indirectly from counterpart information on other sectors. The compilation relies on a variety of data sources, including administrative data, censuses, and statistical surveys of businesses and households. No single type of source data can be pointed out. In many cases, financial intermediaries or institutions are the counterpart, acting as debtor or creditor.
Information in which the financial sector is not involved normally has to be obtained directly. However, in some cases (particularly in the households and non-profit institutions serving households sectors) there is a lack of direct or counterpart information and estimates have to be made. Residual methods (residuals may be obtained after the recording of other items in the accounting framework) may be used for calculating such estimates.
In general, the most important sources used to compile national annual financial accounts are statistics on financial intermediaries, particularly monthly money and banking statistics, and quarterly data provided by other financial institutions. Other main sources are balance of payments and international investment position statistics, government finance statistics and securities data of government debt management bodies, capital market statistics, direct information on non-financial corporations, and surveys of businesses or households. Although source data may come from surveys, the compilation of financial accounts is intended to be exhaustive.
For the aggregation purposes (the euro area and EU aggregates), missing data concerning specific countries, transactions and sectors may be estimated by Eurostat, but such estimates are not published separately.
Data are disseminated twice per year. More frequent updates may occur when countries submit the dataset more often.
For EU countries, the official deadlines for submitting data under the European System of Accounts (ESA 2010) transmission programme, as amended by EU regulation 2023/734, are T + 4 and T + 9 months. This means that countries must submit their data twice per year, within 4 months and within 9 months after the reference period.
The data should be transmitted to Eurostat no later than the day they are published by the national authority.