Reference metadata describe statistical concepts and methodologies used for the collection and generation of data. They provide information on data quality and, since they are strongly content-oriented, assist users in interpreting the data. Reference metadata, unlike structural metadata, can be decoupled from the data.
The quarterly Labour Cost Index (LCI) is a Euro Indicator which measures the cost pressure arising from the production factor "labour". The data covered in the LCI collection relate to total average hourly labour costs and to the labour cost categories "wages and salaries" and "employers' social security contributions plus taxes paid minus subsidies received by the employer". Data are available for the EU aggregates and EU Member States broken down by economic activities defined in sections B to S of the Statistical classification of economic activities in the European Communities (NACE Rev 2); in unadjusted, working day and seasonally adjusted form. The data on the LCI are given in the form of index numbers (current reference year: 2020) and of annual and quarterly growth rates (comparison with the previous quarter, or the same quarter of the previous year). The LCI shows the short-term development of the labour cost, the total cost on an hourly basis of employing labour. In other words, the LCI measures the cost pressure arising from the production factor “labour”.
2.2. Classification system
Indexation stage determine the classification level used in the collection and processing of the data. The sample used in the collection of basic data is stratified according to the main industry group, which specification may be the basis for the basic series of the chain-linked index as well. Data suppliers are requested to specify the basic data for the key industries by industry unit. In practice, the specification of costs by industry is actually made only in a few enterprises. The revised Standard Industrial Classification NACE Rev. 2 was introduced in the printouts of the labour cost index (2008=100) at the beginning of 2009. At the same time, the index based on empirical data for the years 2007 and 2008 was released in accordance with the new classification. The indices of the previous base year (2003 = 100) are published only according to the old Standard Industrial Classification (NACE Rev. 1.1). Standard Industrial Classification TOL 2008:
B Mining and quarrying;
C Manufacturing;
D Electricity, gas, steam and air conditioning supply;
E Water supply; sewerage, waste management and remediation activities;
F Construction;
G Wholesale and retail trade; repair of motor vehicles and motorcycles;
H Transportation and storage;
I Accommodation and food service activities;
J Information and communication;
K Financial and insurance activities;
L Real estate activities;
M Professional, scientific and technical activities;
N Administrative and support service activities;
O Public administration and defence; compulsory social security;
P Education;
Q Human health and social work activities;
R Arts, entertainment and recreation;
S Other service activities.
By definition, labour costs refer to total costs incurred by employers in the employment of employees. Labour cost items and the total number of paid personnel are defined in Commission Regulation No 1737/2005 concerning implementation of statistics on labour costs. The cost concept used in the labour cost index covers compensations of employees (D1). When describing the cost development a more general classification level may well be used and focus can be put on the key cost concepts. Thus the costs of vocational education (D2), employer’s other costs (D3), and subsidies received by the employer (D5) can be excluded from the quarterly cost description (they are included in the description area of the labour cost survey). The cost item taxes (D4) is not relevant in Finland. Around 1.6 per cent of labour costs remain outside quarterly cost monitoring.
2.3. Coverage - sector
The Index covers both the private and public sector. The base data for the enterprise sector is captured by a sample survey using the business register as the sample frame.
In the local government sector, data were collected in 2008 to 2010 in municipalities in the Helsinki region and from 2011 onwards from the biggest municipalities with over 50,000 population and from the largest joint municipal authorities. In 2012, the data collection was expanded to cover municipalities with over 5,000 inhabitants. Data on joint municipal authorities have been collected from all joint municipal authorities in education, health care and social work employing more than 800 persons since 2012. Yearlier local government sector data was based on the change of costs in the national index of earnings and the data was covered also years 2000-2007. Now the data covers only the years from 2008 on, because the earlier series covers only public administarion and defence; compulsory social security (O), education (P) and human health and and social work activites (Q). As of the beginning of 2023, the quarterly data collection applies to all municipalities with a population of over 50,000, a sample of municipalities with fewer than 50,000 inhabitants, as well as the largest education consortia and joint parishes. The data collection also includes all wellbeing services counties and joint county authorities for wellbeing services.
The central government sector was added to the base data from 2008, by the delivery of 2/2012.
The Index covers all private sector enterprises with at least 20/30 employees. In construction (F), wholesale and retail trade (G), accommodation and food service activities (H), real estate activities (I), professional, scientific and technical activities (M), administrative and support service activities (N) all enterprises with at least 20 employees are covered. In all other industries a comparative threshold of 30 employees is applied.
The concepts and classifications of the labour cost index are defined in the Commission’s implementing Regulation. Labour costs describe all costs incurred by an employer from the employment of labour. Labour costs are usually presented as costs for an hour worked. Costs arising from work premises, commuting or untaxed daily allowances are not included in labour costs. Total labour costs are obtained by deducting employer's subsidies from the sum of labour cost items. Employer's subsidies are intended for full or partial financing of costs arising from direct compensations paid by the employer. Such subsidies comprise employment subsidies and training compensations paid to employers.
In the labour cost index, labour cost items are grouped as follows:
Remuneration exclusive of one-off pay components;
One-off pay components;
Social security costs.
In the labour cost survey, labour cost items are divided into the following main groups:
Direct earnings;
One-off pay components;
Remuneration for days off;
Contributions to personnel funds;
Costs of fringe benefits and company products;
Social security costs;
Training costs;
Other labour force costs.
Direct earnings refer to wages and salaries paid for hours worked in each pay period. Direct earnings comprise direct compensations paid on the basis of hours worked, output produced or amount of work performed, compensations for overtime, shift work and the like additional bonuses and compensations paid regularly in each pay period.
One-off pay components refer to items that are not paid regularly in each pay period. Such bonuses that are often paid only once a year include performance-based bonuses and holiday pay, and seniority increments paid in some hourly paid fields. Payment of one-off pay components can also be based on collectively bargained agreements.
Pay for days off refers to compensations paid for statutory, agreement-based or voluntarily granted leaves, national holidays or other paid days of leave. Typical items of this group are pay during annual holiday entitlement, monthly paid employees' pay during national holidays, hourly paid employees' compensation during national holidays and days of leave in compensation of shortened working hours. Payments to personnel funds refer to the sums enterprises may annually contribute to their employees' saving systems, such as personnel funds. Costs of fringe benefits and company products include all costs incurred by an employer from the goods and services it provides for to its employees. Such goods and services include e.g. company car and subsidised meals, incentive stock options and personnel's recreational and social activities.
Own personnel's pay is not included.
Social security costs refer to the sum employers pay for the social security benefits of its employees. Such statutory, agreement-based or voluntary payments include employment pension, social security and unemployment insurance contributions. Additionally, this group comprises as imputed social security funding items pay during illness and parental leave (net, i.e. less compensations paid to the employee by the Social Insurance Institution) and occupational health care costs (likewise, net), as well as compensations arising from the termination of an employment relationship.
Training costs include e.g. costs of professional training services, costs of course participations, fees of instructors hired from outside the enterprise and payments to organisations arranging training. By contrast, pay for the participants during training is not counted as training costs but as pay for hours worked. Other labour costs include e.g. costs arising from protective and working clothes and from the procurement of labour. Employer's taxes paid on the basis of the sum of wages and salaries or the employed labour force that the labour cost concept of the European Union contains do not exist in Finland. The concept of labour costs partly equals the national accounts concept of compensation of employees but exclusive of e.g. occupational health care, training and recruitment costs.
The description area of structural statistics concerning earnings and labour costs (structure of earnings statistics, labour cost survey) does not include small enterprises with under 10 wage and salary earners and of the industries agriculture, forestry and fishing, or public administration.
The target population of the labour cost index is both by its size category and industry more exhaustive than this. The target population of the index also covers small enterprises regardless of their size and of the industries, public administration. Of the industries thus only agriculture, forestry and fishing are left outside the theoretical population of the index.
The average unit costs per hour worked are known to vary somewhat depending on the size of the enterprise. Enterprises are skewed as to size, the presumed non-response rate is higher for small enterprises and large enterprises cover the majority of the wages and salaries sum. In the survey frame the representativeness of all size enterprises is meant to be ensured for the collected data. The survey frame for the private sector is therefore stratified by the number of wage and salary earners into five size categories.
2.6. Statistical population
Sample size 2563/Population size 9013 in the private sector.
Local government sector 372: municipalities (309), joint municipalities (39), wellbeing services counties (21) and joint county authorities for wellbeing services (3). In the sample 120 units: municipalities (87), joint municipalities (9), wellbeing services counties (21) and joint county authorities for wellbeing services (3) out of all 372.
There were 525 government offices in 2008 and in 2023 there was 184 active government offices, total data which is administrative data.
The national labour cost index is released quarterly around 70 days after the end of the quarter on Statistics Finland’s Internet pages. The national index also covers all industries. Data are released on the main industry sums, six main groups (C,F,G,H,J and K) and on four subindustries of manufacturing (food industry, forest industry, chemical industry and metal industry), as well as on the central and local government sectors’ industry sums. Eurostat publishes the labour cost index quarterly on its Internet pages. Unlike the national labour cost index, Eurostat publishes data by industry without sector division.
In Finland the cost development of hours worked was defined between 1996 and 2002 on the industry level by dividing the monthly earnings for total working hours of a full-time wage and salary earner, determined according to Statistics Finland’s index of wage and salary earnings and structure of earnings statistics, by the average labour input for a month. The number of working hours of full-time wage and salary earners was based on Statistics Finland’s employment statistics. Since 2003 the compilation of the index has been decreed by Regulation No 450/2003 of the European Parliament and of the Council and by related Commission Regulation No 1216/2003 on its implementation. In the first phase the regulation-based statistical obligation related only to manufacturing and private service sector industries. The industry coverage of the index was enlarged by the Commission’s new implementing Regulation No 224/2007 to concern from 2007 onwards the industries of so-called welfare services for which the public sector is mainly responsible.
The European Parliament yearly monitors the quality of the labour cost index on the basis of a report submitted by the Commission. The concepts and classifications of the labour cost index are defined in the Commission’s implementing Regulation.
2.7. Reference area
Finland nuts 1.
2.8. Coverage - Time
First quarter of 2007 until fourth quarter of 2023 in the private sector.
In the local government sector, data were collected in 2008 to 2010 in municipalities in the Helsinki region and from 2011 onwards from the biggest municipalities with over 50,000 population and from the largest joint municipal authorities. In 2012, the data collection was expanded to cover municipalities with over 5,000 inhabitants. Data on joint municipal authorities have been collected from all joint municipal authorities in education, health care and social work employing more than 800 persons since 2012. Yearlier local government sector data was based on the change of costs in the national index of earnings and the data was covered also years 2000-2007. Now the data covers only the years from 2008 on, because the earlier series covers only public administarion and defence; compulsory social security (O), education (P) and human health and and social work activites (Q). As of the beginning of 2023, the quarterly data collection applies to all municipalities with a population of over 50,000, a sample of municipalities with fewer than 50,000 inhabitants, as well as the largest education consortia and joint parishes.
The central government sector was added to the base data from 2008, by the delivery of 2/2012 The central government data has been added to the series for the first time by the delivery of 2/2012 data. The data concerns all central government employees of whole time and part time workers since 2008
2.9. Base period
The labour cost indices are chain-linked Laspeyres price indices which currently use the year 2020 as reference year.
3.1. Source data
Table 1. Size classes in the private sector frame:
20/30 - 50 employees
50 - 100 employees
100 - 250 employees
250 - 500 employees
Over 500 employees
The survey frame was formed on basis on Nace 2 rev. 1, which was then converted to the new Nace 2008 rev. 2.1. by key in the end of 2006. Sampling fractions were formed by two-way power-allocation. Also non-response was taken into account when forming sample fraction, which was known from the earlier inquires.
Geographically the calculation covers whole of the country. All enterprises which have 250 employees or less in the sample are within the survey at least two years of time. All enterprises which have more than 250 employees are almost always in the survey; only demographic changes may change the original sample fractions. In table 2 there is the numbers of enteprises that had been addeed to the sample and numer of enterprise that have been released in each year. The reason why enterprises have been released from the survey is that som of the enterprises have fallen under the first size class (under 20 employees). The other reason is that enterprises have gone out of business. Thirdly some enterprises have been released because they have been in the survey from 2007 on and have been replaced.
The reason why enterprises have been released from the survey is that some of the enterprises have fallen under the first size class (under 20 employees). The other reason is that enterprises have gone out of business. Thirdly some enterprises have been released because they have been in the survey from 2007 on and have been replaced. About 100-200 enterprises are changed in the sample each year.
Local governent sector: In the sample 120 units: municipalities (87), joint municipalities (9), wellbeing services counties (21) and joint county authorities for wellbeing services (3) out of all 357. Sample covers all biggest (over 50 000 inhabitans) municipalities and simple random sampling in 5 000 - 49 999 inhabitans municipalities.
Central govenment sector total data, Government offices and istitutions (525 government offices in 2008 and 184 active government offices in 2023).
3.2. Frequency of data collection
Quarterly (In year 2007 direct survey replaced the earlier production model which was based on existing data sources in the private sector.)
From 2007 the base data have been captured by web-inquiries from the selected sample. For sections with hourly-paid employees (like manufacturing) the data are collected separately for hourly and monthly-paid employees. For sections with only monthly-paid employees the data are captured for all employees with specification of part-time employees.
3.3. Data collection
Private and local government sector: computer assisted (CAWI with interactive online questionnaire) = web questionary.
Central government data (administrative data): State Treasury collects the data from the finacial administration and delivers the data to Statistics Finland.
3.4. Data validation
Preliminary control of data From 2007 the enterprises selected to the sample provide data on different quarters through an Internet application. For this process written replying instructions are supplied to the enterprises. Basic data concerning the enterprise are pre-filled on the form, but respondents can also update them.
Database controls
The aim of the controls made in the database is to ensure that the basic data on labour costs per hour worked/paid reported by data suppliers are truthful and to indicate probably untruthful values for further actions. When the data collection for an individual enterprise starts, the logicality and level of key basic data (number of wage and salary earners, number of hours worked, wages and salaries sum) are ensured. Controls on enterprises having previously answered to the inquiry are based on the quarterly change in data concerning each enterprise. On data entered in the database controlled are for example:
Quarterly change in unit cost calculated per hour worked/paid,
Change in the definition basis of hours,
Summation of hourly-paid employees’ pay specification, and
Change in the tariff of social insurance contributions.
For hourly-paid employees the data of labour input are always bound to concern actually hours worked. For monthly-paid employees the data on labour input may - based on respondent’s choice - be supplied either as hours worked or as hours paid. For all respondents the data supplied are completed by regression imputation.
Non-response treatment Total non-response: An enterprise is considered as responded, when it has answered number of hours and remuneration under withholding tax. All other situations are interpreted as non-response. If an enterprise is not responding to the survey, it is taken into account in the estimation as non-responded enterprise.
Partial non-response: In spite of the fact that we have determined four key questions as compulsory in the survey (number of paid employees at the end of the reference period, number of hours, remuneration under withholding tax, the percentage tariff of social security contributions of remuneration), some enterprises may still leave some of the items unanswered. If the number of paid employees at the end of the reference period is not responded, it is not imputed. Number of paid employments is still important item in the model for imputing hours worked and hours paid.
If the remuneration under withholding tax is not responded, usually the respondents are asked to reply this during each quarters inquire. If no reply is achieved, then the respondent is interpreted as total nonresponse. If the percentage tariff of social security contributions of remuneration is left unanswered, we use the mean of Nace section percentage of all responded enterprises. This is done in every quarter.
Imputation of missing worked and paid hours: With a few exceptions, data suppliers can report the labour input of hourly-paid employees in hours worked. In contrast, over one half of the labour input of monthly-paid employees is given as paid hours – not worked. The imputation application concerning the number of working hours ensures that in addition to the data on empirical hours (hours worked vs. paid), data defined with the regression model on the number of both hours worked and paid hours are always available for each data supplier. The preconditions for respondents to reply hours worked or hours paid vary significantly and the quality of the data is difficult to control. The concept applied depends on respondents preconditions. For hourly paid employees responses are always hours worked based on payroll data. For monthly-paid employees responds according to employees choice. In order to complete the missing data we use imputation model: hours worked to enterprises with empirical data onhours paid, andhours paid to enterprises with empirical data on hours worked.
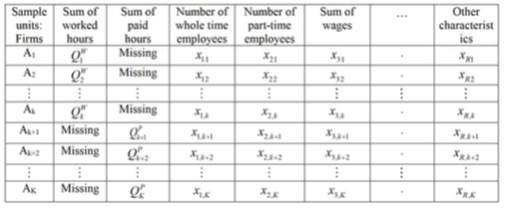
The following table describes the Finnish LCI – sample for the monthly paid employees. About one half of the firms respond ‘the sum of worked hours’ and another half ‘the sum of paid hours’. The problem is: At least the missing observations for ‘the sum of worked hours’ should somehow be estimated.
Table 2.
Imputation of missing information is done by four steps:
Step 1: The regression of the paid or worked hours on the x –vector of characteristics. The aim of this step is to find adequately accurate model to describe the data generating process for paid and worked hours. The aim is to find a set of x-variables (explanatory or independent variables) that are strongly correlated with paid or worked hours (dependent variable). The functional form of the model is near to the ‘flexible form’ and it is specified as double logarithmic form (that is, all variables are measured as logarithmic scale).
Step 2: Using parameter estimates of the first step regression in imputation of missing observations for ‘paid hours’ or ‘worked hours’. This step is based on completely deterministic imputation. Imputation of missing paid hours is done by calculating linear combination between regression estimates and corresponding x –variables (conditional information set from the firms having missing paid hours) Imputation of missing worked hours is done by calculating linear combination between regression estimates and corresponding x –variables (conditional information set from the firms having missing worked hours).
Step 3: Calculate for each observation the ratio between the worked and imputed paid hours or between imputed worked and paid hours.
Ratio –estimates between worked hours and imputed paid hours (ratio –estimate = worked hours/imputed paid hours).
Ratio –estimates between imputed worked hours and paid hours. (ratio –estimate = imputed worked hours/ paid hours).
Step 4: Aggregate the estimated ratios by appropriate classification of the firms. Use these aggregated ratio–estimates in imputation of missing observations for worked or paid hours. Firstly we test the equality of the mean ratio –estimates by the ANOVA –model. If the hypothesis of the equality of the ratio –estimates is not rejected, then the aggregate ratio –estimate is selected and used in imputation of the missed observations.
3.5. Data compilation
Preliminary control of data, Database controls, Imputation of labour input data, Finalising the processing of the data, Compilation of the labour cost index.
In accordance with Eurostat’s Regulation,three series must be published on the labour cost index: A raw series, where labour costs are depicted as real, A series adjusted for working days, where attention is paid to the variation of working days, and A seasonally adjusted series, which takes account of seasonal adjustment, such as the regular effect of the payment time of one-off pay components.
Finland has delivered working day adjusted and seasonally adjusted series of the Labour Cost Index 2008 = 100 to Eurostat since the autumn of 2012 when the time series became long enough to model the variation in the number of working days and seasonal variation. Prior to this, the index was produced only as a so-called raw series. The index series of the municipal sector are not yet seasonally adjusted due to the fact that the series are short and the poor coverage of the sample during the initial years. In the series that are delivered to Eurostat the effect of the local government sector has been estimated based on the index of wage and salary earnings. The variation in the number of working days can be divided into two parts – the number of actual weekdays and Sundays. Similarly, public holidays may be fixed holidays, whose weekday varies, such as Christmas, or moving holidays, which change the quarter, such as Easter. For removing the effects of seasonal variation use is made of the TRAMO/SEATS method recommended by Eurostat. The method recommended by Eurostat improves the quality of seasonally adjusted data and international comparability.
JDemetra+ was introduced for the first time in 4/2015 delivery. Also indirect adjustment have been introduced when calculating SA and WD -series for total LCI-index. When comparing demetra and JDemetra+ data there was only slightly differences between the old demetra (we preferred the same models as earlier, but reduced the number of trading/working regressors). Also we tested direct and indirect adjustment influence on series and found out that only minor changes were found. Indirect adjustment was introduced as recommended.
Starting from the third quarter of 2019, Finland had changed the way to calculate seasonally adjusted and seasonally and working day adjusted series. Finland now sums all sectors data together (private, local government and government data) and then calculate seasonally adjusted and seasonally, working day adjusted series. Earlier Statistics Finland has calculated three different series (and calculated them separately) namely private sector, local government sector and central government sector series. These sector and industry-specific series was weighted together with costs weights.
4.1. Quality assurance
The aim is for example that the relative standard error of cost etimate for the whole sample could be 1 percent. The concepts and classifications of the labour cost index are defined in the Commission’s implementing Regulation. So for example In the labour cost survey the definitions is based on the same definitions as in the Labour cost Index.
4.2. Quality management - assessment
Response rate have been reasonably high (about 90 percent os from wages ands salaries). Also preliminary control of data and database controls and imputation metod compined with sample arrangement and keepin g sample fractions fixed is sufficient to produce quality in the labour costs index. Annual quality reports is deliverd to Eurostat and evaluated by Eurostat.
5.1. Relevance - User Needs
The main users of the index are Eurostat and European Central Bank. Also enterprises/firms uses combination of indexes such as Labour cost index and Producer price indices. The official index of wage and salary earningsis often better suited for price updates of delivery contracts cost index for delivery contracts than the current labour cost index. The seasonally adjusted and working-day adjusted index improves the suitability of the labour index for delivery contracts. Also the main groups of standard industrial classification (NACE 2008) is experinced too rough.
5.2. Relevance - User Satisfaction
Cost-type specific sub-indices published from the index enhance the possibilities to analyse the reasons for the cost change. Changes in cost factors are also examined in the annual publication of the statistics on wages and salaries and labour costs released every year. On the level of the national economy the labour cost index can be used when comparing the cost development calculated per hour worked with changes in productivity. As it covers the whole European Union, the index allows comparisons of Finland’s cost development with its rival countries. Seasonal adjustment of the index improves international comparability of cost changes. On the level of enterprises the labour cost index makes it possible to compare one’s cost development with enterprises in the same industry both in Finland and in the EU area. The official index of wage and salary earnings is often better suited for price updates of delivery contracts than the current labour cost index. The seasonally adjusted and working-day adjusted index improves the suitability of the labour cost index for delivery contracts. Due to the shortness of the time series and seasonal adjustment methods, seasonally adjusted time series may become revised quite much due to new observations. This should be considered when using the data.
5.3. Completeness
Statistics Finland has from 2007 implemented a new quarterly sample survey of labour costs in the enterprise sector. The empirical data covers remuneration, social security contributions and the labour input.
5.3.1. Data completeness - rate
The scope of the survey has from 2008 been enlarged to cover the central government sector. In the local government sector, data were collected from the year 2008 to 2010 from municipalities in the Helsinki region and from 2011 onwards from the biggest municipalities with over 50,000 population and from the largest joint municipal authorities. In 2012, the data collection was expanded to cover municipalities with over 5,000 inhabitants. Data on joint municipal authorities have been collected from all joint municipal authorities in education, health care and social work employing more than 800 persons since 2012. As of the beginning of 2023, the quarterly data collection applies to all municipalities with a population of over 50,000, a sample of municipalities with fewer than 50,000 inhabitants, as well as the largest education consortia and joint parishes. The data collection also includes all wellbeing services counties and joint county authorities for wellbeing services.
Earlier the local government sector data was based on the change of costs in the national index of earnings and the data covered also years 2000-2007 (the data was delivered until 1/2015). Now the data covers only the years from 2008 on, because of the change in the data source. The series that were sent earlier (until 1/2015) cover only public administarion and defence; compulsory social security (O), education (P) and human health and and social work activites (Q). The index has so far been supplied as a raw series, working-day and seasonally adjusted index series from september 2012. Each index is calculated separately (private, local and central government sectors and also NSA-,WDA- and SA-series in the same manner then scaled to 2012 = 100) and summed by cost weights. Starting from the first quarter of 2019 on we have summed all sectors together and calculated NSA-, WDA- and SA-series and scaled to 2020=100. Earlier Statistics Finland has calculated three different series (and calculated them separately) namely private sector, local government sector and central government sector series. These sector and industry-specific series was weighted together with costs weights.
6.1. Accuracy - overall
The basis used to calculate the Labour Cost Index are the results of the Labour Cost Survey. These data, which are collected every four years, are updated by means of quarterly data sources. When new data become available from the labour cost survey, a benchmarking exercise is performed for the years between two labour cost surveys.
6.2. Sampling error
See annex in 6.2.1.
6.2.1. Sampling error - indicators
Standard error is higest in the Nace section B, 3,68 and lowest in nace section O, 0,33. It is calculated from all sectors data (private, local and central government data)
Standard error is higest in the Nace section B, 3,68 and lowest in nace section O, 0,33. It is calculated from all sectors data (private, local and central government data).
6.3.1. Coverage error
There are six type of coverage errors identified:
Enterprices that can't answer because problems in payroll system;
Enterprise has fusioned to another enterprise;
Enterprise sizeclass have changed under 20/30 employees;
Enterprise has gone bankcrupt or gone out of business;
Enterprice is in the wrong Nace section;
Same enterprice in the sample (business ID change during the year).
All thes are minor erros and can taken care of sampling which is done yearly (in the beginnig of the year) when choosing new enterprises in the sample.
Since 2007 Statistics Finland introduced the new production model, which is based on direct survey from enterprises. The Labour Cost Index based on empirical base data has been supplied for the first quarter 2009. The data supplied combined the revised back data since first quarter of 2007. The second quarter of 2012 was the first time that was possible to supply not only raw series but working-day and seasonal adjusted series.
The indices for the years 2007 and 2008 have been aggregated by using weights from the year 2007. The indices for 2009 are comparatively based on weights referring year 2008 and the indices for 2010 are comparatively based on weights referring year 2009 and so on. Labour costs index data can be revisted by n-1 policy which means that current year and last yearsa data can be corrected. The reason is that enterprises really corrrect their data by that manner.
6.6. Data revision - practice
For private sector data we have always revised the original data for current and last year (n-1 rule). The reason for this is that enterprises still can correct the data one year before, because the have corrected their payroll -system or or they have found errors in them and calculated the data again. For centrral government sector the original data do not normally change and no revision is done/needeed. For local govermnment sector data the original data have been corrected longer period than n-1 rule, if errors have been found. We have now changed to revision policy that we do not change the earlier data from 3 quarter of 2019 on, so the same rule concerns also local government sector as private sector data.
6.6.1. Data revision - average size
See 6.5.
7.1. Timeliness
See 7.1.1-7.1.2.
7.1.1. Time lag - first result
According to the Commission Regulation (EC) No. 1216/2003 of 7 July 2003, Member States shall transmit the quarterly results of their LCI statistics to the Commission (Eurostat) no later than 70 days after the end of the reference period.
2023Q1: t + 70 days;
2023Q2: t + 70 days;
2023Q3: t + 70 days;
2023Q4: t + 70 days.
7.1.2. Time lag - final result
See above 7.1.1.
7.2. Punctuality
The punctuality is in general quite high, and delays in the submission of the Finnish LCI series to Eurostat are very rare. There was one delay in year 2023 submissions (See 7.2.1.).
7.2.1. Punctuality - delivery and publication
2023Q1: t + 70 days;
2023Q2: t + 70 days;
2023Q3: t + 70 days;
2023Q4: t + 73 days.
The same production model has been applied since 2007 in the private sector and local government sector. The central government sector is based on administrative data and have been added to series from second quarter of 2012. The local government sector has been added to series from 1/2015 and is now based on direct inguiry.
We have compared the wages and salaries sum of the whole economy and quarterly National accounts figures in industry (Nace sections B,C,D,E), and construction (Nace section F), and in trade, accommodation and food service activities, traffic and telecommunications (Nace sections G,H,I,J) and in finance, insurance and business services (nace sections K,L,M,N). This is done by Eurostat.
8.1. Comparability - geographical
Nuts 1, so no internal comparision is possible, only comparision in European level.
8.1.1. Asymmetry for mirror flow statistics - coefficient
Not available.
8.2. Comparability - over time
The same production model has been applied since 2007 in the private sector and local government sector. The central government sector is based on administrative data and have been added to series from second quarter of 2012.
8.2.1. Length of comparable time series
Starting from the first quarter of 2019, the wages and salaries sum of the labour cost index is based on the Incomes Register. When introducing the Income register data , it was not as reliable as earlier, because the enterprises have difficulties to use the register in time. When the data become steady it seems to be as good as earlier.
8.3. Coherence - cross domain
We have compared the wages and salaries sum of the whole economy and quarterly National accounts figures.
8.4. Coherence - sub annual and annual statistics
Not available.
8.5. Coherence - National Accounts
This is done by Eurostat.
8.6. Coherence - internal
This is done by Eurostat.
9.1. Dissemination format - News release
The Labour Cost Index is being published by Eurostat on Union web sides Nationally the index is published four times a year on Statistics Finland’s web side. The metadata of the index are supplied for Eurostat for being presented in web. Nationally the metadata is presented in the LCI web pages.
Nationally the index is published four times a year on Statistics Finland’s web side.
9.2. Dissemination format - Publications
See chapter 9.1.
9.3. Dissemination format - online database
Statistics Finland, Wages, Salaries and Labour Costs/ Labour cost Index: Statistics - tvki.
9.3.1. Data tables - consultations
Not available.
9.4. Dissemination format - microdata access
Not applicable for LCI.
9.5. Dissemination format - other
Not available.
9.6. Documentation on methodology
Nationally the metadata is presented in the LCI web pages.
9.7. Quality management - documentation
On arrival at Eurostat, labour cost data from countries are checked for completeness and consistency. In Finland also hours worked and wages ans salaries sum are compared to NA figures before publishing.
9.7.1. Metadata completeness - rate
Not available.
9.7.2. Metadata - consultations
Not available.
Costs of production for statistical data LCI 3,7 FTE and costs 206 776 € which is based on Statistics Finland financial administration.
LCS costs of production for statistical data is 0,1 FTE yearly and costs is 2871 €.
Private sector and local government sector data is web-based survey, government sector data is produced by Ministry of Treasure and the data is compiled by TAHTI system. We have also studied response burden by measuring the time the respondent fill the data. Most cases the time to fill the form takes under 15 minutes (average time). This of course means that respondents have prepared reports. When the time goes over 30 minutes it also means that the respondet have to calculate several reports and sum them up in order to get the asked information. The average time to obtain information reporting is 60 minutes (Statistics Finland have measured that in years 2018 and 2021). Of course Statistics Finland is developing the web-based form to help minimize the the time to fill in the form Also Income Register data is prefilled in the form partly so that respondenta need fill less items in the form and easing the informers burden.
11.1. Confidentiality - policy
If there is under three employees in enterprises in the main group of Nace Section 2008, then figures is not published. This is not the case in Finland.
11.2. Confidentiality - data treatment
See above.
No comments.
The quarterly Labour Cost Index (LCI) is a Euro Indicator which measures the cost pressure arising from the production factor "labour". The data covered in the LCI collection relate to total average hourly labour costs and to the labour cost categories "wages and salaries" and "employers' social security contributions plus taxes paid minus subsidies received by the employer". Data are available for the EU aggregates and EU Member States broken down by economic activities defined in sections B to S of the Statistical classification of economic activities in the European Communities (NACE Rev 2); in unadjusted, working day and seasonally adjusted form. The data on the LCI are given in the form of index numbers (current reference year: 2020) and of annual and quarterly growth rates (comparison with the previous quarter, or the same quarter of the previous year). The LCI shows the short-term development of the labour cost, the total cost on an hourly basis of employing labour. In other words, the LCI measures the cost pressure arising from the production factor “labour”.
Not Applicable
The concepts and classifications of the labour cost index are defined in the Commission’s implementing Regulation. Labour costs describe all costs incurred by an employer from the employment of labour. Labour costs are usually presented as costs for an hour worked. Costs arising from work premises, commuting or untaxed daily allowances are not included in labour costs. Total labour costs are obtained by deducting employer's subsidies from the sum of labour cost items. Employer's subsidies are intended for full or partial financing of costs arising from direct compensations paid by the employer. Such subsidies comprise employment subsidies and training compensations paid to employers.
In the labour cost index, labour cost items are grouped as follows:
Remuneration exclusive of one-off pay components;
One-off pay components;
Social security costs.
In the labour cost survey, labour cost items are divided into the following main groups:
Direct earnings;
One-off pay components;
Remuneration for days off;
Contributions to personnel funds;
Costs of fringe benefits and company products;
Social security costs;
Training costs;
Other labour force costs.
Direct earnings refer to wages and salaries paid for hours worked in each pay period. Direct earnings comprise direct compensations paid on the basis of hours worked, output produced or amount of work performed, compensations for overtime, shift work and the like additional bonuses and compensations paid regularly in each pay period.
One-off pay components refer to items that are not paid regularly in each pay period. Such bonuses that are often paid only once a year include performance-based bonuses and holiday pay, and seniority increments paid in some hourly paid fields. Payment of one-off pay components can also be based on collectively bargained agreements.
Pay for days off refers to compensations paid for statutory, agreement-based or voluntarily granted leaves, national holidays or other paid days of leave. Typical items of this group are pay during annual holiday entitlement, monthly paid employees' pay during national holidays, hourly paid employees' compensation during national holidays and days of leave in compensation of shortened working hours. Payments to personnel funds refer to the sums enterprises may annually contribute to their employees' saving systems, such as personnel funds. Costs of fringe benefits and company products include all costs incurred by an employer from the goods and services it provides for to its employees. Such goods and services include e.g. company car and subsidised meals, incentive stock options and personnel's recreational and social activities.
Own personnel's pay is not included.
Social security costs refer to the sum employers pay for the social security benefits of its employees. Such statutory, agreement-based or voluntary payments include employment pension, social security and unemployment insurance contributions. Additionally, this group comprises as imputed social security funding items pay during illness and parental leave (net, i.e. less compensations paid to the employee by the Social Insurance Institution) and occupational health care costs (likewise, net), as well as compensations arising from the termination of an employment relationship.
Training costs include e.g. costs of professional training services, costs of course participations, fees of instructors hired from outside the enterprise and payments to organisations arranging training. By contrast, pay for the participants during training is not counted as training costs but as pay for hours worked. Other labour costs include e.g. costs arising from protective and working clothes and from the procurement of labour. Employer's taxes paid on the basis of the sum of wages and salaries or the employed labour force that the labour cost concept of the European Union contains do not exist in Finland. The concept of labour costs partly equals the national accounts concept of compensation of employees but exclusive of e.g. occupational health care, training and recruitment costs.
The description area of structural statistics concerning earnings and labour costs (structure of earnings statistics, labour cost survey) does not include small enterprises with under 10 wage and salary earners and of the industries agriculture, forestry and fishing, or public administration.
The target population of the labour cost index is both by its size category and industry more exhaustive than this. The target population of the index also covers small enterprises regardless of their size and of the industries, public administration. Of the industries thus only agriculture, forestry and fishing are left outside the theoretical population of the index.
The average unit costs per hour worked are known to vary somewhat depending on the size of the enterprise. Enterprises are skewed as to size, the presumed non-response rate is higher for small enterprises and large enterprises cover the majority of the wages and salaries sum. In the survey frame the representativeness of all size enterprises is meant to be ensured for the collected data. The survey frame for the private sector is therefore stratified by the number of wage and salary earners into five size categories.
Sample size 2563/Population size 9013 in the private sector.
Local government sector 372: municipalities (309), joint municipalities (39), wellbeing services counties (21) and joint county authorities for wellbeing services (3). In the sample 120 units: municipalities (87), joint municipalities (9), wellbeing services counties (21) and joint county authorities for wellbeing services (3) out of all 372.
There were 525 government offices in 2008 and in 2023 there was 184 active government offices, total data which is administrative data.
The national labour cost index is released quarterly around 70 days after the end of the quarter on Statistics Finland’s Internet pages. The national index also covers all industries. Data are released on the main industry sums, six main groups (C,F,G,H,J and K) and on four subindustries of manufacturing (food industry, forest industry, chemical industry and metal industry), as well as on the central and local government sectors’ industry sums. Eurostat publishes the labour cost index quarterly on its Internet pages. Unlike the national labour cost index, Eurostat publishes data by industry without sector division.
In Finland the cost development of hours worked was defined between 1996 and 2002 on the industry level by dividing the monthly earnings for total working hours of a full-time wage and salary earner, determined according to Statistics Finland’s index of wage and salary earnings and structure of earnings statistics, by the average labour input for a month. The number of working hours of full-time wage and salary earners was based on Statistics Finland’s employment statistics. Since 2003 the compilation of the index has been decreed by Regulation No 450/2003 of the European Parliament and of the Council and by related Commission Regulation No 1216/2003 on its implementation. In the first phase the regulation-based statistical obligation related only to manufacturing and private service sector industries. The industry coverage of the index was enlarged by the Commission’s new implementing Regulation No 224/2007 to concern from 2007 onwards the industries of so-called welfare services for which the public sector is mainly responsible.
The European Parliament yearly monitors the quality of the labour cost index on the basis of a report submitted by the Commission. The concepts and classifications of the labour cost index are defined in the Commission’s implementing Regulation.
Finland nuts 1.
Not Applicable
The basis used to calculate the Labour Cost Index are the results of the Labour Cost Survey. These data, which are collected every four years, are updated by means of quarterly data sources. When new data become available from the labour cost survey, a benchmarking exercise is performed for the years between two labour cost surveys.
Not Applicable
Preliminary control of data, Database controls, Imputation of labour input data, Finalising the processing of the data, Compilation of the labour cost index.
Table 1. Size classes in the private sector frame:
20/30 - 50 employees
50 - 100 employees
100 - 250 employees
250 - 500 employees
Over 500 employees
The survey frame was formed on basis on Nace 2 rev. 1, which was then converted to the new Nace 2008 rev. 2.1. by key in the end of 2006. Sampling fractions were formed by two-way power-allocation. Also non-response was taken into account when forming sample fraction, which was known from the earlier inquires.
Geographically the calculation covers whole of the country. All enterprises which have 250 employees or less in the sample are within the survey at least two years of time. All enterprises which have more than 250 employees are almost always in the survey; only demographic changes may change the original sample fractions. In table 2 there is the numbers of enteprises that had been addeed to the sample and numer of enterprise that have been released in each year. The reason why enterprises have been released from the survey is that som of the enterprises have fallen under the first size class (under 20 employees). The other reason is that enterprises have gone out of business. Thirdly some enterprises have been released because they have been in the survey from 2007 on and have been replaced.
The reason why enterprises have been released from the survey is that some of the enterprises have fallen under the first size class (under 20 employees). The other reason is that enterprises have gone out of business. Thirdly some enterprises have been released because they have been in the survey from 2007 on and have been replaced. About 100-200 enterprises are changed in the sample each year.
Local governent sector: In the sample 120 units: municipalities (87), joint municipalities (9), wellbeing services counties (21) and joint county authorities for wellbeing services (3) out of all 357. Sample covers all biggest (over 50 000 inhabitans) municipalities and simple random sampling in 5 000 - 49 999 inhabitans municipalities.
Central govenment sector total data, Government offices and istitutions (525 government offices in 2008 and 184 active government offices in 2023).
Not Applicable
See 7.1.1-7.1.2.
Nuts 1, so no internal comparision is possible, only comparision in European level.
The same production model has been applied since 2007 in the private sector and local government sector. The central government sector is based on administrative data and have been added to series from second quarter of 2012.