Reference metadata describe statistical concepts and methodologies used for the collection and generation of data. They provide information on data quality and, since they are strongly content-oriented, assist users in interpreting the data. Reference metadata, unlike structural metadata, can be decoupled from the data.
Innovation, Business sector production and Research
1.3. Contact name
Confidential because of GDPR
1.4. Contact person function
Confidential because of GDPR
1.5. Contact mail address
Statistics Sweden ESA/NUP/INF Solna Strandväg 86 SE-171 54 Solna
1.6. Contact email address
Confidential because of GDPR
1.7. Contact phone number
Confidential because of GDPR
1.8. Contact fax number
Confidential because of GDPR
2.1. Metadata last certified
5 March 2025
2.2. Metadata last posted
5 March 2025
2.3. Metadata last update
5 March 2025
3.1. Data description
Data on the Information and Communication Technologies (ICT) usage and e-commerce in enterprises are survey data. They are collected by the National Statistical Institutes or Ministries and are in principle based on Eurostat's annual model questionnaires on ICT usage and e-commerce in enterprises.
The legal basis for ICT enterprise statistics for survey year 2024 is Commission Implementing Regulation (EU) 2023/1507 of 20 July 2023 laying down the technical specifications of data requirements for the topic 'ICT usage and e-commerce' for the reference year 2024. A large part of the data collected is used to measure the progress in the implementation of one of the main political priorities of the European Commission for 2019 to 2024 – A Europe fit for the digital age.
Furthermore, ICT data facilitate the monitoring of the EU’s digital targets for 2030, set by the Digital Decade Policy Programme. Four of the key performance indicators (KPIs) of the current programme stem from the statistics for which the implementing and delegated acts are enclosed for adoption: Artificial Intelligence, cloud, big data (data analytics) and the digital intensity index for businesses (DII) - a composite indicator reflecting the digital transformation of businesses. The aim of the European survey on ICT usage and e-commerce in enterprises is to collect and disseminate harmonised and comparable information at European level.
Name of data collection
ICT usage and e-commerce in enterprises 2024 (Swedish: "It-användning i företag 2024")
All economic activities in the scope of Annex of the Commission Regulation are intended to be included in the general survey, covering enterprises with 10 or more employees and self-employed persons. These activities are:
Section C – “Manufacturing”
Section D, E – “Electricity, gas, steam and air conditioning supply”, “Water supply, sewerage, waste management and remediation activities”
Section F – “Construction”
Section G – “Wholesale and retail trade; repair of motor vehicles and motorcycles”
Section H – “Transportation and storage”
Section I – “Accommodation and food service activities”
Section J – “Information and communication”
Section L – “Real estate activities”
Section M – “Professional, scientific and technical activities”
Section N – "Administrative and support service activities"
Group 95.1 – “Repair of computers and communication equipment”.
For micro-enterprises see the sub-concepts below.
3.3.1. Coverage-sector economic activity for micro-enterprises - All NACE Rev. 2 categories are covered
Yes
3.3.2. Coverage sector economic activity for micro-enterprises - If not all activities were covered, which ones were covered?
All activities were covered.
3.4. Statistical concepts and definitions
The model questionnaire on ICT usage and e-commerce in enterprises 2024 provides a large variety of variables covering the following topics:
Access and use of the internet
E-Commerce sales
ICT specialists and skills
ICT security
Artificial Intelligence.
The annual model questionnaires and the European businesses statistics compliers’ manual for ICT usage and e-commerce in enterprises comprise definitions and explanations regarding the topics of the survey.
3.5. Statistical unit
The statistical unit is 'enterprise,' defined as equivalent to one or more legal units. In situations where an enterprise consists of several legal units, a representative legal unit is selected and assessed following "the representative approach." This means that if an enterprise consists of more than one legal unit, one legal unit within the enterprise is selected to represent the entire enterprise to which it belongs. The selection of the representative is based on a set of predetermined criteria:
Industry classification (NACE)
Number of employees
Total turnover.
3.6. Statistical population
Target Population
As required by Annex of the Commission Implementing Regulation, enterprises with 10 or more employees and self-employed persons are covered by the survey.
For micro-enterprises see the sub-concepts below.
3.6.1. Coverage of micro-enterprises
Yes
3.6.2. Breakdown between size classes [0 to 1] and [2 to 9]
Yes
3.6.3. If for micro-enterprises different size delimitation was used, please indicate it.
Not applicable.
3.7. Reference area
All of the territory of the country.
3.8. Coverage - Time
Years 2023 and 2024.
3.9. Base period
Not applicable
Percentages of enterprises, Percentages of turnover, Percentages of employees and self-employed persons, Million euro (for selected indicators in some countries).
The reference period defined in the Eurostat model questionnaire was followed for all variables.
6.1. Institutional Mandate - legal acts and other agreements
Complementary national legislation constituting the legal basis for the survey on the use of ICT in enterprises:
The obligation to provide information applies according to the Act (2001: 99) on the official statistics. The statistics are also regulated by the Ordinance (2001: 100) on the official statistics and Statistics Sweden's regulations (SCB-FS 2023:24).
6.2. Institutional Mandate - data sharing
Statistics Sweden is the only producer of official statistics for ICT-usage and e-commerce in enterprises.
7.1. Confidentiality - policy
Regulation (EC) No 223/2009 on European statistics (recital 24 and Article 20(4)) of 11 March 2009 (OJ L 87, p. 164), stipulates the need to establish common principles and guidelines ensuring the confidentiality of data used for the production of European statistics and the access to those confidential data with due account for technical developments and the requirements of users in a democratic society.
At national level:
The national policy employs the p-percent rule. According to this rule, a cell is deemed sensitive if the largest contributor to the cell can be estimated with an error margin within P% of the true value.
7.2. Confidentiality - data treatment
Data are transmitted via eDamis (encrypted) and delivered to a secure environment where they are treated. Flags are added for confidentiality in case results must not be disclosed.
At national level:
For the Quality report, the national policy involves suppressing cells classified as sensitive according to the p-percent rule. The software TauArgus is used for confidentiality control and cell suppression, including secondary suppression when necessary.
8.1. Release calendar
There is a release calendar for the statistical outputs. This calendar is publicly accessible (see 8.2.).
The national results were published on November 21st, 2024, as a press release and Statistics Sweden's online tool for extracting time series from the national statistical database was updated with the data.
The national results were published online on November 21st, 2024, on Statistics Sweden’s website in the form of a press release, accompanied by an online tool specifically designed for extracting time series data from the national statistical database. The press release is available in both English and Swedish.
Results for selected variables collected in the framework of this survey are available for all participating countries on Digital economy and society of Eurostat website.
At national level:
Results are published in the national statistical database on Statistics Sweden’s website.
10.4. Dissemination format - microdata access
Statistics Sweden’s enterprise microdata is confidential. However, you can access anonymized microdata following a confidentiality assessment, provided Statistics Sweden deems that you have valid grounds to process the data. For more information, see: Ordering microdata.
10.5. Dissemination format - other
Not requested
10.5.1. Metadata - consultations
Not requested
10.6. Documentation on methodology
The European businesses statistics compilers’ manual for ICT usage and e-commerce in enterprises provides guidelines and clarifications for the implementation of the surveys.
At national level:
Documentation on the production of statistics on ICT usage and e-commerce in enterprises 2024 was published on Statistics Sweden’s website (only available in Swedish) alongside the national release on November 21, 2024. This documentation includes the survey design and the implementation of the statistical production.
A quality declaration was published on Statistics Sweden’s website (only available in Swedish) alongside the national release on November 21, 2024. This document includes quality, production, and a detailed description of the content of the statistical production.
The European businesses statistics compliers’ manual for ICT usage and e-commerce in enterprises provides guidelines and standards for the implementation of the surveys. It is updated every year according to the changed contents of the model questionnaires.
At national level:
The survey refers to Sweden's official statistics (SOS). Therefore special rules apply for quality and accessibility, see the Act (2001:99) and the Ordinance (2001:100) on official statistics and Statistics Sweden's regulations (SCB-FS 2024:24) on quality for official statistics.
11.2. Quality management - assessment
At European level, the recommended use of the annual Eurostat model questionnaire aims at improving comparability of the results among the countries that conduct the survey on ICT usage and e-commerce in enterprises. Moreover, the European businesses statistics compilers’ manual for ICT usage and e-commerce in enterprises provides guidelines and clarifications for the implementation of the surveys.
At national level:
We uses the framework provided in Eurostat model questionnaire. The framework is tested at the national level while the model questionnaire is translated. Furthermore, we adhere to the Methodological Manuel as much as possible.
12.1. Relevance - User Needs
National level: The Ministry of Finance and other relevant authorities are consulted when determining the optional and national questions to be included in the national questionnaire. Additionally, Statistics Sweden seeks their input if they believe an issue falls within the ministry's purview.
12.2. Relevance - User Satisfaction
Not available.
12.3. Completeness
Detailed information is available in “ Annex I. Completeness “ - related to questionnaire, coverage, additional questions, regional data.
12.3.1. Data completeness - rate
Not requested
13.1. Accuracy - overall
Comments on reliability and representativeness of results and completeness of dataset
These comments reflect overall standard errors reported for the indicators and breakdowns in section 13.2.1 (Sampling error - indicators) and the rest of the breakdowns for national and European aggregates, as well as other accuracy measurements. The estimated standard error should not exceed 2pp for the overall proportions and should not exceed 5pp for the proportions related to the different subgroups of the population (for those NACE aggregates for the calculation and dissemination of national aggregates). If problems were found, these could have implications for future surveys (e.g. need to improve sampling design, to increase sample sizes, to increase the response rates).
More detailed information is available in “ Annex II. Accuracy “ - related to European aggregates, comments on reliability and use of flag.
13.2. Sampling error
For calculation of the standard error see 13.2.1.1.
13.2.1. Sampling error - indicators
Standard error (for selected indicators and breakdowns)
Precision measures related to variability due to sampling, unit non-response (the size of the subset of respondents is smaller than the size of the original sample) and other (imputation for item non-response, calibration etc.) are not (yet) required from the Member states for all indicators. Eurostat will make basic assumptions to compute these measures for all indicators produced (e.g. stratified random sampling assuming as strata the crossing of the variables “Number of employees and self-employed persons” and “Economic Activity” as it was defined in the 3 tables of section 18.1).
More detailed information is available in“ Annex III. Sample and standard error tables 2024 “ – worksheets starting with “Standard error".
13.2.1.1. Sampling error indicator calculation
Calculation of the standard error
Various methods can be used for the calculation of the standard error for an estimated proportion. The aim is to incorporate into the standard error the sampling variability but also variability due to unit non-response, item non-response (imputation), calibration etc. In case of census / take-all strata, the aim is to calculate the standard errors comprising the variability due to unit non-response and item non-response.
a) Name and brief description of the applied estimation approach
A precision for the estimated proportion, in terms of a standard error, is specified for each economic activity strata. The Horwitz-Thompson estimator is used. Unit non-response is compensated by means of adjusting the weights to reflect the actual number of respondents. Item non-response are imputed when answers can be derived from other questions (known as “logical corrections”). Due to survey errors, a few units did not receive all the questions they were supposed to, and these item non-responses were also imputed.
b) Basic formula
The following estimator is used for estimations of totals:
where is the value of the variable y for unit k, is the sample in stratum (d,h), is the number of units in the population in stratum (d,h) and is the sample size in stratum (d,h). In case of nonresponse, is replaced with the actual number of respondents in the stratum. For variables where number of enterprises are estimated, for enterprises responding "yes" and for other enterprises.
For turnover variables the following estimator is used for estimations of totals:
Where is the sum of turnover for the population in stratum (d,h) and is the sum of turnover for the respondents in stratum (d,h).
For variables that regard number of employees the following estimator is used for estimations of totals:
Whereis the total number of employees for the population in stratum (d,h) and is the total number of employees for the respondents in stratum (d,h).
c)Main reference in the literature
Särndal, C.-E., Swensson, B. och Wretman J. (1992). Model Assisted Survey Sampling. New York: Springer-Verlag
d)How has the stratification been taken into account?
The stratification of the sampling frame is based on economic activity (NACE Rev 2) and number of employees.
Stratification according to NACE is designed to closely match the domains of study, i.e., subsets of the population. Each economic activity stratum is divided into ten size strata, including three for small enterprises, with size limits based on the number of employees.
Enterprises with 200 or more employees are included in the census. For enterprises with 0–199 employees, the sampling frame stratification is based on economic activity and number of employees.
e)Which strata have been considered?
Stratum = NACE classes according to NACE Nace2007, where NACE classes are divided by size:
Size Classes for enterprises with 10 or more employees
Size class 1 = 10 – 19 employees
Size class 2 = 20 – 49 employees
Size class 3 = 50 – 99 employees
Size class 4 = 100 – 199 employees
Size class 5 = 200 – 249 employees
Size class 6 = 250 – 499 employees
Size class 7 = 500 – employees
Size Classes for enterprises with 0-9 employees
Size class 8 = 0–1 employee
Size class 9 = 2–9 employees
Size class 10 = 0–9 employees
13.3. Non-sampling error
See detailed sections below.
13.3.1. Coverage error
See concept 18.1.1. A) Description of frame population.
13.3.1.1. Over-coverage - rate
The over-coverage issue arises from enterprises that have either been discontinued or merged, and this occurs due to delays in reporting to the registry. Generally, the coverage is robust, and the impact of coverage errors on overall estimate uncertainty is considered minor. Out of the total sample size for 10 or more employees of 4 721, 1 case were identified as over-coverage. For 0-9 employees of 3 092, 0 cases were identified as over-coverage. Consequently, the over-coverage rate in the sample stands at 0,02% for 10 or more employees, and it is assumed to be representative of the over-coverage rate in the entire sampling frame.
13.3.1.2. Common units - proportion
Not requested
13.3.2. Measurement error
Measurement errors mainly occur due to unclear questions, non-comprehensive, or non-mutually exclusive answer options. The extent of these errors and their impact on uncertainty is difficult to quantify.
To prevent measurement errors, significant effort is put into formulating clear and simple questions. Responses and follow-up contacts with respondents indicate that measurement errors primarily affect quantitative variables related to e-commerce. Respondents may also struggle with understanding and interpreting certain qualitative variables. For example, if an enterprise uses a technology mentioned in the questionnaire but not specifically listed in the examples, they might incorrectly report that they do not use the technology.
13.3.3. Non response error
See detailed sections below.
13.3.3.1. Unit non-response - rate
See detailed sub-concepts below.
13.3.3.1.1. Unit response
The following table contains the number of units (i.e. enterprises), by type of response to the survey and by the percentage of these values in relation to the gross sample size.
Type of response
Enterprises
0-9 (or 2-9) employees and self-employed persons
10 or more employees and self-employed persons
Number
%
Number
%
Gross sample size (as in section 3.1 C)
3 092
100%
4 721
100%
1. Response (questionnaires returned by the enterprise)
2 211
71.51%
3 796
80.41%
1.1 Used for tabulation and grossing up (Net sample or Final Sample; as in section 3.1 D)
2 150
69.53%
3 779
80.05%
1.2 Not used for tabulation
61
1.97%
17
0.36%
1.2.1 Out of scope (deaths, misclassified originally in the target population, etc.)
1
0.02%
1.2.2 Other reasons (e.g. unusable questionnaire)
61
1.97%
16
0.34%
2. Non-response (e.g. non returned mail, returned mail by post office)
881
28.49%
925
19.59%
Comments on unit response, if unit response is below 60%
13.3.3.1.2. Methods used for minimizing unit non-response
1. In addition to the Swedish questionnaire, an English version is provided to accommodate respondents who do not speak Swedish, ensuring they can conveniently provide their answers.
2. After the second written reminder, emails are sent to prioritised enterprises, which include medium-sized and large enterprises, as well as enterprises with significant turnover from e-commerce, that have not yet submitted their responses.
13.3.3.1.3. Methods used for unit non-response treatment
1. No treatment for unit non-response
2. Treatment by re-weighting
2.1 Re-weighting by the sampling design strata considering that non-response is ignorable inside each stratum (the naïve model)
2.2 Re-weighting by identified response homogeneity groups (created using sample-level information)
2.3 Re-weighting through calibration/post-stratification (performed using population information) by the groups used for calibration/post-stratification
3. Treatment by imputation (done distinctly for each variable/item)
4. Method(s) and the model(s) corresponding to the above or other method(s) used for the treatment of unit non-response. (e.g. Re-weighting using Horvitz-Thompson estimator, ratio estimator or regression estimator, auxiliary variables)
Object non-response: adjustment is made by reweighting, i.e. number in sample,, replaced by number of respondents in the sample,, replaced by(the enterprises that responded).
13.3.3.1.4. Assessment of unit non-response bias
Response rate was higher then 60%.
13.3.3.2. Item non-response - rate
In 2024, two incorrect filters were discovered in the survey. This resulted in a few enterprises not receiving all the questions they were supposed to get. This was corrected with imputations. Despite this, the impact of the processing error on reliability is considered to be small.
13.3.3.2.1. Methods used for item non-response treatment
1. No treatment for item non-response
2. Deductive imputation An exact value can be derived as a known function of other characteristics.
Deductive imputation was used when there were clear filter errors in the survey.
3. Deterministic imputation (e.g. mean/median, mean/median by class, ratio-based, regression-based, single donor nearest-neighbour) Deterministic imputation leads to estimators with no random component, that is, if the imputation were to be re-conducted, the outcome would be the same.
Nearest neighbour was used when we had unclear filter errors in the survey.
4. Random imputation (e.g. hot-deck, cold-deck) Random imputation leads to estimators with a random component, that is, if the imputation were re-conducted, it would have led to a different result.
Cold-deck was used when we had unclear filter errors in the survey but could obtain exact information from previous years or a different survey.
5. Re-weighting
6. Multiple imputation In multiple imputation each missing value is replaced (instead of a single value) with a set of plausible values that represent the uncertainty of the right value to impute. Multiple imputation methods offer the possibility of deriving variance estimators by taking imputation into account. The incorporation of imputation into the variance can be easily derived based on variability of estimates among the multiply imputed data sets.
7. Method(s) and the model(s) corresponding to the above or other method(s) used for the treatment of item non-response.
13.3.3.2.2. Questions or items with item response rates below 90% and other comments
Other comments relating to the item non-response
Additional issues concerning "item non-response" calculation (e.g. method used in national publications).
Not applicable
Questions and items with low response rates (cut-off value is 90%) and item non-response rate.
Not applicable
13.3.4. Processing error
In 2024, two incorrect filters were discovered in the survey. This resulted in a few enterprises not receiving all the questions they were supposed to get. This was corrected with imputations. Despite this, the impact of the processing error on reliability is considered to be small.
13.3.5. Model assumption error
Not requested
14.1. Timeliness
See detailed section in the Full metadata report.
14.1.1. Time lag - first result
Not applicable
14.1.2. Time lag - final result
Data are to be delivered to Eurostat in the fourth quarter of the reference year (due date for the finalised dataset is 5th October). European results are released before the end of the survey year or in the beginning of the year following the survey year (T=reference year, T+0 for indicators referring to the current year, T+12 months for other indicators referring to the previous year e.g. e-commerce).
At national level:
Data collection start in February and end in August. National results are released by the end of November, resulting in a time lag of 10 months.
14.2. Punctuality
See detailed section below.
14.2.1. Punctuality - delivery and publication
Data were delivered to Eurostat on 5th October; 0 days before the deadline.
15.1. Comparability - geographical
The model questionnaire is generally used by the countries that conduct the survey on ICT usage and e-commerce in enterprises. Due to (small) differences in translation, in the used survey vehicle, in non-response treatment or different routing through the questionnaire, some results for some countries may be of reduced comparability. In these cases, notes are added in the data.
Detailed information on differences in the wording of the questions in the national questionnaires is available in “ Annex I. Completeness “ - worksheets related to questionnaire, coverage, additional questions.
Comparability between regions:
Data on NUTS 2 regional level were not delivered.
Detailed information on the provision of data on NUTS 2 regional level is available in “Annex I. Completeness“ – worksheets related to regional data.
15.1.1. Asymmetry for mirror flow statistics - coefficient
Not applicable
15.2. Comparability - over time
See detailed section in the Full metadata report.
15.2.1. Length of comparable time series
The length of comparable time series depends on the module and the variable considered within each survey module. Additional information is available in annexes attached to the European metadata.
For reference year 2023, the statistical unit “enterprise” was implemented in line with the EBS regulation 2020/1197 in the Swedish Business Register (BR). The implementation increased the number of complex enterprises in the BR from approximately 30 to 50 000 and led to a break in series.
To produce enterprise statistics from complex enterprises, a representative legal unit was selected to represent the entire enterprise. The selection criteria for the representative included:
Industry affiliation (NACE)
Number of employees
Turnover
The first criteria for selecting the representative was the industry affiliation closest to that of the enterprise. The second criteria was personnel intensity, selecting the legal unit with the highest number of employees. The third criteria was the legal unit with the highest turnover.
This change has resulted in a break in the time series for all recurring variables in the survey that were included before 2023.
15.3. Coherence - cross domain
Not applicable
15.3.1. Coherence - sub annual and annual statistics
Not applicable
15.3.2. Coherence - National Accounts
Not applicable
15.4. Coherence - internal
Not applicable
Restricted from publication
17.1. Data revision - policy
In accordance with national policy, data revisions are categorized into three types:
A.Continuous Revisions (Planned and Recurring): These revisions are conducted on a routine basis, following a planned sequence of reports for specific statistics. B. Revisions due to Changes in Methods or Definitions (Planned and One-time): These revisions occur due to alterations in methods or definitions, typically aimed at improving reliability. Changes in terms, definitions, or classifications result in a modification of the statistical content, often requiring adjustments to handle breaks in time series. These revisions are of a one-time nature. C. Corrections (Unplanned Revisions): These revisions, beyond standard routines, are necessary in response to errors discovered after regular reporting or the addition of new information. The decision to make corrections depends on the impact these errors have on the statistical values, determining the necessity and timing of the correction.
17.2. Data revision - practice
Corrections to statistical values, whether due to errors discovered post-reporting or the inclusion of new information, may necessitate more than routine procedures. The decision to implement a correction hinge on the impact on the statistical values and the timing of the correction need. It is essential to assess the overall effect on the reported statistics. Initially, the significance of the corrections relative to the reported values and their reliability should be evaluated. Furthermore, the informational value of the correction must be considered before preparing the revised report.
Choosing the appropriate timing for the correction is crucial, taking into account the importance of the change and the reference period of the statistics. For significant corrections, it is advisable to determine whether users should be notified in advance about the upcoming correction. If so, the method and timing of this communication should be specified. Identifying suitable communication channels is essential; while notifications can be sent via email, it is important to ensure that all users are also informed through the website where the statistical values are published.
Providing clear and comprehensive information about the corrections is vital, especially in an additional statement accompanying the statistics. The reason for the correction should be included.
17.2.1. Data revision - average size
Not requested
18.1. Source data
A) Frame population description and distribution
The sampling frame for the survey on ICT usage and e-commerce in enterprises 2024 consists of all active enterprises in the Swedish Business Register (BR) classified into the economic activities (based on NACE Rev 2) 10-82 and 95.1 (excluding 64-67, 76) and institutional sector codes (INSEKT 2014) 111000, 112000, 113000. A version of the BR established in November year 2023 is used. Micro enterprises (0-9 employees) and enterprises with 10 or more employees are included.
For more information see concept 18.1.1.
B) Sampling design - Sampling method
Description of the sampling method used (e.g. stratified random sample, quota sampling, cluster sampling; one-stage or two-stage sampling) and information which variables were used to stratify, the categories of those variables, in particular for the NACE Rev. 2 categories related to the "possible calculation of European aggregates", and the final number of strata:
The statistical unit is 'enterprise,' defined as equivalent to one or more legal units. Stratified simple random sampling with Neyman (optimal) allocation is used. In situations where an enterprise consist of several legal units, a representative legal unit is selected and assessed following "the representative approach." This means that if an enterprise consist of more than one legal unit, one legal unit within the enterprise is sampled and designated to represent the entire enterprise unit to which it belongs. The selection of the representative is based on a set of predetermined criteria:
Industry classification (NACE)
Number of employees
Total turnover.
This approach is chosen because of the vast number of enterprises with two or more legal units in the BR frame at Statistics Sweden. By Swedish law we may not share which legal units that are in the enterprise therefore we cannot ask the head legal unit or one representative to respond for the other legal units. Due to large response burden and great expense, we cannot collect data from all legal units for each sampled enterprise either.
A description of how the enterprises is sampled is given as follows:
The sampling method that is used is stratified simple random sample. Enterprises with 200 or more employees are censused. The stratification of the sampling frame for enterprises with 0-199 is based on economic activity NACE Rev 2 and number of employees.
The NACE categories are done according to the European NACE aggregates (se NACE breakdown section in Eurostat Model Questionnaire for the Community Survey on ICT Usage and e-commerce in Enterprises 2024). For categories of number of employees, se Size Classes for enterprises with 10 or more employees in 13.2.1.1. e). The final number of strata for enterprises with 10 or more employees is 241. The he final number of strata for enterprises with 0-9 employees is 81.
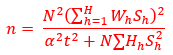
Neyman (optimum) allocation is used to decide sample sizes in each stratum except for those strata where the number of employees are at least 200. In each stratum a random sample of enterprises is selected. Number of enterprises, number of employees, and total turnover are used as allocation variables. The stratum variance on the population level is calculated for each of the allocation variables. Required sample size in each stratum is calculated with respect to each of the allocation variables to achieve a specified precision, given in terms of a relative standard error. This means that Neyman allocation is performed three times and the final sample size in each stratum is chosen according to the allocation variable that gives the largest sample size.
The calculation formula is given as:
Where
= the number of sample size in each stratum
= the total sample size for the survey and calculated as:
= the selected precision
= the sum of the allocation variable for the population
= the standard deviation in stratum with respect to the allocation variable
= the number of strata
= the population size for the survey ,
the proportion of the population in stratum h.
The minimum sample size in each stratum is five enterprises. Observe that the allocation only considers domains that agree with strata (or aggregates of strata), in other words, domains that cut across strata cannot be considered in the allocation. In addition, the allocation does not take possible nonresponse into account. The sample is coordinated over time and positively coordinated with the surveys Enterprises' IT expenditure and Community Innovation Survey to increase comparability between the three surveys.
C) Gross sample distribution
More detailed information is available in “ Annex III. Sample and standard error tables 2024 “ (Worksheet: GROSS SAMPLE)
D) Net sample distribution
More detailed information is available in “ Annex III. Sample and standard error tables 2024 “ (Worksheet: NET SAMPLE)
18.1.1. Sampling design & Procedure frame
A) Description of frame population
a) When was the sample for the ICT usage and e-commerce in enterprise survey drawn?
December, 2023
b) Last update of the Business register that was used for drawing the sample of enterprises for the survey:
November, 2023
c) Indication if the frame population is the same as, or is in some way coordinated with, the one used for the Structural Business Statistics (different snapshots):
No coordination with the SBS, different snapshots from the SBR are used.
d) Description if different frames are used during different stages of the statistical process (e.g. frame used for sampling vs. frame used for grossing up):
No difference
e) Indication the shortcomings in terms of timeliness (e.g. time lag between last update of the sampling frame and the moment of the actual sampling), geographical coverage, coverage of different subpopulations, data available etc., and any measures taken to correct it, for this survey.
The frame has some undercoverage of start-up enterprises and of "growing" enterprises. The overcoverage consists of discontinued and merged enterprises. Undercoverage and overcoverage occurs because of some delay in reporting to the registry. In general, coverage is considered to be good and the coverage error's contribution to the overall uncertainty in estimates is therefore deemed to have small impact.
B) Frame population distribution
More detailed information is available in “ Annex III. Sample and standard error tables 2024 “ (Worksheet: FRAME POPULATION)
18.2. Frequency of data collection
Annual
18.3. Data collection
See detailed sections below.
18.3.1. Survey period
Survey / Collection
Date of sending out questionnaires
Date of reception of the last questionnaire treated
General survey
01 February 2024
31 August 2024
Micro-enterprises
01 February 2024
31 August 2024
18.3.2. Survey vehicle – general survey
General survey - Stand-alone survey
18.3.3. Survey vehicle – micro-enterprises
The collection of micro-enterprises was integrated with the general survey
18.3.4. Survey type
Self-administrated web survey. The enterprises are invited to fill in a web questionnaire in Swedish or in English. If needed, in rare cases, a PDF version will be sent to the respondent and answers will be collected through e-mail.
18.3.5. Survey participation
Mandatory
18.4. Data validation
Edamis was utilized for the purpose of data validation.
18.5. Data compilation
Grossing-up procedures
The result is weighted by numbers of enterprises, numbers of employees and self-employed persons and turnover in the net sample depending on the variable. See section 13.2.1.1. B) Basic formula. Unit non-response is compensated by changing the denominator from the sample units to the responding units or the respondents’ turnover or number of employees depending on the variable. Post-stratification is not applied.
18.5.1. Imputation - rate
Item non-response are imputed when answers can be derived from other questions (known as “logical corrections”). Due to survey errors, a few units did not receive all the questions they were supposed to, and these item non-responses were also imputed.
18.6. Adjustment
Not applicable
18.6.1. Seasonal adjustment
Not applicable
19.1. Documents
Questionnaire in national language
It-användning i företag 2024
Questionnaire in English (if available)
ICT usage and e-commerce in enterprises 2024
National reports on methodology (if available)
Analysis of key results, backed up by tables and graphs in English (if available)
Data on the Information and Communication Technologies (ICT) usage and e-commerce in enterprises are survey data. They are collected by the National Statistical Institutes or Ministries and are in principle based on Eurostat's annual model questionnaires on ICT usage and e-commerce in enterprises.
The legal basis for ICT enterprise statistics for survey year 2024 is Commission Implementing Regulation (EU) 2023/1507 of 20 July 2023 laying down the technical specifications of data requirements for the topic 'ICT usage and e-commerce' for the reference year 2024. A large part of the data collected is used to measure the progress in the implementation of one of the main political priorities of the European Commission for 2019 to 2024 – A Europe fit for the digital age.
Furthermore, ICT data facilitate the monitoring of the EU’s digital targets for 2030, set by the Digital Decade Policy Programme. Four of the key performance indicators (KPIs) of the current programme stem from the statistics for which the implementing and delegated acts are enclosed for adoption: Artificial Intelligence, cloud, big data (data analytics) and the digital intensity index for businesses (DII) - a composite indicator reflecting the digital transformation of businesses. The aim of the European survey on ICT usage and e-commerce in enterprises is to collect and disseminate harmonised and comparable information at European level.
Name of data collection
ICT usage and e-commerce in enterprises 2024 (Swedish: "It-användning i företag 2024")
5 March 2025
The model questionnaire on ICT usage and e-commerce in enterprises 2024 provides a large variety of variables covering the following topics:
Access and use of the internet
E-Commerce sales
ICT specialists and skills
ICT security
Artificial Intelligence.
The annual model questionnaires and the European businesses statistics compliers’ manual for ICT usage and e-commerce in enterprises comprise definitions and explanations regarding the topics of the survey.
The statistical unit is 'enterprise,' defined as equivalent to one or more legal units. In situations where an enterprise consists of several legal units, a representative legal unit is selected and assessed following "the representative approach." This means that if an enterprise consists of more than one legal unit, one legal unit within the enterprise is selected to represent the entire enterprise to which it belongs. The selection of the representative is based on a set of predetermined criteria:
Industry classification (NACE)
Number of employees
Total turnover.
Target Population
As required by Annex of the Commission Implementing Regulation, enterprises with 10 or more employees and self-employed persons are covered by the survey.
For micro-enterprises see the sub-concepts below.
All of the territory of the country.
The reference period defined in the Eurostat model questionnaire was followed for all variables.
Comments on reliability and representativeness of results and completeness of dataset
These comments reflect overall standard errors reported for the indicators and breakdowns in section 13.2.1 (Sampling error - indicators) and the rest of the breakdowns for national and European aggregates, as well as other accuracy measurements. The estimated standard error should not exceed 2pp for the overall proportions and should not exceed 5pp for the proportions related to the different subgroups of the population (for those NACE aggregates for the calculation and dissemination of national aggregates). If problems were found, these could have implications for future surveys (e.g. need to improve sampling design, to increase sample sizes, to increase the response rates).
More detailed information is available in “ Annex II. Accuracy “ - related to European aggregates, comments on reliability and use of flag.
Percentages of enterprises, Percentages of turnover, Percentages of employees and self-employed persons, Million euro (for selected indicators in some countries).
Grossing-up procedures
The result is weighted by numbers of enterprises, numbers of employees and self-employed persons and turnover in the net sample depending on the variable. See section 13.2.1.1. B) Basic formula. Unit non-response is compensated by changing the denominator from the sample units to the responding units or the respondents’ turnover or number of employees depending on the variable. Post-stratification is not applied.
A) Frame population description and distribution
The sampling frame for the survey on ICT usage and e-commerce in enterprises 2024 consists of all active enterprises in the Swedish Business Register (BR) classified into the economic activities (based on NACE Rev 2) 10-82 and 95.1 (excluding 64-67, 76) and institutional sector codes (INSEKT 2014) 111000, 112000, 113000. A version of the BR established in November year 2023 is used. Micro enterprises (0-9 employees) and enterprises with 10 or more employees are included.
For more information see concept 18.1.1.
B) Sampling design - Sampling method
Description of the sampling method used (e.g. stratified random sample, quota sampling, cluster sampling; one-stage or two-stage sampling) and information which variables were used to stratify, the categories of those variables, in particular for the NACE Rev. 2 categories related to the "possible calculation of European aggregates", and the final number of strata:
The statistical unit is 'enterprise,' defined as equivalent to one or more legal units. Stratified simple random sampling with Neyman (optimal) allocation is used. In situations where an enterprise consist of several legal units, a representative legal unit is selected and assessed following "the representative approach." This means that if an enterprise consist of more than one legal unit, one legal unit within the enterprise is sampled and designated to represent the entire enterprise unit to which it belongs. The selection of the representative is based on a set of predetermined criteria:
Industry classification (NACE)
Number of employees
Total turnover.
This approach is chosen because of the vast number of enterprises with two or more legal units in the BR frame at Statistics Sweden. By Swedish law we may not share which legal units that are in the enterprise therefore we cannot ask the head legal unit or one representative to respond for the other legal units. Due to large response burden and great expense, we cannot collect data from all legal units for each sampled enterprise either.
A description of how the enterprises is sampled is given as follows:
The sampling method that is used is stratified simple random sample. Enterprises with 200 or more employees are censused. The stratification of the sampling frame for enterprises with 0-199 is based on economic activity NACE Rev 2 and number of employees.
The NACE categories are done according to the European NACE aggregates (se NACE breakdown section in Eurostat Model Questionnaire for the Community Survey on ICT Usage and e-commerce in Enterprises 2024). For categories of number of employees, se Size Classes for enterprises with 10 or more employees in 13.2.1.1. e). The final number of strata for enterprises with 10 or more employees is 241. The he final number of strata for enterprises with 0-9 employees is 81.
Neyman (optimum) allocation is used to decide sample sizes in each stratum except for those strata where the number of employees are at least 200. In each stratum a random sample of enterprises is selected. Number of enterprises, number of employees, and total turnover are used as allocation variables. The stratum variance on the population level is calculated for each of the allocation variables. Required sample size in each stratum is calculated with respect to each of the allocation variables to achieve a specified precision, given in terms of a relative standard error. This means that Neyman allocation is performed three times and the final sample size in each stratum is chosen according to the allocation variable that gives the largest sample size.
The calculation formula is given as:
Where
= the number of sample size in each stratum
= the total sample size for the survey and calculated as:
= the selected precision
= the sum of the allocation variable for the population
= the standard deviation in stratum with respect to the allocation variable
= the number of strata
= the population size for the survey ,
the proportion of the population in stratum h.
The minimum sample size in each stratum is five enterprises. Observe that the allocation only considers domains that agree with strata (or aggregates of strata), in other words, domains that cut across strata cannot be considered in the allocation. In addition, the allocation does not take possible nonresponse into account. The sample is coordinated over time and positively coordinated with the surveys Enterprises' IT expenditure and Community Innovation Survey to increase comparability between the three surveys.
C) Gross sample distribution
More detailed information is available in “ Annex III. Sample and standard error tables 2024 “ (Worksheet: GROSS SAMPLE)
D) Net sample distribution
More detailed information is available in “ Annex III. Sample and standard error tables 2024 “ (Worksheet: NET SAMPLE)
Annual
See detailed section in the Full metadata report.
The model questionnaire is generally used by the countries that conduct the survey on ICT usage and e-commerce in enterprises. Due to (small) differences in translation, in the used survey vehicle, in non-response treatment or different routing through the questionnaire, some results for some countries may be of reduced comparability. In these cases, notes are added in the data.
Detailed information on differences in the wording of the questions in the national questionnaires is available in “ Annex I. Completeness “ - worksheets related to questionnaire, coverage, additional questions.
Comparability between regions:
Data on NUTS 2 regional level were not delivered.
Detailed information on the provision of data on NUTS 2 regional level is available in “Annex I. Completeness“ – worksheets related to regional data.


 :
:
 is the value of the variable y for unit k,
 is the sample in stratum (d,h), is the number of units in the population in stratum (d,h) and is the sample size in stratum (d,h). In case of nonresponse,
  is replaced with the actual number of respondents in the stratum. For variables where number of enterprises are estimated,
  for enterprises responding "yes" and
  for other enterprises.
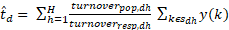
 is the sum of turnover for the population in stratum (d,h) and
  is the sum of turnover for the respondents in stratum (d,h).
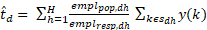
 is the total number of employees for the population in stratum (d,h) and
  is the total number of employees for the respondents in stratum (d,h).
  , replaced by number of respondents in the sample,
 ,
,  replaced by
 (the enterprises that responded).
 = the number of sample size in each stratum
 = the total sample size for the survey and calculated as:
 = the selected precision
 = the sum of the allocation variable for the population
 = the standard deviation in stratum with respect to the allocation variable
 = the number of strata
 = the population size for the survey ,
 the proportion of the population in stratum h.