The plight of young people: Europe at a turning point
With the onset of the crisis, employment rates and especially youth employment and youths' labour market performance deteriorated quite rapidly in the EU. A chart featured in the Employment and Social Situation Quarterly Review of June 2015 showed that the worst seems to be over, but it remains to be seen whether this trend reversal is confirmed.
© Stefano Cavoretto / Shutterstock
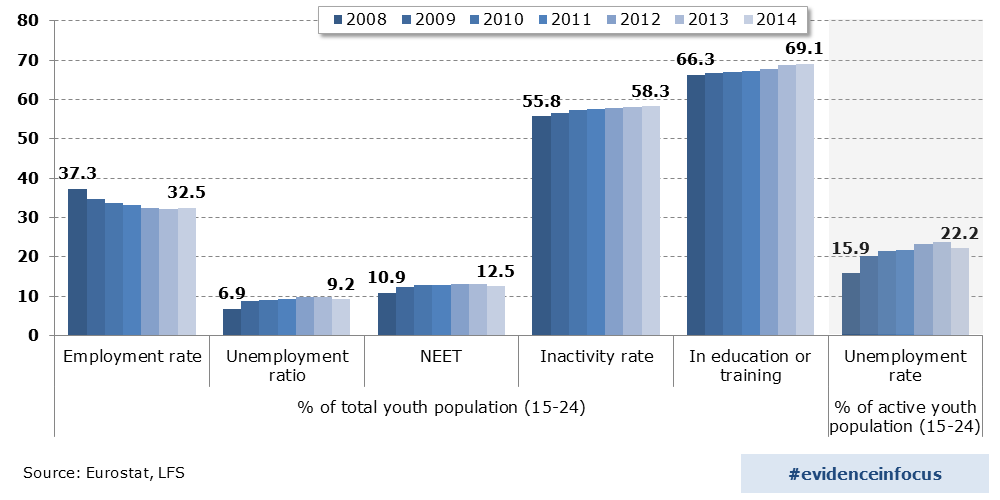
When taking a look at all young people aged 15-24 years, we saw a steady reduction in the employment rate since 2008. It got to its lowest point of 32.1% in 2013, but in 2014 is showing its first upturn. Likewise, the unemployment ratio, the share of unemployed of total youth population, (different from the unemployment rate, see below) steadily increased from 6.9% in 2008, but also turned around for the first time in 2014 and has now reached 9.2%. For those 'not in employment, education or training' (NEETs), we see the same trend where there was an increase up until 2013 and then it changed in 2014. The NEET rate is now 12.5%.
Also when looking only at the active youth population, the sum of those working or looking for work, we find the same trend reversal. This is the youth unemployment rate which peaked in 2013 at 23.7% and decreased by 1.5 percentage points in 2014. But there is some way to go until we are back to the pre-crisis level of 15.9%.
By contrast, youth inactivity rates, the share of young people who are neither working nor looking for work of total youth population, are increasing. Is this a worrying trend? Not necessarily. Labour market inactivity of young people can also be due to increased participation in education and upskilling. And this is what seems to be happening.
The chart shows that deteriorating labour market performance of youth was absorbed by increased education and training, and not just an increase in the NEET population. Yet, the proportion of young people in education and training has not declined in 2014, so poor labour market chances don’t seem to be the only reason why more young people continue their studies.
But who has gone into further education and who became NEET? This is something that we can take a look at in our next focus on youths. So in the meantime, what's the plight of the youths? Not great, but still not all bad. Let's see what the future brings.
 Note that employment rate, inactivity rate and unemployment ratio sum up to 100% of the youth population. Secondly, unemployment rate is calculated only for the active population. Source: Eurostat, unemployment series and LFS, [lfsi_emp_a, lfsi_act_a, une_rt_a, edat_lfse_20, edat¬_lfse_18]
Author: S. Jemmotte works as policy analyst at the unit of Thematic Analysis of DG EMPL.
Read here on the youth guarantee and other policies promoted by the European Commission in order to improve the employment situation of young people in the European Union.
Editor's note: this article is part of a regular series called "Evidence in focus", which will put the spotlight on key findings from past and on-going research at DG EMPL.
The views expressed in this article are those of the author and do not necessarily reflect the views of the European Commission.