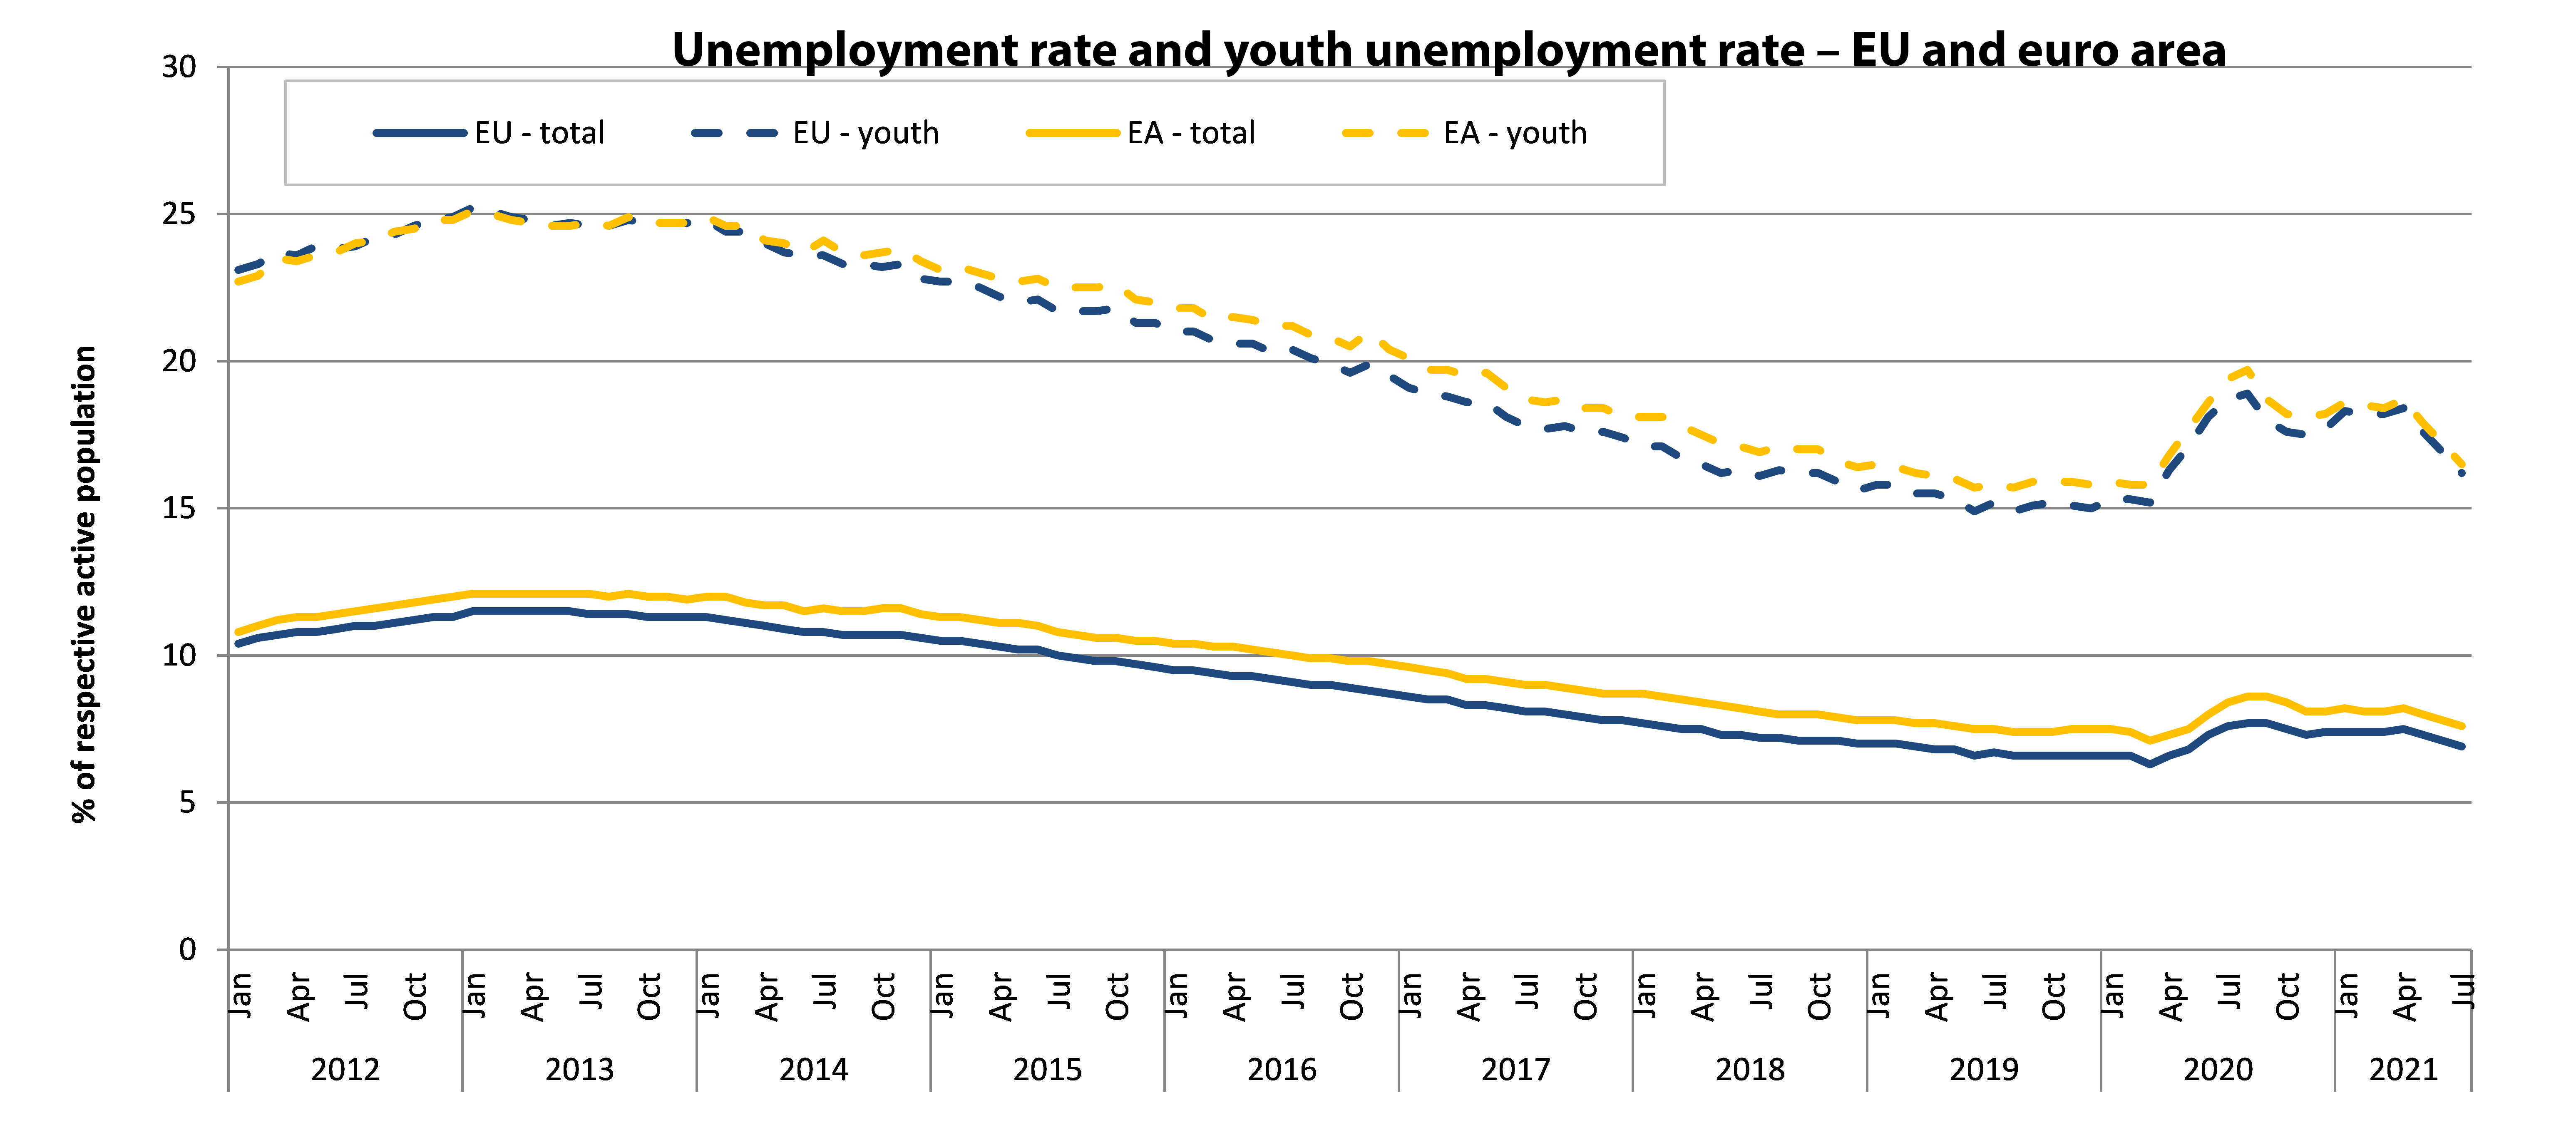
New report shows employment and unemployment rates nearly back at pre-crisis levels
The newest quarterly review of Employment and Social Developments in Europe (ESDE) shows that the EU economy and labour market have started to recover from the COVID-19 pandemic with employment and unemployment at almost pre-crisis rates.
© Shutterstock
While in some Member States, unemployment and other unmet needs for employment remain significant, companies in several EU countries and sectors already experience a shortage of labour.
Following the tragic flooding in Europe this summer, and as climate-related hazards such as these will most likely intensify, the new report comes with a thematic focus on the impact of floods on companies and workers.
An upcoming research paper shows that water damages have a significant and persistent adverse effect on the performance of firms and wages of their employees. Even after eight years, companies in the manufacturing sector hit by flooding did not show clear signs of recovery. Productivity reached its pre-flood level after about six years, but still after eight years, average wages in the impacted firms did not seem to have fully recovered.
Key findings
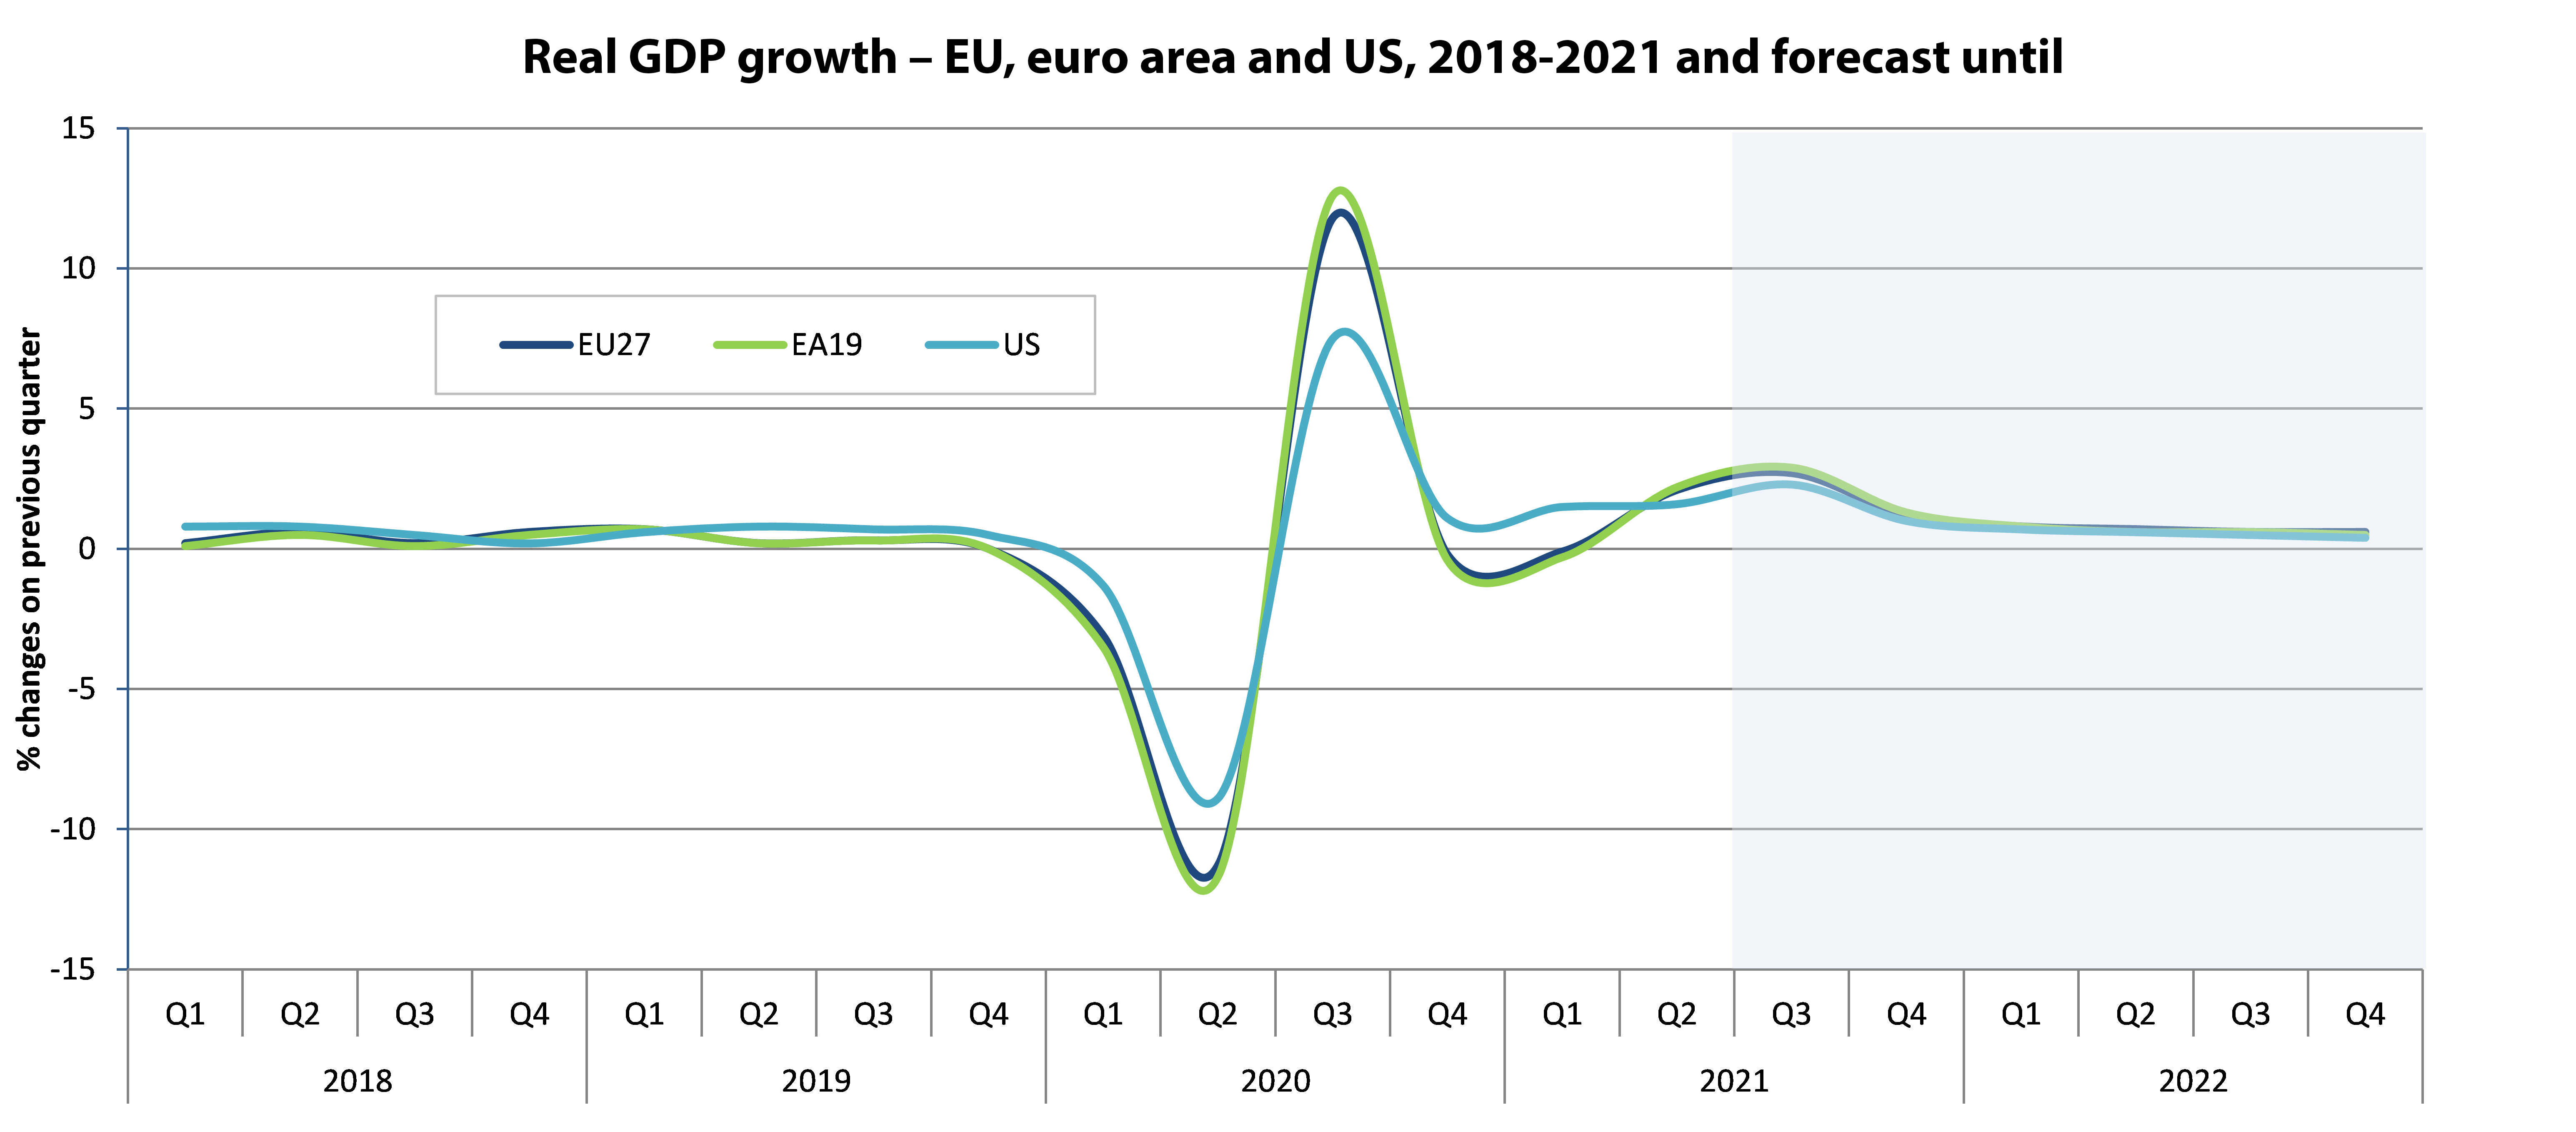
Source: Eurostat, National Accounts, seasonally and calendar adjusted data [namq_10_gdp, naidq_10_gdp]. European Commission Summer Forecast for 2021Q3 onwards except for US (Spring forecast) Notes: Forecast is in the shaded area.

Source: Eurostat, National Accounts, seasonally and calendar adjusted data [namq_10_pe]. Note: Cumulative growth (bars, right-hand scale), % change on the previous quarter (lines, left-hand scale)